Article Text

Abstract
Objective Metformin is the recommended initial drug treatment in type 2 diabetes mellitus, but there is no clearly preferred choice for an additional drug when indicated. We compare the counterfactual drug effectiveness in lowering glycated hemoglobin (HbA1c) levels and effect on body mass index (BMI) of four diabetes second-line drug classes using electronic health records.
Study design and setting Retrospective analysis of electronic health records of US-based patients in the Explorys database using causal inference methodology to adjust for patient censoring and confounders.
Participants and exposures Our cohort consisted of more than 40 000 patients with type 2 diabetes, prescribed metformin along with a drug out of four second-line drug classes—sulfonylureas, thiazolidinediones, dipeptidyl peptidase 4 (DPP-4) inhibitors and glucagon-like peptide-1 agonists—during the years 2000–2015. Roughly, 17 000 of these patients were followed for 12 months after being prescribed a second-line drug.
Main outcome measures HbA1c and BMI of these patients after 6 and 12 months following treatment.
Results We demonstrate that all four drug classes reduce HbA1c levels, but the effect of sulfonylureas after 6 and 12 months of treatment is less pronounced compared with other classes. We also estimate that DPP-4 inhibitors decrease body weight significantly more than sulfonylureas and thiazolidinediones.
Conclusion Our results are in line with current knowledge on second-line drug effectiveness and effect on BMI. They demonstrate that causal inference from electronic health records is an effective way for conducting multitreatment causal inference studies.
- treatment efficacy
- electronic medical records
- type 2 diabetes
- anti-diabetic drugs
This is an Open Access article distributed in accordance with the Creative Commons Attribution Non Commercial (CC BY-NC 4.0) license, which permits others to distribute, remix, adapt, build upon this work non-commercially, and license their derivative works on different terms, provided the original work is properly cited and the use is non-commercial. See: http://creativecommons.org/licenses/by-nc/4.0/
Statistics from Altmetric.com
Significance of this study
What is already known about this subject?
The effects of type 2 diabetes second-line drugs on glycosylated hemoglobin levels and on body mass index (BMI) have been evaluated in clinical studies. However, the clinical implication of these studies is limited by small number of participating individuals and the homogeneity of the study populations.
Meta-analysis studies have increased sample size but potentially suffer from similar homogeneity biases.
What are the new findings?
This study performs, for the first time, a large-scale analysis of the therapeutic and adverse effects of type 2 diabetes second-line drugs in real-world population using electronic health records.
We confirm current knowledge for glycosylated hemoglobin levels, while showing better effects on decreasing BMI for inhibitors of dipeptidyl peptidase 4 (DPP-4).
How might these results change the focus of research or clinical practice?
Our results show that while sulfonylureas are the most commonly prescribed second-line drugs, their estimated reduction in glycosylated hemoglobin levels is significantly smaller than the estimated effects of thiazolidinediones, glucagon-like peptide-1 agonists or DPP-4 inhibitors. DPP-4 inhibitors also show significant reduction of BMI compared with sulfonylureas and thiazolidinediones.
We demonstrated that causal inference methods can confirm and expand current knowledge in a cost-effective way and should gain increased focus when addressing epidemiological questions.
Introduction
Type 2 diabetes mellitus (T2DM) affects more than 29 million people in the USA and is the seventh leading cause of death.1 2 The American Diabetes Association Standards of Medical Care,3 supported by several studies,4 5 recommends dietary changes and physical exercise as the initial treatment, followed by administration of metformin if lifestyle changes fail to reach glycemic control. According to the Standards of Medical Care, if metformin does not achieve glycemic target within 3 months, one of the following six second-line medications should be added: sulfonylureas (SU), thiazolidinediones (TZD), inhibitors of dipeptidyl peptidase 4 (DPP-4), glucagon-like peptide-1 receptor agonists (GLP-1), sodium-glucose cotransporter 2 (SGLT2) inhibitors or insulin. Currently, the guidelines do not prefer one class over the others. The effectiveness, costs and risk of complication of those drug classes were compared in clinical trials6 and meta-analyses of their results.7–9 These comparisons found no significant difference in drug class effect on the percentage of blood glycated hemoglobin (HbA1c); thus, no specific recommendation about the choice of a second drug could be made.10
Notably, clinical trials are laborious and costly. Trials often include small samples with limited representativeness of the target population (eg, between 2005 and 2012, the Food and Drug Administration approved drugs based on a median number of 2 clinical trials and the median number of patients enrolled was 76011). Meta-analyses of clinical trials may have higher power and be more generalizable, but are also vulnerable to publication bias, small-study effects and limited degree of heterogeneity.12
Electronic health records (EHRs) hold promise as an alternative approach to conduct causal inference experiments that can address some of these imitations.13 14 Specifically, secondary use of EHRs requires lower costs, can scale to a large number of patients and better represents the heterogeneity in the population. There are trade-offs to using the EHR approach, and such analyses may suffer from three major limitations: First, patients may get treatment outside the institutions included in the EHR, resulting in missing and fragmented data.15 Second, confounders play a crucial role in effect size estimation and their identification is challenging.16 Third, differences in protocols or adoption rate for new medications across institutions may obscure true effect size and might not be generalizable beyond the database from which they are derived.17
Here, our aim is to compare the effects of T2DM second-line drugs using a real-world evidence approach. We emulate a multiarm clinical trial of four classes of drugs for diabetes, commonly used as second-line treatment (SU, TZD, DPP-4 and GLP-1). We compare the counterfactual (ie, potential) effectiveness (in terms of HbA1c levels) and body mass index (BMI) outcomes of 17 082 patients over the course of 12 months, adjusting for confounders and censoring (additional 23 789 patients). For reference, a recent meta-analysis of antidiabetes drugs8 was based on data of about 18 000 patients. We describe the measures we have taken to address the aforementioned limitations of causal inference from EHR data. Our results are in line with current knowledge, thus demonstrating that causal inference from EHRs is an effective way for conducting multitreatment causal inference studies.
Research design and methods
Study design
Data source
We used the Explorys database (IBM), which includes EHR records of approximately 50 million patients, pooled from multiple different healthcare systems in the USA. Data consist of a combination of clinical EHRs, healthcare system outgoing bills and adjudicated payor claims, are standardized and normalized using common ontologies, including SNOMED and The National Drug File - Reference Terminology, and are searchable through a Health Insurance Portability and Accountability Act of 1996-enabled, de-identified database tools. The EHR data include patient demographics, diagnoses, procedures, prescribed drugs, vitals and laboratory values.
Cohort definition
We defined a cohort of patients with T2DM based on the Northwestern University diabetes phenotyping algorithm,18 comprising 40 871 patients, using the following criteria:
Inclusion criteria
Our analysis considered T2DM patients, identified by having at least two types of evidence for T2DM, out of T2DM diagnosis, T2DM-specific drugs, and indicative lab values (fasting and random glucose or HbA1c levels). We included only patients who were first prescribed metformin and subsequently prescribed, during the years 2000–2015, a second-line drug belonging to any of four classes: SU, TZD, inhibitors of DPP-4 and GLP-1 agonists (online supplementary table 1 lists drugs for each drug class).
Supplementary tables and figure captions
The first prescription with order status marked as completed (ie, that it was not canceled or erroneous) of the second-line drug was considered the ‘index-date’ (emulating the date of intervention allocation and initiation in clinical trials).
We required the patients to have at least 12 months of documented pretreatment observation period prior to the index date.
Exclusion criteria
Patients with type 1 diabetes mellitus, identified by either a type 1 diabetes diagnosis code or prescription of pramlintide (approved also for patients with T2DM who use insulin), as well as patients prescribed more than one second-line drug classes on the index date were excluded from the analysis. Our analysis did not include the following three second-line medications: SGLT2 inhibitors, meglitinides and α-glucosidase inhibitors due to the low number of patients receiving it within our data (185, 429 and 153 patients with available HbA1c measurements, respectively). We did not compare insulin because it is not commonly considered as the first choice for second-line therapy in clinical practice; it is also administered to patients with more advanced or severe disease than oral agents1; and patient acceptance of insulin often involves unique psychological and social factors that are not part of our cohort data, nor usually recorded in the EHR. These factors are likely to be important confounders and no analysis that uses this type of data could adjust for them.
Outcomes and follow-up time
As outcomes, we used HbA1c and BMI at two follow-up periods, 6 and 12 months after the index date. We averaged the HbA1c and BMI over ±3 month windows for each period (3–9 months for the first follow-up period and 9–15 months for the second; figure 1). We chose a 12-month pretreatment observation period to ensure that the second-line drug is prescribed for the first time as, for example, 99% of patients receiving SU have prescription period <12 months. It also balances the need for a complete and stable baseline (ie, longer period) with the need to include more patients and avoid bias due to exclusion of patients with relatively limited histories in our data (ie, a shorter period). We chose follow-up periods of 6 and 12 months (averaging over ±3 month windows, resulting in 15 months in total) since they provide a good estimate of the short to intermediate effects of the drugs and correspond to the majority of random clinical trial follow-up time interval.6 8 We required each patient to have at least one HbA1c measurement during the pretreatment observation period.

Illustration of the causal inference scheme. (A) Index date is the first prescription of diabetes second-line drug after use of metformin. (B) Potential censoring events include switching to another second-line drug, missing glycated hemoglobin (HbA1c) or body mass index (BMI) measurement, or undergoing bariatric surgery. (C) Outcomes (HbA1c and BMI) are checked after 6 and 12 months from index date. (D) Follow-up ends after 15 months.
Analysis methods
We considered two potential biases: (1) selection bias due to censoring; and (2) confounders, affecting both treatment choice and measured outcome (HbA1c levels or BMI).
In order to handle these two biases, we extracted patient characteristics within the pretreatment observation window using the feature engineering framework of Ozery-Flato et al.19 The comprehensive set of features included demographic information (age, sex, ethnicity), insurance type, patient-aggregated diagnoses using Clinical Classifications Software categories, categories of Charlson20 and Elixhauser comorbidity indexes,21 prescribed drugs (active ingredients), and laboratory results values over the baseline period. Diagnosis codes and drugs are binary features (measuring the existence of a diagnosis or a drug prescription for that patient). Categorical features, such as insurance type or ethnicity, were split into binary features. For lab values, we included the number of times a lab value was measured within the baseline period, and the maximal, minimal and average values within that period. For the HbA1C outcome, we also included the last measurement before treatment and the time from first diabetes diagnosis (based on the Northwestern University diabetes phenotyping algorithm). As a preliminary step, we filtered features that were dominated (>95% of patients) by a single value or were spurious (>80% with missing values), resulting in 632 features. Missing lab values were imputed using the median value of the test across patients.
Censoring analysis
For both HbA1c and BMI inference, we considered patients as censored if they received a second-line treatment, but during the follow-up period (1) had no 6-month or 12-month HbA1C or BMI measurements; (2) switched or added another antidiabetic drug (including the following drug classes, which were not directly evaluated in this work: insulin, SGLT2 inhibitors, meglitinides and α-glucosidase inhibitors); or (3) underwent bariatric surgery. We corrected for censoring by reweighing the uncensored population using inverse probability of censoring weighting (IPCW).22
Confounder analysis
We defined the set of confounders in two ways: (1) domain expert confounder set, manually selected by an internist, aided by literature search; and (2) a comprehensive confounder set, treating all the 632 extracted features as confounders. In total, we selected 34 domain expert confounders for HbA1c inference (online supplementary table 2) and 8 domain expert confounders for BMI inference (online supplementary table 3). We used doubly robust (DR) estimator suggested by Robins et al 23 to correct for confounders. This estimator combines a model for the distribution of the counterfactual outcome (standardization) and a treatment assignment mechanism model (inverse probability of treatment weighting, IPTW). As demonstrated by Bang and Robins,24 DR estimators improve on either estimators because they are consistent even when only one of the models is correctly specified. This makes DR especially suited for observational data, where one can never be sure that either model is correct. For the outcome model, we used ridge regression with fivefold cross-validation to adjust the regularization coefficient. For the treatment model, we used multiclass logistic regression with the regularization strength set to one and using balancing of the class sizes. Next, similar to Gerhard et al 25 we multiplied the IPCW weights obtained from the censoring model with the IPTW weights from the treatment model, and capped weights smaller than the first and larger than the 99th percentiles to their corresponding percentiles, as suggested by Cole and Hernán.26 Capping the weights trims the tails of the distribution of the inverse probability weighted estimator, reduces instability and was shown to work better than removing the concerned units altogether.27 We then fed these weights into the outcome model to compute the DR estimator.
Supplementary file 8
Supplementary file 9
Based on Groenwold et al,28 we also tested the results of stratification of continuous variables, for example, age and lab values, into five categories to prevent introduction of residual confounding. We obtained similar counterfactual mean values to the non-categorized values but larger confidence intervals (CIs) and thus omitted these results for brevity.
As suggested by Austin,29 the standardized difference,  , can be used to quantify covariate imbalance across subject groups. Specifically, for continuous confounders:

where  and
and  denote the sample mean of the covariate in treated and untreated subjects, respectively, whereas
  and
and  denote the sample variance of the covariate in treated and untreated subjects, respectively.
And, for dichotomous confounders:

where  and
and  denote the prevalence or mean of the dichotomous variable in treated and untreated subjects, respectively.
We followed Austin29 and tested for imbalance in the confounders after correcting for the treatment models and censoring by comparing the number of confounders that were below the 0.1 threshold before and after weighing. For additional validation, we applied our inference scheme to two negative controls30: patient height and pretreatment HbA1C, which are unaffected by treatment type. For the outcome of pretreatment HbA1C, we excluded pretreatment HbA1C from the set of confounders.
Patient involvement
No patients were involved in setting the research question or the outcome measures, nor were they involved in developing plans for design or implementation of the study. No patients were asked to advise on interpretation or writing up of results. There are no plans to disseminate the results of the research to study participants or the relevant patient community.
Results
Study design
Our cohort included 40 871 patients. Of these, 28 328 also had available BMI before the prescription of second-line drugs and were used for inference of counterfactual BMI (tables 1 and 2, online supplementary figure 2–3). There were significantly more censored patients on TZD, GLP-1 or DPP-4 who switched or added another drug than patients on SU (censored patients, p<2e−109; tables 1 and 2). TZD and SU had significantly higher percentage of patients with missing BMI measurements during the follow-up than GLP-1 and DPP-4 (p<3e−8; table 2). Finally, the patients on GLP-1 were about 6 years younger on average (p~0) and included significantly higher rate of women (p<3e−44; table 1). The patient age distribution (online supplementary figure 1) is similar to the age distribution published by the Centers for Disease Control and Prevention (CDC) for 2011.31
Supplementary file 1
Descriptive statistics of patients on T2DM second-line drug classes for the HbA1c outcome
Descriptive statistics of patients on T2DM second-line drug classes for the BMI outcome
Analysis methods
We applied causal inference methods to compute the counterfactual HbA1c levels and BMI (for each one of the four drug classes) at each of the two follow-up time points, adjusting for censored patients and confounders (Research design and methods).
Our balancing test (methods) showed that the percentage of balanced confounders, with negligible difference between treatment groups (standardized difference ≤0.1), ranged between 87% and 97% (comprehensive set and domain expert set in BMI outcome, respectively); online supplementary figures 2–5 display scatter plots of the absolute standardized difference before and after the correction. We found no significant differences between patients on different drug classes when using negative controls of patient height, while finding differences of up to 0.08% in HbA1c levels before index date between GLP-1 and SU or TZD (see Discussion).
HbA1c outcome
HbA1c measurements were available for 83% of the patients from up to 90 days prior to initiation of second-line treatment, and for 95% of the patients up to 180 days (see online supplementary figure 6 for complete temporal distribution).
Supplementary file 6
The differences in estimated HbA1c levels using the domain expert and comprehensive sets of confounders were lower than 0.03%. All four drug classes were predicted to reduce HbA1c levels below 7% after 12 months of treatment, with a predicted reduction in HbA1c levels relative to baseline over the entire population of 0.6%–0.61% (SU, domain expert and comprehensive set correction, respectively) to 0.85%–0.83% (GLP-1, domain expert and comprehensive set correction, respectively) (online supplementary table 5, figure 2). Twelve-month HbA1c levels inferred for SU were significantly higher than for TZDs, DPP-4 and GLP-1 by 0.09%–0.24% (Wald test, p<3e−5; online supplementary table 6). Inferred levels for DPP-4 were significantly higher than TZD after 12 months and higher than GLP-1 after 6 months of treatment, but differences became insignificant after 12 months (online supplementary table 6). Notably, both actual and inferred HbA1c levels were lower than those computed using the mixed-treatment comparison (MTC) of clinical trials of McIntosh et al.7 8
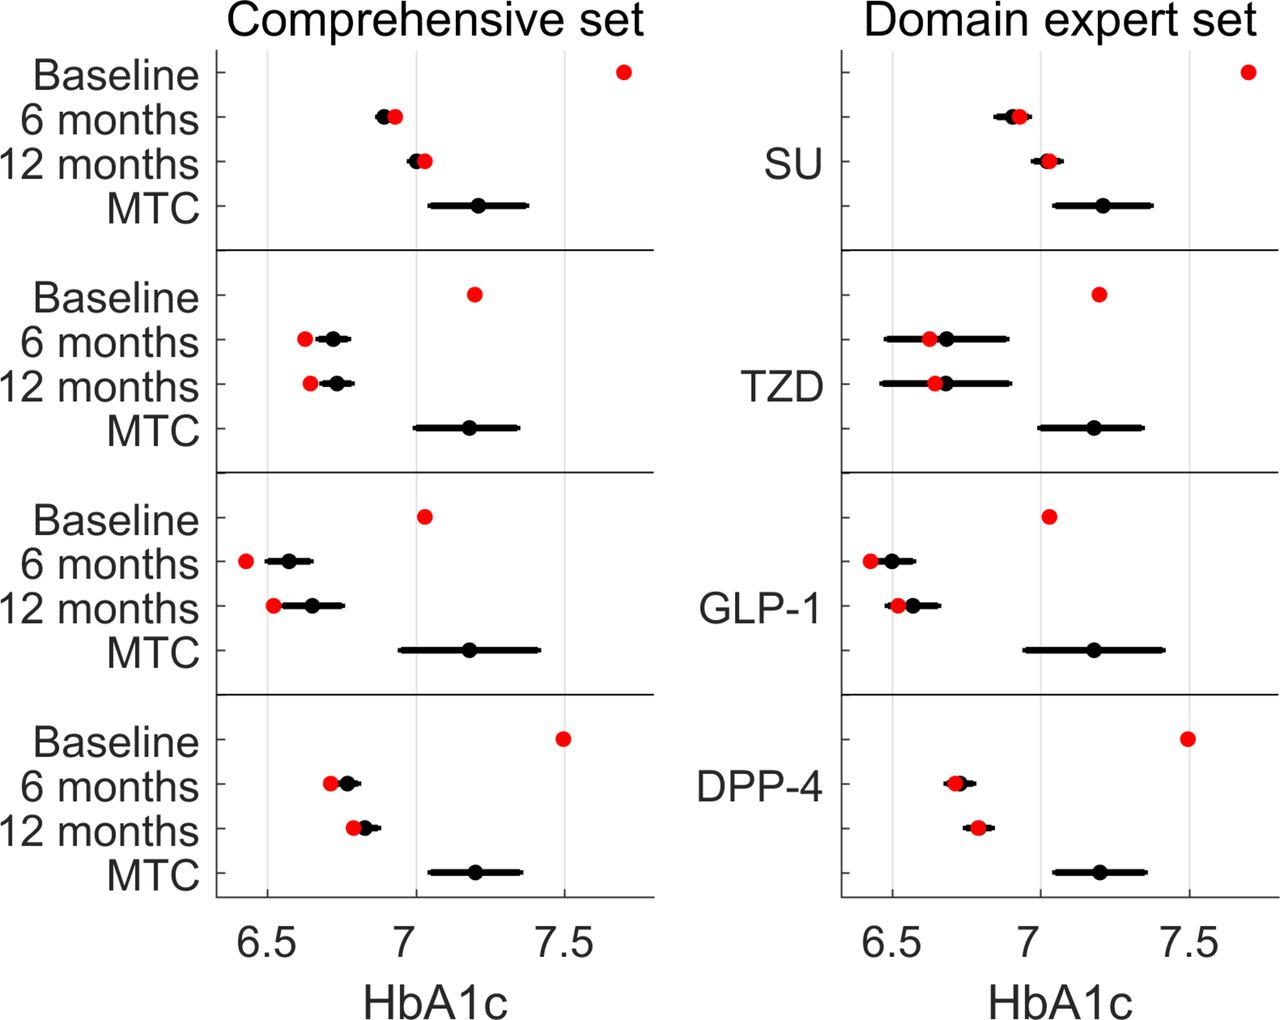
Predicted and observed HbA1c levels using doubly robust estimation adjusting for either a comprehensive set of confounders (left panel) or a set of confounders provided by a domain expert (right panel). Red dots indicate the actual measurements of patients at baseline (before second-line treatment), after 6 and 12 months. Black dots (with error bars) represent the counterfactual predictions and 95% CIs, supposing all patients were treated with that drug class. The results of the Bayesian mixed-treatment comparison (MTC) meta-analysis by McIntosh et al 7 8 are marked MTC. DPP-4, dipeptidyl peptidase 4; GLP-1, glucagon-like peptide-1 receptor agonists; HbA1c, glycated hemoglobin; SU, sulfonylurea; TZD, thiazolidinedione.
BMI outcome
BMI measurements were available for 78% and 83% of the patients as recent as 90 and 180 days prior to treatment date, respectively (see online supplementary figure 7 for complete time distribution).
Supplementary file 7
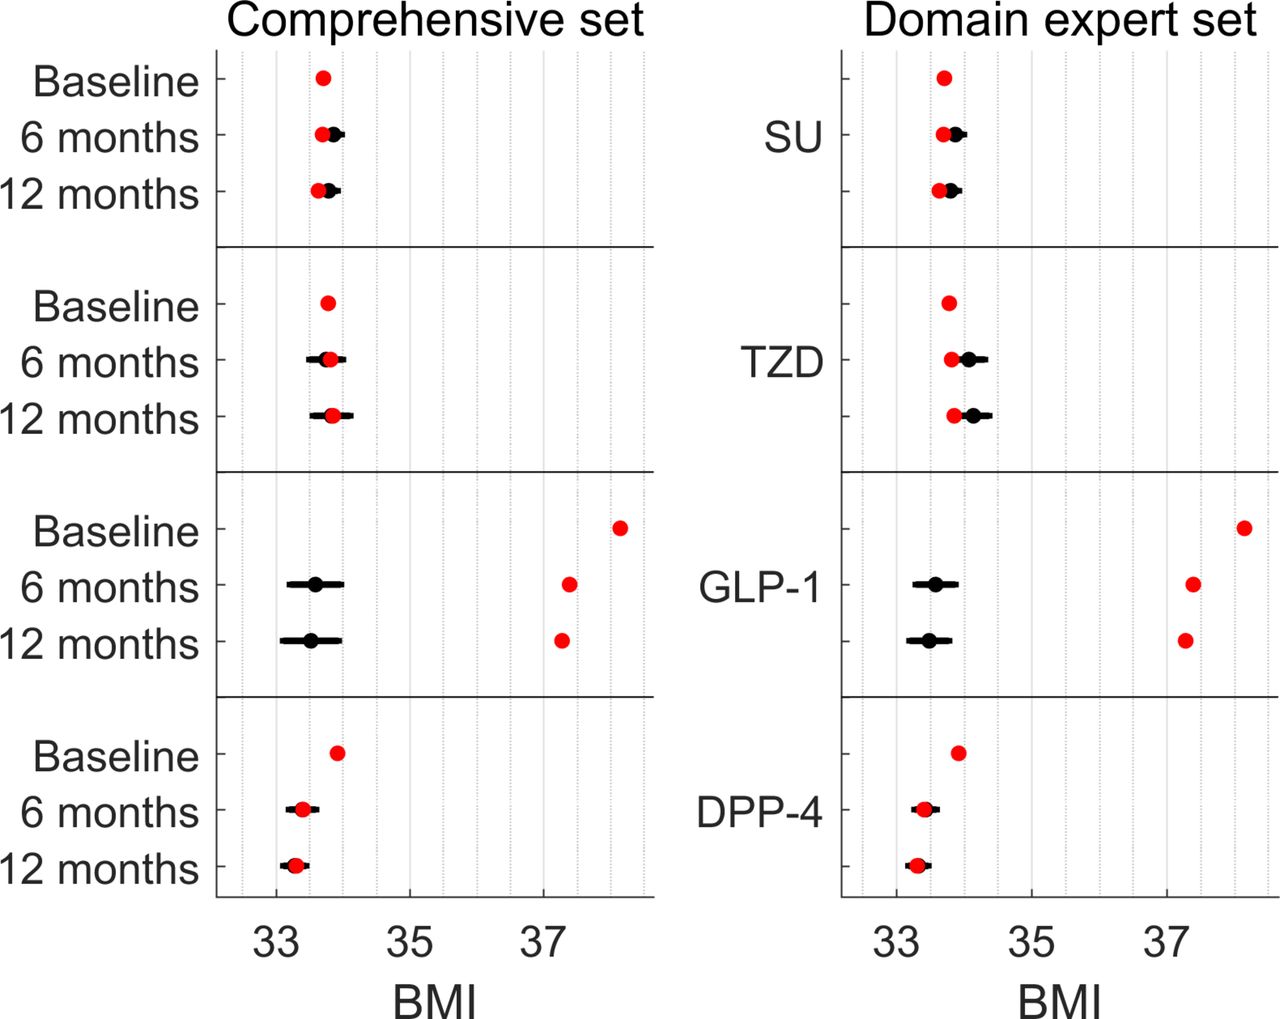
The predicted BMI after 12 months was significantly lower for patients on DPP-4 than for patients on SUs or TZDs by 0.47–0.81 kg/m2 (Wald test, p<8e−4; figure 3, online supplementary figure 7–8), but not significantly lower than the predicted BMI for patients on GLP-1. On average, patients on GLP-1 had higher BMI (by 4.2–4.4 kg/m2; online supplementary figure 7) before the prescription of second-line treatment compared with patients prescribed one of the other studied drug classes. These GLP-1 patients had lowered their BMI by 0.87 kg/m2 on average. Our predicted BMI shows significant advantage for GLP-1 over TZD based on the domain expert confounder set, but not statistically significant based on the comprehensive confounder set. It also shows no significant advantage over SU in a population with lower initial BMI (online supplementary supplementary table 8; see also discussion on BMI and GLP-1).

![[SP1.jpg]](https://drc.bmj.com/content/bmjdrc/5/1/e000435/DC4/embed/inline-supplementary-material-4.jpg?download=true)
![[SP6.jpg]](https://drc.bmj.com/content/bmjdrc/5/1/e000435/DC5/embed/inline-supplementary-material-5.jpg?download=true)
![[SP7.jpg]](https://drc.bmj.com/content/bmjdrc/5/1/e000435/DC6/embed/inline-supplementary-material-6.jpg?download=true)
Predicted and observed BMI levels using doubly robust estimation adjusting for either a comprehensive set of confounders (left panel) or a set of confounders provided by a domain expert (right panel). Red dots indicate the actual measurements of patients at baseline (before second-line treatment), after 6 and 12 months. Black dots (with error bars) represent the counterfactual predictions and 95% CIs, supposing all patients were treated with that drug class. BMI, body mass index; DPP-4, dipeptidyl peptidase 4; GLP-1, glucagon-like peptide-1 receptor agonists; SU, sulfonylurea; TZD, thiazolidinedione.
Discussion
We presented a causal inference analysis of observational EHR data to compare the effect of adding a second-line treatment for T2DM on HbA1c and BMI, in patients already treated with metformin. Our inferred HbA1c levels for up to 12 months of follow-up suggest that the effect of TZD, DPP-4 and GLP-1 inhibitors is comparable, whereas that of SU is smaller. While TZD and SU have a negligible effect on BMI, DPP-4 and GLP-1 reduce BMI after 12 months of treatment.
The analyzed data contain privately insured employees, Medicare and Medicaid. While the data potentially under-represent children and young adults, as this population is rarely confronted with T2DM, there was no major bias introduced, as can be seen by the comparison of the age distribution in online supplementary figure 1 to the distribution published by the CDC for 2011.31
We addressed three challenges associated with causal inference from EHRs, including fragmented data, identification of the true set of confounders, and differences in protocols or adoption rate across institutions. To address fragmented data, we corrected for potential selection bias using patients with incomplete data as censored. In order to reduce the probability of incorrectly specifying confounders or correcting for them, we took the following three measures: For the first measure, we compared confounder sets based on domain expertise with a comprehensive set of confounders based on available clinical and demographic information of the patient to find minor differences in predicted outcomes. We showed the DR estimator improves balancing of confounders for both confounder sets and especially for the domain expert sets, but as noted by Austin29 for propensity score models, in many settings it is likely that one can safely include all measured baseline characteristics in the models. For the second measure, we tested whether we could reduce residual confounding by stratifying continuous values, such as age and lab tests, to five categories, as suggested by Groenwold et al.28 Finally, we used DR estimation in order to account for potential misspecification of either the treatment or outcome models.24 The DR estimator did not identify difference between drug classes for the negative control of patient height, but did identify small but significant differences in the control of pretreatment HbA1C with regard to GLP-1. This does not affect the overall conclusions of the paper, but suggests that with regard to GLP-1, pretreatment HbA1C cannot be fully explained by other confounders.
Explorys database is an amalgamation of patient data from multiple clinics. While the data have undergone standardization and normalization procedures to account for the differences between healthcare facilities, our estimated effect sizes might deviate from the true effects in individual healthcare facilities. Additionally, we could not account for potential environmental confounders that are not available in EHR data, such as lifestyle changes.
We consider HbA1c and BMI as good proxies for future patient risk,32 but there are other considerations in selecting a second-line drug beyond its effect on these measures, such as risks of adverse reactions and of diabetes-related complications. While we did not directly address adverse reactions, patients who were switched drug classes may indirectly point to such effects. These outcomes should be studied in subsequent work, potentially observing patients for longer follow-up periods to gain stronger statistical power. Other extensions should focus on differences between individual drugs from the same class, which could have different outcomes (such as different drugs from the SU class33).
Patients prescribed SU were less likely to be added a third drug or switched to another drug than patients on the other drugs studied (16% of the patient on SU relative to >24% of the patients on the other three drug classes, p<e−150). This is despite the effect of SU on HbA1c being somewhat smaller. Possible explanations for this observation may include the low cost of SU, the availability of a metformin-SU pill34 and the option of once-a-day dosing. Additionally, SU and TZD patients had significantly lower availability of BMI measurements during the follow-up period. Possible explanations for this are that when GLP-1 or DPP-4 treatments are prescribed, either the physician or the patient is more likely to have been concerned with the BMI, thus measures it more frequently; or that costs of SU and TZD tend to be lower and would be more frequently prescribed to patients with a lower socioeconomic state, which tend to be less well followed up on.
There may have been some unmodeled confounding present in the relationship between GLP-1 and HbA1C, considering that a small but significant association arose with the negative control of pretreatment HbA1C. We note that GLP-1 agonists are prescribed significantly more to women. Difference in response to GLP-1 between men and women was reported in 2005,35 and a study from 2013 found that the effect of one such GLP-1 agonist, exenatide, was larger in women.36 All patients in our study were treated with GLP-1 after 2005 and 38% of them treated during or after 2013, suggesting physicians may have considered this evidence when prescribing GLP-1. Also, patients on GLP-1 are typically younger than patients on other drug classes, in line with an observation made by others.37 Finally, patients with higher BMI tend to be prescribed GLP-1, and this is likely due to its known positive effect on weight.38 39 In our analysis, though, DPP-4 inhibitors are estimated to lead to BMI reduction comparable to GLP-1 agonists.
TZD is the only class predicted to maintain HbA1c at a stable level in 6 and 12 months, whereas HbA1c levels are predicted to increase over time in the other studied classes. A gradual weaning of the effect of SU on HbA1c levels had been previously described.13
The estimates of HbA1c8 reported in the meta-analysis (MTC) we used for reference were higher than our EHR-based inference. We note that we predicted HbA1c in exact periods, while the MTC method combined heterogeneous time point measurements across the different clinical trials, some listed as having up to 5 years of follow-up. This may suggest that the meta-analysis captured later stages in the progression of T2DM, characterized by higher HbA1c levels.40
As demonstrated by our analysis, as well as by others,41 EHR data can support causal inference and allow replication of clinical trial results. The advantages of this approach in terms of the labor and costs required to expand evidence-based medicine are clear. As the availability of EHR data increases and the many theoretical and technical challenges associated with detecting and correcting for confounders are addressed, we expect causal inference based on observational data to become more widely used.
Supplementary file 2
![[SP2.jpg]](https://drc.bmj.com/content/bmjdrc/5/1/e000435/DC7/embed/inline-supplementary-material-7.jpg?download=true)
Supplementary file 3
![[SP3.jpg]](https://drc.bmj.com/content/bmjdrc/5/1/e000435/DC8/embed/inline-supplementary-material-8.jpg?download=true)
Supplementary file 4
![[SP4.jpg]](https://drc.bmj.com/content/bmjdrc/5/1/e000435/DC9/embed/inline-supplementary-material-9.jpg?download=true)
Supplementary file 5
![[SP5.jpg]](https://drc.bmj.com/content/bmjdrc/5/1/e000435/DC10/embed/inline-supplementary-material-10.jpg?download=true)
Acknowledgments
We would like to thank Omer Weissbrod for helpful inputs and suggestions, Michal Ozery-Flato for help with feature engineering tasks, and the anonymous reviewers for the exceptionally constructive comments. We are also grateful to the Explorys team, and in particular to Euricka S Thomas and Gabriel Olinger, for the continued support and advice.
References
Footnotes
Contributors AG and CY designed and performed the experiments. AC compiled domain expert confounders. AG, CY, AC and YG wrote the manuscript. AG and CY are guarantors of the paper.
Competing interests None declared.
Provenance and peer review Not commissioned; externally peer reviewed.
Data sharing statement No additional data are available.