Article Text

Abstract
Objective To determine the association between drinking water quality and rates of type 1 diabetes in the Newfoundland and Labrador (NL) population, which has one of the highest incidences of type 1 diabetes reported globally.
Research design and methods The study used a community-based, case-control design. We first calculated incidence rates of type 1 diabetes at the provincial, regional and community levels. The connection between incidence rates and components in public water supplies were then analyzed in three ways: to evaluate differences in water quality between communities with and without incident cases of type 1 diabetes, and to analyze the relationship between water quality and incidence rates of type 1 diabetes at both the community and regional levels.
Results The provincial incidence of type 1 diabetes was 51.7/100 000 (0-14 year age group) for the period studied. In the community-based analysis, there were significant associations found between higher concentrations of arsenic (β=0.268, P=0.013) and fluoride (β=0.202, P=0.005) in drinking water and higher incidence of type 1 diabetes. In the regional analysis, barium (β=−0.478, P=0.009) and nickel (β=−0.354, P=0.050) concentrations were negatively associated with incidence of type 1 diabetes.
Conclusions We confirmed the high incidence of type 1 diabetes in NL. We also found that concentrations of some components in drinking water were associated with higher incidence of type 1 diabetes, but no component was found to have a significant association across the three different levels of analysis performed.
- type 1 diabetes mellitus
- incidence
- Newfoundland and Labrador
- Canada
- drinking water quality
- arsenic
- fluoride
- barium
- nickel
This is an Open Access article distributed in accordance with the Creative Commons Attribution Non Commercial (CC BY-NC 4.0) license, which permits others to distribute, remix, adapt, build upon this work non-commercially, and license their derivative works on different terms, provided the original work is properly cited and the use is non-commercial. See: http://creativecommons.org/licenses/by-nc/4.0/
Statistics from Altmetric.com
- type 1 diabetes mellitus
- incidence
- Newfoundland and Labrador
- Canada
- drinking water quality
- arsenic
- fluoride
- barium
- nickel
Significance of this study
What is already known about this subject?
There is debate about the role that water quality has on incidence rates of type 1 diabetes.
Newfoundland and Labrador (NL) has one of the highest reported incidences of type 1 diabetes worldwide.
What are the new findings?
Some drinking water components were associated with higher rates of type 1 diabetes in NL.
No component was found to have a statistically significant association across all of the analysis conducted.
How might these results change the focus of research or clinical practice?
This study adds new data concerning the role water quality has on rates of type1 diabetes.
It also highlights particular water components that should be the focus of future research.
Introduction
Previous studies have identified drinking water quality and compounds found in drinking water as potential environmental risk factors for the development of type 1 diabetes.1 High levels of mercury, arsenic and acidity (low pH) of water have been previously associated with an increased incidence of type 1 diabetes.1–4 Park et al 5 found that total urinary arsenic was associated with insulin sensitivity but not β-cell function measures, suggesting that low-level arsenic exposure may influence diabetes risk through impairing insulin sensitivity in adults.
The potential toxic effects of nitrate-nitrite-nitrosamine on β cells function have remained a controversial issue over the past two decades.6 Parslow et al 2 in the UK, Kostraba et al 7 in the USA and Moltchanova et al 8 in Finland reported that the incidence of type 1 diabetes was positively associated with high nitrate levels in drinking water. They suggested that low-level nitrate exposure through drinking water may play a role in the etiology of type 1 diabetes, perhaps as a promoter through the generation of free radicals. In contrast, other studies have concluded that there is a lack of convincing evidence that nitrate levels in drinking water are a risk factor for childhood type 1 diabetes.9–11
The data from other ecological studies suggest that the incidence rate of type 1 diabetes is significantly lower when the concentrations of zinc and magnesium in the domestic drinking water are in the range 22.27–27.00 mg/L (incidence rate ratio (IRR) 0.76; 95% CI 0.59 to 0.97) and >2.61 mg/L (IRR 0.72; 95% CI 0.58 to 0.91).12–14 It has been also suggested that zinc, magnesium, calcium, chromium and to some extent copper, have a protective effect against developing type 1 diabetes.11 12 15 16 Zinc is involved in cellular antioxidative defense and mostly found in the secretory vesicles of β-cells in the pancreatic islets. Magnesium is an essential cofactor helping insulin to bind to the insulin receptor. Therefore, lower serum zinc and magnesium are significantly associated with type 1 diabetes .17 While all of these studies point to a possible connection to various elements found in water, the impact of water quality on the incidence of type 1 diabetes is still inconclusive .18
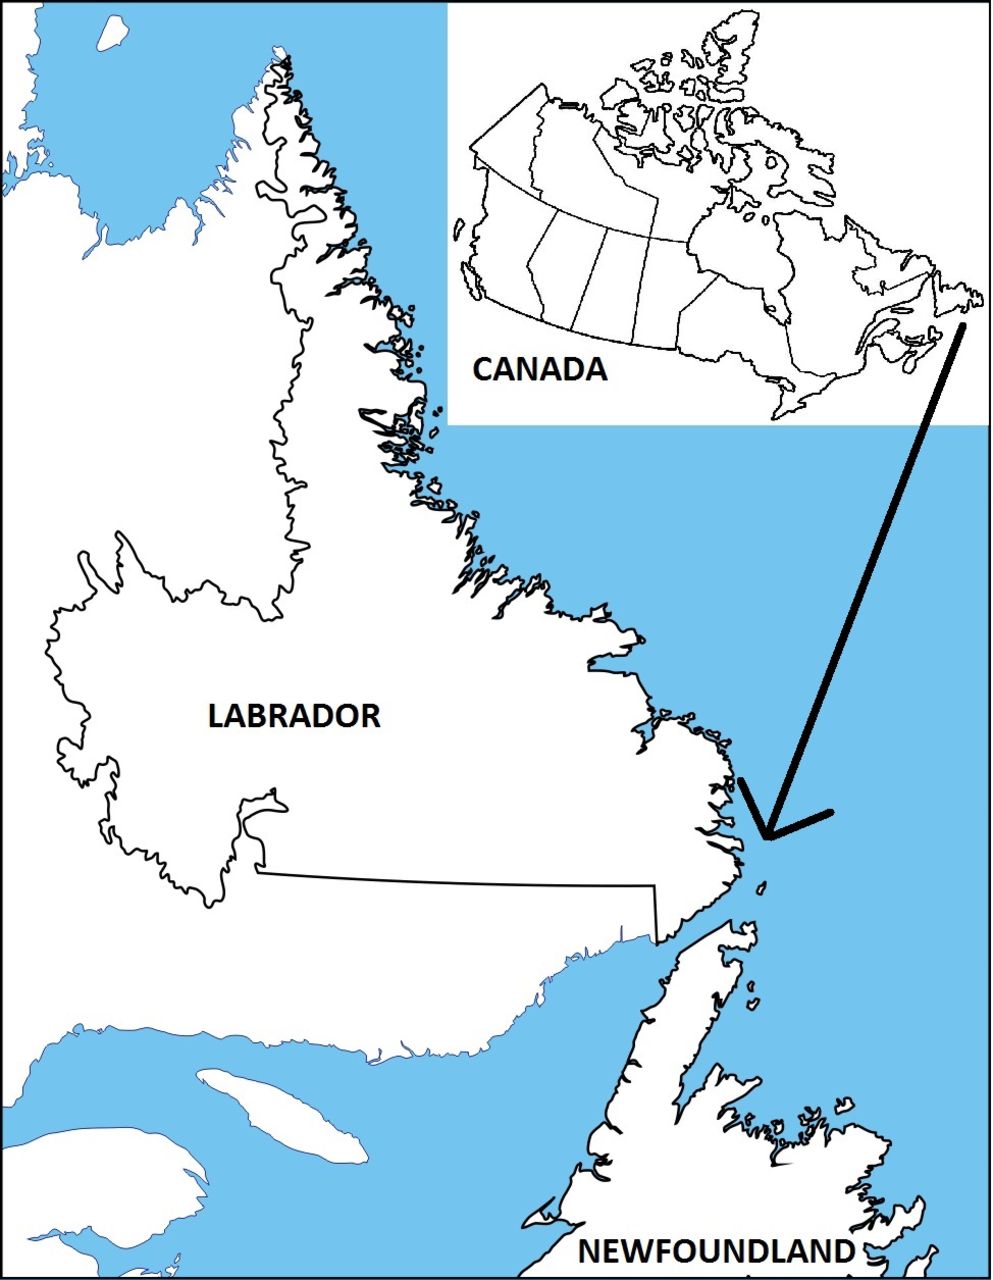
The Canadian province of Newfoundland and Labrador (NL) is a well-suited location to study environmental triggers associated with type 1 diabetes (figure 1). The province has a distinctive geography, and a stable population in terms of its size and geographic distribution during the study period. NL has the second highest incidence rate of type 1 diabetes globally, after Finland (in 2011 with 57.6/100 000; 0 to 14 yearage group).19 For the period between 1987 and 2005, the incidence of type 1 diabetes in the NL population was 35.08/100 000 (95% CI 32.54 to 37.62), with a steady increase in rates over this time period.20 For 2007–2010, the incidence rose over to 49.9/100 000 (95% CI 42.2 to 57.6).21 The incidence increased significantly in all age groups, with the highest rates of type 1 diabetes in the 2007–2010 period for ages 5–9 (IRR 59.1; 95% CI 45.0 to 76.3).21 NL also demonstrates significant geographical variations in incidence rates of type 1 diabetes, with some areas having half the incidence rate as compared with other regions.

Map of Newfoundland and Labrador.
Approximately 70% of the provincial population has access to publicly supplied water.22 The NL Department of Environment and Climate Change23 provides regular water quality monitoring and public reporting for all public water sources.24 Public water supply systems treat water to ensure it is free from any microbiological contamination and measures 39 chemical and physical parameters of the Guidelines for Canadian Drinking Water Quality.25 Using longitudinal data on both incidence rates of type 1 diabetes and the components identified in the testing of public water supply, we sought to explore the relationship between various components found in drinking water and the development of childhood-onset type 1 diabetes.
Methods
The Water Resources Management Division of the Provincial Department of Environment and Climate Change25 26 systematically collects and analyzes water samples from all publicly sourced water since 2000. The water variables captured include water pH, ammonia, nitrates, nitrites, nitrogen, phosphorous, aluminum, antimony, arsenic, barium, cadmium, chromium, copper, iron, lead, magnesium, manganese, mercury, nickel, selenium, uranium and zinc.25 Cases of type 1 diabetes were identified using the Newfoundland and Labrador Pediatric Diabetes Database (NLPDD), maintained by the Janeway Pediatric Research Unit. This database contains data on all cases of type 1 diabetes diagnosed in children from 1987 to 2012. Classification and case definitions of type 1 diabetes are described elsewhere.20 21
This study used a community-based, case-control design. Communities were included in the analysis if they had a single public water supply which was monitored by the Provincial Department of Environment and Climate Change;, had at least 12 water quality measurements taken between January 2000 and December 2012, and had community-specific data reported by Statistics Canada, which was used to abstract community population data for the study period. Water quality data for each community was averaged over the sampling period to produce one representative value for each indicator. The water components and characteristics used in the analyses are presented in table 1. Cases of type 1 diabetes were assigned to communities based on self-reported place of residence at time of diagnosis, and included only cases diagnosed during the study period. Cases occurring in communities not supplied by public water were excluded from the analyses.
Water quality indicator levels between communities reporting cases of type 1 diabetes during the study period and those reporting none
The data were analyzed in three ways. We first compared communities with at least one case of type 1 diabetes with communities that had no cases type 1 diabetes during the study period, using an analysis of variance (ANOVA). We then carried out regression analysis of community-level incidence and water quality for each specific community. Average type 1 diabetes incidence rates (number of new cases per year/100 000 people) were determined for each community using the average population of children aged 0–14 years during the study period.27 28 Recognizing the issues around analyzing incidence in small communities, we also constructed regional levels of incidence and water quality based on Canadian subcensus regions, of which there are 79 in the province. All 378 communities with sufficient water quality data were included for regional analyses using census consolidated subdivisions (CCS). The total population of children (aged 0–14 years) serviced by public water sources was calculated for each of the 89 CCS represented in the database. Water quality indicator levels for each community were then weighted according the percentage of that population represented. Incidence rates and weighted water quality data were aggregated according to CCS for regional analysis. The regional incidence rates for each CCS averaged 47.4/100 000 (±54.3 SD) and ranged from 0 to 267.6/100 000. Prior to aggregation, water quality indicators were weighted according to the proportion of regional population serviced. Type 1 diabetes incidence rates used in these analyses are among children living in communities serviced by public water supplies within each region, rather than the total incidence rate for the region. All of the analysis was carried out using IBM SPSS Software, V.22.
Results
Water quality data for 411 municipalities was available through the Department of the Environment, Government of NL. Thirty-three communities were excluded for having insufficient water quality data (<12 water quality measurements during the study period), resulting in a total of 378 communities available for preliminary and regional-level analyses. Of them, 138 communities were excluded for having insufficient population data, resulting in a total 240 communities included into community-level analyses (figure 2).

Included communities at different levels of analysis.
The NLPDD contained 499 cases of childhood diabetes during the study period between 2001 and 2012. Based on an average population of 80 403 children aged 0–14 years,27 28 an incident rate of 51.7/100 000 was determined for the province during the study period. Of those 499 cases with type 1 diabetes, 434 (87%) occurred in 114 communities serviced by public water supplies, while the remaining communities serviced by public water supplies reporting no cases of type 1 diabetes during the study period. Among the 240 communities with population data, a total of 409 cases were identified in 95 communities. The individual incidence rates in those communities reporting at least one case of type 1 diabetes during the study period averaged 154.1/100 000 (±175.2 SD) and ranged from 16.2 to 1282.1/100 000. The large variation is due to the fact that many of the communities included have small populations, and therefore incidence rates can be substantially impacted by the addition of a small number of cases.
One-way ANOVA was used to independently compare water quality indicators between communities that reported at least one case of type 1 diabetes during the study and those that reported none (table 1). This analysis identified a number of indicators that were significantly different between these two groups. The concentration of water nutrients and metals such as ammonia, barium, copper, lead, magnesium, uranium and zinc was significantly higher in communities that reported incident cases of type 1 diabetes. The water levels of physical parameters and major ions were also significantly higher in those communities. The compared parameters and ions included levels of the water alkalinity, color, electrical conductivity, hardness, total dissolved solids (TDS), turbidity, calcium, chloride, potassium and sodium.
Regression analysis was used to assess potential relationship between water quality indicator levels and incidence rate in the 240 communities with specific population data available. Analysis of nutrients and metals at community-level indicated that arsenic level (β=0.268, P=0.013) was positively associated with type 1 diabetes incidence rate. Analysis of major ions at the same level indicated that fluoride level (β=0.202, P=0.005) was also positively associated with type 1 diabetes incidence rate and overall model fit was R2=0.10 (table 2).
Linear regression analyses of water quality indicator levels and type 1 diabetes incidence rate at both community and regional levels
Regression analysis was also carried out at a regional level using data aggregated to the CCS level. Analysis of nutrients and metals indicated that barium (β=−0.478, P=0.009) and nickel (β=−0.354, P=0.050) levels were negatively associated with type 1 diabetes incidence rate. Overall model fit was R2=0.21. Analysis of major ions did not indicate any significant associations (table 2).
Conclusions
This case-control study is the first epidemiological study investigating relationship between water quality indicator levels and incidence rate of childhood-onset type 1 diabetes in NL. We confirmed the high incidence of type 1 diabetes within this population. When comparing communities that had cases with and without cases of diabetes, we found that concentration of water nutrients and metals such as ammonia, barium, copper, lead, magnesium, uranium and zinc was significantly higher in communities that reported incident cases of type 1 diabetes. The water levels of physical parameters and major ions were also significantly higher in those communities, including alkalinity, color, electrical conductivity, hardness, TDS, turbidity, calcium, chloride, potassium and sodium. We also found in the community-based analysis that there were significant associations found between higher concentrations of arsenic (β=0.268, P=0.013) and fluoride (β=0.202, P=0.005) in drinking water and higher incidence of type 1 diabetes. In the regional analysis, barium (β=−0.478, P=0.009) and nickel (β=−0.354, P=0.050) concentrations were negatively associated with type 1 diabetes incidence.
It is also important to note that no component was found to have a significant association across the three different levels of analysis performed. Part of the issue that we tried to address in adopting these different levels of analysis was how best to test the association between the incidence of type 1 diabetes and water quality over a rural and fairly sparely populated area. Because of the availability of data, we were able to take a broad approach to the components that could potentially be associated with the incidence of type 1 diabetes. These different levels of analysis serve then as a sensitivity analysis of sorts. If any component was significantly associated across all three ways of analyzing the data, it would have made for a stronger case for a wider association with that element in the water supply. In this regard, in neither level of analysis were nitrates associated with an increased level of incidence, which may lend support to those who previously found that they are not a risk factor for childhood type 1 diabetes.9–11
Our finding that at the community level that arsenic is associated with type 1 diabetes is interesting. A meta-analysis of data from 17 published articles with over 2 million participants found that arsenic in drinking water and in urine was associated with both type 1 and type 2 diabete, with a 13% increased risk for every 100 µg arsenic/L in drinking water.29 Arsenic exposure affects both the progression of diabetes and its complications and is linked to lower insulin secretion by β cells.30 31 Arsenic metabolism was associated with poorer average blood glucose control,32 albuminuria (protein in the urine),33 kidney disease,33 hypertension and cardiovascular events in people with diabetes.34 35 Evidence from several studies support the consideration of arsenic in the pathogenesis of type 1 diabetes.5 36 Organic arsenic compounds are much less toxic than the inorganic forms, which are the predominant forms in surface and groundwater reservoirs.37 38 After absorption of inorganic arsenic, it is methylated, primarily in the liver, to form monomethylated and dimethylated arsenic compounds, that is, monomethylarsonate (MMA) and dimethylarsinate (DMA), and eventually they are excreted into the urine together with inorganic arsenic.39 A recent SEARCH-CC study40 41 in the USA shows that high levels of MMA and DMA were associated with higher odds of type 1 diabetes mellitus, with one-carbon metabolism biomarkers like folate levels.42 Several locations in Alberta, British Columbia, Manitoba, New Brunswick, Nova Scotia, Newfoundland and Labrador, Quebec and Saskatchewan have localized elevations of arsenic or ‘hot spots’ with >10 µg/L in drinking water.42 Data obtained from the NL Department of Environment and Conservation revealed that 49 out of 52 sources of drinking water from domestic wells were exceeding the 10 µg/L arsenic limit.43
Fluegge44 used mathematical models in 2016 to analyze data on fluoride levels in water and rates of diabetes in 22 US states. The data revealed that a 1 mg increase in added fluoride was associated with a 0.17% increase in age-adjusted diabetes prevalence, even after adjusting for other diabetes risk factors like obesity and physical inactivity. He stated that his models looked at the outcomes of diabetes incidence and prevalence being predicted by both natural and added fluoride.
We found that presence of metals such as barium (P=0.009) and nickel (P=0.050) in the drinking water showed a negative association with the incidence rates of type 1 diabetes. Evidence from other studies appears to be variably consistent and conflicting with our findings. The study by Valera et al 45 has revealed significant positive correlations between barium and diabetes and negative correlations shown by nickel. Samuelsson et al 1 found that the incidence for type 1 diabetes increased in areas with low levels of barium oxide (<10th percentile) in water both at diagnosis and at the time of birth. Both type 1 diabetes and type 2 diabetes were found to be associated with nickel (P<0.001) deficiency in the study by Forte et al.16
Epidemiological research to date in NL has explored other potential contributing factors to explain the high incidence of type 1 diabetes mellitus. Genetic factors due to low interprovincial migration rates and founder effects46 47 are hypothesized; however, the rising incidence over a relatively short period suggests environmental factors may be influencing the increase in a genetically at-risk population.21 Perinatal factors exist such as low breastfeeding rates, high cesarean section rates and infants born large for gestational age.48 49 Vitamin D insufficiency and high rates of childhood obesity are documented in the population.50–53 NL has a northern latitude and erythemal ultraviolet B radiation may be geospatially associated with the incidence of type 1 diabetes mellitus.54 55
Although the sources from which data were taken are reliable, we are aware of the limitations that our study may present. The water quality data are only applicable to those who have access to public sources water. It is possible that within communities with public service for water that some residents actually do not have public access. We cannot determine whether the water testing was in all case was done on source water or tap water, which can impact the components identified in the water. We do not know to what extent people included in the data actually consumed or how much water they consumed; nor do we know how much was consumed either during pregnancy or early in life. We do not know the nature of filters used by individual houses and the habit of drinking bottled water, even having potable public water supply. We used an average of the testing results of water components in our analysis. While this method likely captures the effects of long-term exposures at a community level, it is not able to identify the effects the specific water quality had on each individual, which could be due to variations in the water supply for a community over the study period. A case-control study design reveals associations, but does not establish causality. The associations we report cannot be considered cause and effect, although having been identified as statistically significant warrants further investigation.
There is accumulating evidence that drinking water ingredients maybe implicated in the environmental exposures contributing to the pathogenesis and progression of type 1 diabetes. Newfoundland and Labrador has one of the highest reported incidences of type 1 diabetes worldwide and the reasons for these high rates are unknown. The rates of type 1 diabetes are increasing in the province. More experimental and clinical research is needed to elucidate the role of drinking water compounds in the pathophysiology of this serious disease.
Acknowledgments
The authors would like to thank the diabetes educators in Newfoundland and Labrador for reporting incidence cases of diabetes, in particular Mrs Sharon Penny who manages the Janeway diabetes database.
References
Footnotes
Contributors RC contributed to the design of the study, was involved in the interpretation of the data and contributed to the writing of the manuscript. RA analyzed and interpreted the data and contributed to the manuscript. AS contributed to the study design, literature review and manuscript plan including editing. PG and AC researched and collected data, developed and maintained the dataset. LAN contributed to the design of the study, was involved in the interpretation of the data and contributed to the writing of the manuscript. All authors approve of the version of the manuscript submitted. LAN is the guarantor of this work and takes responsibility for the integrity of the data and its interpretation.
Funding This research was supported by grants from the Janeway Hospital Research Foundation and the Leslie Harris Centre RBC drinking water and outreach research fund, Memorial University.
Competing interests None declared.
Ethics approval This study was approved by Newfoundland and Labrador ’s Health Research Ethics Authority (2013; HREB #2013.172).
Data sharing statement Data is stored at the Janeway Pediatric Research Unit as per HREB requirements.
Presented at A report outlining initial findings from ’The association of type 1 diabetes mellitus and drinking water contamination in Newfoundland and Labrador - literature review' project was presented and submitted to the Leslie Harris Centre of regional policy and development in Memorial University of Newfoundland in October 2015 44.