Article Text

Abstract
Objective We evaluated the effects of ursodeoxycholic acid (UDCA) on glucagon-like peptide-1 (GLP-1) secretion and glucose tolerance in patients with type 2 diabetes with chronic liver disease.
Research design and methods Japanese patients with type 2 diabetes (glycated hemoglobin (HbA1c) levels ≥7.0%) and chronic liver disease were included in this study. Sixteen patients (HbA1c level, 7.2%±0.6%(55.2 mmol/mol)) were randomized to receive 900 mg UDCA for 12 weeks followed by 50 mg sitagliptin add-on therapy for 12 weeks (UDCA-first group; n=8) or 50 mg sitagliptin for 12 weeks followed by 900 mg UDCA add-on therapy for 12 weeks (sitagliptin-first group; n=8). All patients underwent a liquid high-fat meal test before and after 12 or 24 weeks of treatment.
Results The baseline characteristics were similar between the UDCA-first and sitagliptin-first groups. There was a decrease in body weight (72.5±8.4 to 70.6±8.6 kg; P=0.04) and the HbA1c level (7.0%±0.3% to 6.4%±0.5%(53.0 to 46.4 mmol/mol); P=0.01) in the UDCA-first group. The HbA1c level decreased further after sitagliptin administration (6.4%±0.5% to 6.0%±0.4%(46.4 to 42.1 mmol/mol); P<0.01). Although there were no initial changes in the weight and HbA1c level in the sitagliptin-first group, the HbA1c level decreased after UDCA addition (7.1%±1.1% to 6.6%±0.9%(54.1 to 48.6 mmol/mol); P=0.04). UDCA alone increased the area under the curve0–30 for GLP-1 response (115.4±47.2 to 221.9±48.9 pmol·min/L; P<0.01), but not the glucose-dependent insulinotropic polypeptide response, in the UDCA-first group.
Conclusions UDCA treatment resulted in a greater reduction in HbA1c levels, and an increased early phase GLP-1 secretion.
Trial registration number NCT01337440.
- glp-1
- incretin hormones
- clinical studies
This is an Open Access article distributed in accordance with the Creative Commons Attribution Non Commercial (CC BY-NC 4.0) license, which permits others to distribute, remix, adapt, build upon this work non-commercially, and license their derivative works on different terms, provided the original work is properly cited and the use is non-commercial. See: http://creativecommons.org/licenses/by-nc/4.0/
Statistics from Altmetric.com
Significance of this study
What is already known about this subject?
Bile acids are a new pharmacological target of diabetic therapy. However, bile acid receptor agonists, such as Takeda G protein couple receptor 5 (TGR5) agonists and farnesoid X receptor agonists, have not yet been approved for patients with type 2 diabetes.
What are the new findings?
Our data showed that ursodeoxycholic acid (UDCA) treatment resulted in a greater reduction in glycated hemoglobin levels, and an increased early phase glucagon-like peptide-1 response to liquid high-fat meal test but not glucose-dependent insulinotropic polypeptide.
How might these results change the focus of research or clinical practice?
UDCA itself or in combination with a dipeptidyl peptidase-4 inhibitor may be a novel therapeutic option for type 2 diabetes.
Introduction
Dipeptidyl peptidase-4 (DPP-4) inhibitors are one of the first-line antidiabetic agents due to their safety profile and neutral effect on weight. However, their efficacy seems limited, especially among non-Asian individuals with type 2 diabetes.1 DPP-4 inhibitors increase the levels of glucagon-like peptide-1 (GLP-1) and glucose-dependent insulinotropic polypeptide (GIP). Increased levels of GIP may induce obesity by promoting lipogenesis in subcutaneous adipocytes.2–4 Therefore, combination therapies that potentiate DPP-4 inhibitors without increasing GIP levels are needed in future diabetes care. It is well known that bile acids also enhance the secretion of GLP-1 by activating TGR5, a G protein-coupled receptor for bile acids5 that is expressed in intestinal L-cells.6–9 In addition, bile acids are a new therapeutic target for diabetes and obesity-related disorders by increasing energy expenditure via TGR5 or farnesoid X receptor (FXR) in rodents10 11 and humans.12
However, chenodeoxycholic and cholic acids, which are the primary bile acids secreted from the liver, are so toxic that they cause non-alcoholic fatty liver disease (NAFLD), insulin resistance and hepatic fibrosis.13 Additionally, deoxycholic acid, a secondary bile acid converted by the gut flora, promotes the development of obesity-associated hepatocellular carcinoma.14
Ursodeoxycholic acid (UDCA) is a unique bile acid that is widely used in the treatment of various chronic liver diseases, such as primary biliary cirrhosis, primary sclerosing cholangitis and chronic hepatitis C in Japan. UDCA induces primary bile acid secretion from the liver into the intestine15 via inhibition of FXR in the intestine.16 The secreted primary bile acids are then converted by enterobacterial flora to secondary bile acids that have a potent agonistic TGR5 activity.14 Despite numerous clinical trials, UDCA fails to ameliorate fatty liver disease.16–18 Tauroursodeoxycholic acid (TUDCA), the taurine conjugate form of UDCA, acts as chemical chaperones, reduce endoplasmic reticulum stress and ameliorates insulin resistance in the liver, skeletal muscle and adipose tissue of genetically obese ob/ob mice.19 Indeed, in a clinical trial aimed at proving this hypothesis among obese people, high-dose TUDCA treatment increased insulin sensitivity in the liver, skeletal muscle and adipose tissue.20 However, unexpectedly, TUDCA did not reduce endoplasmic reticulum stress markers in the skeletal muscle and adipose tissue,20 suggesting that yet unknown mechanisms may underlie the beneficial effects of UDCA/TUDCA on energy homeostasis.
Based on these findings, we hypothesized that UDCA indirectly potentiates GLP-1 secretion and can potentially enhance the effect of DPP-4 inhibitors by increasing bile acid concentration in the small intestine of patients with type 2 diabetes.
Research design and methods
This 24-week, randomized, open-label and parallel-group study of Japanese patients was conducted at Kanazawa University. The study was designed in accordance with the Declaration of Helsinki. This trial is registered with ClinicalTrials.gov (number NCT01337440). Twenty patients with type 2 diabetes and chronic liver disease were recruited from the Department of Endocrinology and Metabolism, Kanazawa University Hospital from May 2010 to July 2013. The patients provided written informed consent before any study-related procedures were conducted.
Patient eligibility
The inclusion criteria were as follows: men and women with type 2 diabetes (age >20 years); glycated hemoglobin (HbA1c) ≥7.0% within 8 weeks prior to the study and either received no treatment or was treated with a single oral hypoglycemic agent (ie, sulfonylureas, biguanides or thiazolidinediones) before the 12-week run-in period. We allowed a <3% change in the HbA1c level within the 12 weeks before screening.
We diagnosed chronic liver disease as fatty liver change on abdominal ultrasonography, based on hepatorenal contrast or hepatic morphological change.21 Based on the American Association for the Study of Liver Diseases guideline,22 if there was a history of consumption of alcohol equivalent to >210 g/week (male) or >140 g/week (female), we diagnosed alcoholic liver disease.
The exclusion criteria were as follows: hypersensitivity or contraindication to UDCA or sitagliptin; a history of type 1 diabetes or ketoacidosis; recurrent episodes of unexplained hypoglycemia as defined by fasting plasma glucose <60 mg/dL with or without symptoms of hypoglycemia; concomitant infection or planning to have surgery; treatment with UDCA or sitagliptin within 12 weeks prior to screening; concomitant corticosteroid therapy; poorly controlled diabetes (with ketoacidosis or with an increase in HbA1c >3% in the 12 weeks before screening); undergoing dialysis, and serum creatinine >2.5 mg/dL in men or >2.0 mg/dL in women; alanine aminotransferase and/or aspartate aminotransferase levels >2.5 times the upper limit of normal; poorly controlled hypertension (systolic blood pressure >160 mm Hg or diastolic blood pressure >100 mm Hg); current and/or previous heart failure; severe retinopathy; malignancy on active therapeutic regimen or without complete remission or cure; pregnancy or breast feeding; hepatitis B or C positive and unable to participate in the study as assessed by the investigators.
Outcomes
The primary efficacy end point was the change in the difference of HbA1c after a monotherapy of UDCA or sitagliptin and a combination therapy of both drugs for 12 weeks. The secondary end point assessed at 12 weeks was the change from baseline of incretin response (ie, active GLP-1 or active GIP to liquid meal test). Glucose and HbA1c levels were measured by standard methods. The results of the physical examination, blood pressure and body weight measurements and laboratory evaluations, including hematology, serum chemistry and urinalysis, were recorded throughout the study.
Safety and tolerability were assessed by several safety parameters. Key safety parameters included general adverse events (AEs), treatment discontinuations, hypoglycemic events, hyperglycemic events and other parameters of interest, such as body weight and urinary ketones. AEs were monitored throughout the study and were rated by the investigators for intensity and their relationship to the study drugs AEs with an onset date up to 2 weeks after concluding treatment were evaluated in person.
A computer-generated dynamic randomization sequence assigned participants in a 1:1 ratio to the sitagliptin-first group (sitagliptin 50 mg for 12 weeks followed by UDCA add-on therapy for an additional 12 weeks) or UDCA-first group (UDCA for 12 weeks followed by sitagliptin add-on therapy for an additional 12 weeks). The dose of UDCA was 600 mg/day for 4 weeks. Afterwards, unless patients had side effects (eg, diarrhea and nausea), the UDCA dose was increased to 900 mg/day. Patients remained on stable doses of the medications during the study period. The following combinations of the UDCA-first and sitagliptin-first groups were also analyzed: UDCA alone for 12 weeks and add-on sitagliptin for 12 weeks (combined UDCA group), sitagliptin alone for 12 weeks and add-on UDCA for 12 weeks (combined sitagliptin group) and sitagliptin add-on UDCA for 12 weeks and UDCA add-on sitagliptin for 12 weeks (combined UDCA and sitagliptin group).
All the patients underwent 1 hour of nutritional counseling with an experienced dietician before the study. In addition, all patients were provided a standard calorie diet (30 kcal/kg/day; 50%–60% carbohydrate, 20%–30% fat and 15%–20% protein) and exercise counseling (5–6 metabolic equivalent estimations for 30 min daily) before the study.
Liquid high-fat meal test
The participants ingested a liquid high-fat meal (750 kcal, 500 mL; Pulmocare, Abbott Japan, Tokyo, Japan), containing 53 g carbohydrate, 47 g lipid (including 20% medium chain triglycerides) and 31 g protein, which has the highest carbohydrate and fat contents among the liquid test meals available at our hospital, after an overnight fast. Venous blood was obtained before, and 15, 30, 45, 60, 120 and 180 min after ingestion, and plasma glucose and triglycerides were measured. Active GLP-1 and active GIP levels were determined as described23 to determine the mechanism for the reduction in body weight and HbA1c levels. The areas under the concentration-time curve for each parameter were calculated using the trapezoidal rule. We measure the area under the curve (0–30 min; AUC0–30) to evaluate the early phase secretion of active GLP-1 and active GIP.
Statistical analysis
A completed case analysis was performed rather than an intention-to-treat analysis because a few patients dropped out of the study; reasons for dropping out from the study were unrelated to the patient’s baseline values or their responses. The data are expressed as means±SD. SPSS V.22.0 (SPSS, Chicago, Illinois, USA) was used for all the statistical analyses. The parameters were analyzed using the Student’s t-test, the Wilcoxon signed-rank test for the intergroup comparison, Mann-Whitney U test for the intragroup comparison and one-way analysis of variance for the comparison of three groups. P values <0.05 were considered to be statistically significant.
Results
Patients’ baseline characteristics
Twenty patients met the eligibility criteria and consented to participate in the study. The participants were randomized to the UDCA-first group or sitagliptin-first group (online supplementary figure 1). Two patients in the UDCA-first group and two patients in the sitagliptin-first group dropped out of the study. Eight patients in the UDCA-first group and eight in the sitagliptin-first group were analyzed (figure 1). Two patients in the UDCA-first group (one for poor compliance at week 4 and the other lost to follow-up at week 12) and two patients in the sitagliptin-first group dropped out of the study (one for poor compliance at week 8 and the other lost to follow-up at week 16).
Supplementary file 1
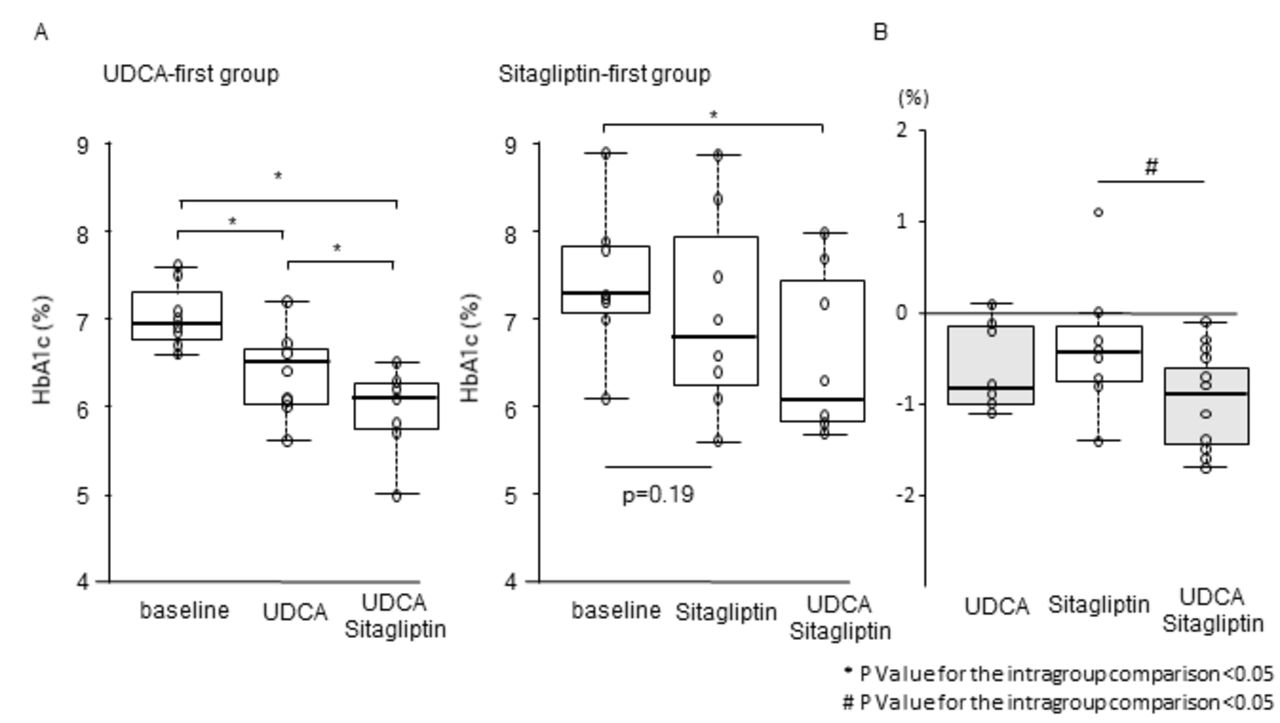
Differences in the glycated hemoglobin (HbA1c) levels. (A) Time course of HbA1c in the ursodeoxycholic acid (UDCA)-first group (n=8, left panel) and sitagliptin-first group (n=8, right panel). (B) HbA1c reduction with each treatment. All data are presented as the median with IQR (box) and total range (whiskers). Center lines show the medians, box limits indicate the 25th and 75th percentiles, whiskers extend 1.5×IQR from the 25th and 75th percentiles, and data points are plotted as dots. #P value for the intergroup comparison.
The baseline clinical characteristics are shown in table 1. The baseline demographic and disease characteristics were similar between the study groups. The causes of chronic liver disease were similar between the two groups (alcoholic liver injury (n=6) and NAFLD (n=2) in each group). In addition, 55% of all patients in the present study (11/20 patients) underwent liver biopsy and were diagnosed histologically as having chronic liver disease (NAFLD (n=6) and alcoholic liver disease (n=14)). No patients with liver cirrhosis were enrolled. Therefore, the Child-Pugh score was 5 for all subjects. There was no difference in alcohol consumption between the two groups (table 1). Three patients in the UDCA-first group (metformin (n=2), pioglitazone (n=1)) and five patients in the sitagliptin-first group (metformin (n=2), sulfonylurea (n=1), pioglitazone (n=1) and α-glucosidase inhibitors (n=1)) had history of treatment with oral hypoglycemic agents. None of the patients had a history of treatment with DPP-4 inhibitors and UDCA. All of the antidiabetic agents were washed out for at least 12 weeks before the start of the study. In addition, no AEs were reported in this study, and there were no severe AEs in both groups. All the patients in the present study were treated with 900 mg/day of UDCA.
Patient characteristics at baseline, 12 and 24 weeks
HbA1c (primary end point) and body weight
In the UDCA-first group, a significant decrease in the body weight (72.5±8.4 to 70.6±8.6 kg; P=0.04) and HbA1c level (7.0%±0.3% to 6.4±0.5% (53.0 to 46.4 mmol/mol); P=0.01) was observed. After the addition of sitagliptin, the HbA1c level further decreased from 6.4%±0.5% to 6.0%±0.4% (46.4 to 42.1 mmol/mol; P<0.01).
In the sitagliptin-first group, there were no initial changes in weight (76.0±6.1 to 75.9±6.0 kg; P=0.86) and HbA1c level (7.4%±0.8% to 7.1%±1.1% (57.4 to 54.1 mmol/mol); P=0.19). After the addition of UDCA for 12 weeks, HbA1c significantly decreased from 7.1%±1.1% to 6.6%±0.9% (54.1 to 48.6 mmol/mol; P=0.04), as shown in figure 1 and table 1.
We performed an intention-to-treat analysis including two dropped-out patients in each group. In the analysis in which baseline values were carried forward in the case of missing values, the trends and statistical significance were consistent with the complete set analysis (online supplementary figure 2). In the UDCA-first group, significant reductions in body weight (75.2±7.9 to 73.4±8.1 kg; P=0.04) and HbA1c level (7.1%±0.3% to 6.5±0.5% (54.0 to 48.0 mmol/mol); P=0.01) were observed. After the addition of sitagliptin, the HbA1c level further decreased from 6.5%±0.5% to 6.0%±0.7% (48.0 to 42.0 mmol/mol; P<0.01).
Supplementary file 4
In the sitagliptin-first group, there were no initial changes in weight (70.6±6.3 to 69.9±6.2 kg; P=0.85) and HbA1c level (7.3%±0.8% to 7.0%±1.0% (56.0 to 53.0 mmol/mol); P=0.18). After the addition of UDCA for 12 weeks, HbA1c level significantly decreased from 7.0%±1.0% to 6.6%±0.8% (53.0 to 49.0 mmol/mol; P=0.04).
HbA1c levels were significantly decreased in both the combined UDCA and combined sitagliptin groups. HbA1c levels were further decreased in the combined UDCA and sitagliptin group compared with the combined UDCA and combined sitagliptin groups (figure 1).
Liquid high-fat meal test
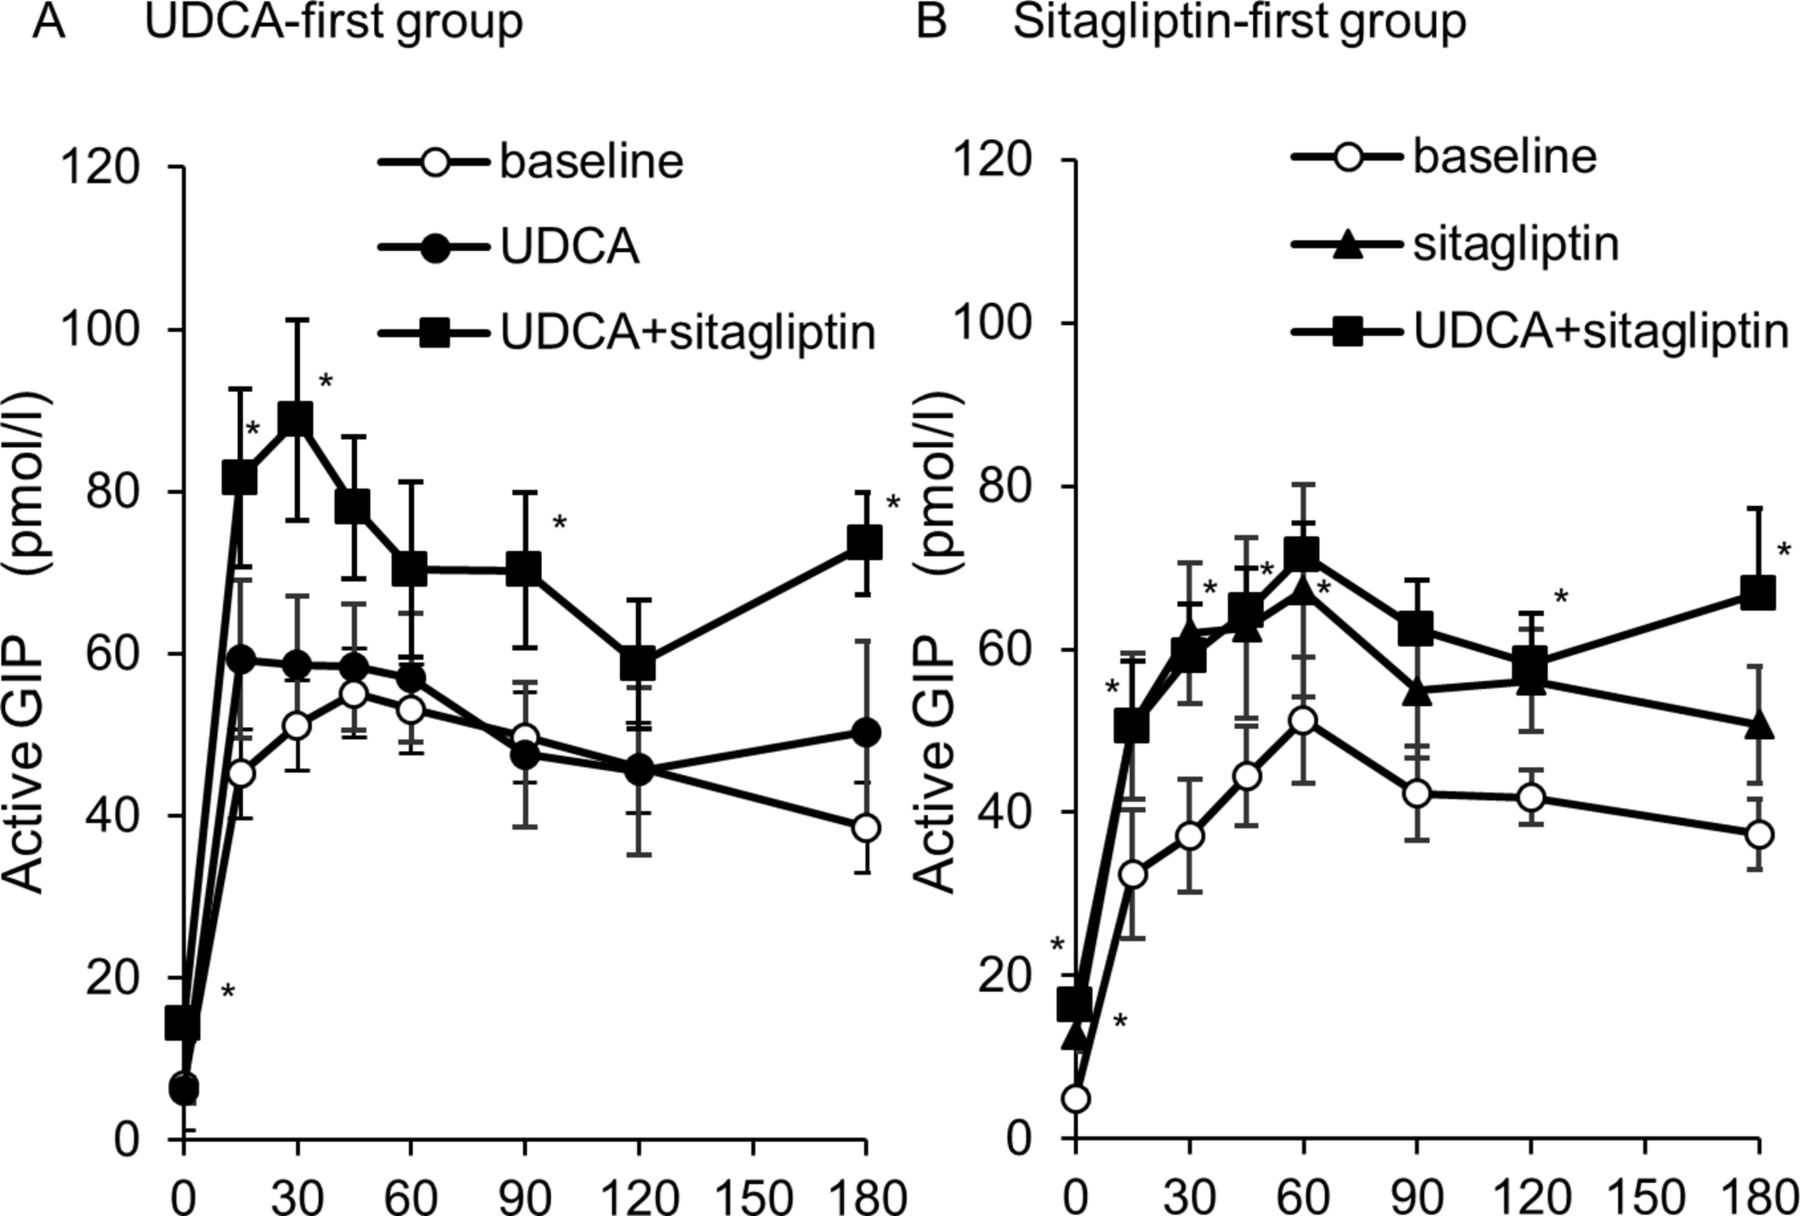
In the UDCA-first group, the UDCA alone and combination treatments did not change the post-liquid meal levels of glucose and C-peptides levels (online supplementary figure 3). However, in the UDCA-first group, UDCA alone significantly increased the AUC0–30 for active GLP-1 in response to the liquid high-fat meal test (115.4±47.2 to 221.9±48.9 pmol·min/L; P<0.01; figure 2), but not the GIP response (figure 3). As expected, the addition of sitagliptin further increased the AUC0–30 for both active GLP-1 and active GIP. In the sitagliptin-first group, sitagliptin alone significantly increased the AUC for active GLP-1 levels. The addition of UDCA did not affect the AUC0–30 for GLP-1 on the liquid high-fat meal test. However, such effects of UDCA on GLP-1 and GIP were not present in the sitagliptin-first group.
Supplementary file 2

Plasma active glucagon-like peptide-1 (GLP-1) response in patients with type 2 diabetes during the liquid high-fat meal test at baseline, 12 weeks and 24 weeks. (A) Plasma levels of active GLP-1 in the ursodeoxycholic acid (UDCA)-first group (n=8, left panel) and (B) sitagliptin-first group (n=8, right panel). Each plot represents the mean±SE of the mean. White circles, baseline; black circles, UDCA alone; black triangle, sitagliptin alone; white square, combination of UDCA and sitagliptin. *P value for the intragroup comparison (baseline vs 12 weeks). (C) Area under the curve (AUC) of active GLP-1 concentrations (n=8/group). All data are presented as median with IQR (box) and total range (whiskers). Center lines show the medians, box limits indicate the 25th and 75th percentiles, whiskers extend 1.5×IQR from the 25th and 75th percentiles, and data points are plotted as dots.

![[bmjdrc-2017-000469-SP1.jpg]](https://drc.bmj.com/content/bmjdrc/6/1/e000469/DC1/embed/inline-supplementary-material-1.jpg?download=true)
![[bmjdrc-2017-000469-SP4.jpg]](https://drc.bmj.com/content/bmjdrc/6/1/e000469/DC2/embed/inline-supplementary-material-2.jpg?download=true)
![[bmjdrc-2017-000469-SP2.jpg]](https://drc.bmj.com/content/bmjdrc/6/1/e000469/DC3/embed/inline-supplementary-material-3.jpg?download=true)
Plasma active glucose-dependent insulinotropic polypeptide (GIP) response in patients with type 2 diabetes during the liquid high-fat meal test at baseline, 12 weeks and 24 weeks. (A) Plasma levels of active GIP in the ursodeoxycholic acid (UDCA)-first group (n=8). (B) Sitagliptin-first group (n=8, right panel). Each plot value represents mean±SE of the mean. White circles, baseline; black circles, UDCA alone; white triangle, sitagliptin alone; white square, combination of UDCA and sitagliptin. *P value for the intragroup comparison (baseline vs 12 weeks).
Discussion
To the best of our knowledge, this is the first study in which UDCA treatment was found to decrease HbA1c levels and to increase early GLP-1 secretion in response to the high-fat meal challenge in patients with type 2 diabetes and chronic liver disease. Our findings of decreased HbA1c with UDCA 900 mg/day are consistent with those of a previous report in which a high-dose UDCA treatment decreased HbA1c levels in patients with NAFLD.18 Our findings of increased early active GLP-1, but not GIP, secretion in response to liquid high-fat meal test challenges with UDCA are consistent with those of a previous study in healthy participants without diabetes.24 Bile acid secretion enhanced by UDCA from the liver to the small intestine may lead to TGR5 activation on L-cells, and this indirect effect of UDCA may enhance the early phase of GLP-1 response in liquid high-fat meal test and thereby reduce HbA1c levels and weight.
Bile acids enhance GLP-1 secretion by TGR5 activation.6 25 26 Choleretic drug anionic exchange resins potentiate GLP-1 release from L-cells in a TGR5-dependent manner.25 26 However, UDCA has no affinity for dedicated bile acid receptors, such as the FXR or TGR5.27 Instead, UDCA acts as an FXR antagonist,28 which might result in enhanced bile acid synthesis. Therefore, we predict that UDCA may stimulate bile acid release via its choleretic effect and indirectly enhance GLP-1 secretion from L-cells via TGR5. Another issue of interest is how UDCA rapidly enhances GLP-1 secretion after the liquid high-fat meal test. For example, it is possible that UDCA enhances the neural network that links meal ingestion and GLP-1 secretion. As a result, de novo secretion of fresh bile acids might activate TGR5 expressed in the lower small intestine.
The bile acid-mediated activation of TGR5 activates the brown adipose tissue through tissue tri-iodothyronine (T3) activation, which may lead to body weight reduction. Intriguingly, UDCA-first, but not UDCA administration following sitagliptin administration, reduced body weight. This might be interpreted as follows. In response to the liquid high-fat meal challenge, sitagliptin considerably increased the levels of both GLP-1 and GIP (figures 2 and 3). As previously reported, sitagliptin may have a neutral effect on weight because increased secretion of GLP-1 may be offset by increased GIP secretion that promotes adipogenesis and obesity.2–4 29 On the other hand, UDCA slightly but significantly increased GLP-1 secretion without affecting GIP in response to the liquid high-fat meal challenge (figures 2 and 3). We speculate that the UDCA-mediated increase in GLP-1 secretion may contribute at least partly to weight reduction in the present study. Although sitagliptin increased the secretions of both GIP and GLP-1, the addition of UDCA did not show weight reduction in the sitagliptin-first group. It is uncertain whether relatively small increments in the UDCA-mediated GLP-1 response to the liquid high-fat meal challenge result in UDCA-mediated weight loss. We speculate possible mechanisms underlying the discrepancy between the meal challenge test and weight reduction in the UDCA-first group as follows: 1) it has been reported that circulating levels of incretin hormones are extremely low, and as little as 10% of intact bioactive GLP-1 secreted by L-cells actually reaches the pancreas.30 Furthermore, administration of a low dose of a DPP-4 inhibitor to inhibit local DPP-4 activity within the intestine is sufficient to improve glucose tolerance.31 Therefore, local GLP-1 enhancement in the lower intestine with UDCA led to HbA1c reduction. 2) It was reported that glucose challenge, rather than meal challenge, enhances GLP-1 response, whereas meal challenge, rather than glucose challenge, enhances GIP response.32 Because we used the extreme liquid high-fat meal containing as high as 60% fat in the challenge test, it might be possible that glucose or meal challenges further exaggerate the UDCA-mediated increase in GLP-1. 3) In addition, UDCA was not administered in the liquid high-fat meal test. We cannot rule out the possibility that UDCA administration just before the meal test considerably enhances the GLP-1 response. Regarding the sitagliptin-first group, the UDCA-mediated increment and action of GLP-1 in response to the liquid high-fat meal challenge might be diminished on the background of the sitagliptin-mediated large increase in GLP-1 levels.
The effect of FXR on systemic glucose homeostasis is still debatable. Recent studies suggest that metabolic effects caused by FXR inhibition may be divergent in the liver and in the intestine.16 In the liver, FXR and FGF15/19 have an insulin-like effect and decrease plasma glucose levels in rodents.33–37 UDCA acts as an FXR antagonist,28 which might result in enhanced bile acid synthesis, although UDCA has no affinity for dedicated bile acid receptors, such as FXR or TGR5. 17 27 In the intestinal L-cells, FXR inhibition increases GLP-1 secretion.38 UDCA may indirectly enhance GLP-1 secretion from L-cells by activating the TGR5 and FXR/FGF19 pathway by enhancing bile acid release through its choleretic effect. In addition, tauro-beta-muricholic acid, the counterpart of UDCA in mice, inhibits FXR only in the intestine but not in the liver, and thereby reduces intrahepatic fat accumulation by reducing ceramide synthesis and inhibiting ceramide-mediated activation of sterol regulatory element-binding protein 1 c in the liver.16 Based on these findings, UDCA may inhibit FXR mainly in the intestine rather than in the liver, and thereby enhance GLP-1 secretion.
There are several limitations in our study. The present study was conducted with a small sample size. Furthermore, we conducted a short-term assessment of the treatment of a chronic condition. We also did not include a placebo arm in this study. Lastly, bile acid composition was not analyzed in either plasma or feces to confirm our hypothesis that UDCA affects bile acid composition.
In conclusion, UDCA increased the early phase secretion of active GLP-1, but not GIP, in patients with type 2 diabetes and chronic liver diseases. In addition, combination of UDCA and DPP-4 inhibitor resulted in a greater reduction of HbA1c level than with DPP-4 inhibitor alone. These findings can contribute to the development of a compounding agent of UDCA and DPP-4 inhibitor as a novel therapeutic option for type 2 diabetes. Based on the present findings, a large-scale parallel controlled clinical study is currently ongoing to directly compare the glucose-lowering and weight-lowering effects of sitagliptin alone or in combination with UDCA.
Supplementary file 3
Acknowledgments
The authors would like to thank H Takayama and N Nagata (Kanazawa University) for providing technical assistance. The authors would also like to thank Editage (www.editage.jp) for English language editing.
References
Footnotes
Contributors KRS collected data and wrote the manuscript. TO, K-iK, YT and HM collected the data and reviewed the manuscript. SK contributed to the discussion and reviewed the manuscript. TT contributed to the discussion, reviewed and edited the manuscript. TT is the guarantor of this work and as such, had full access to all the study data and takes responsibility for the integrity of the data and the accuracy of the data analysis.
Funding This work was supported by the Japan Society for the Promotion of Science KAKENHI (Grant Number 16K19533; KRS).
Competing interests None declared.
Patient consent Obtained.
Ethics approval Institutional Review Board of Kanazawa University Hospital.
Provenance and peer review Not commissioned; externally peer reviewed.
Data sharing statement No additional data are available.
Presented at Parts of this article were presented (number 1169-P) at the 77th Scientific Sessions of the American Diabetes Association, San Diego, CA, 92101 in June 2017.