Article Text

Abstract
Objective Among individuals at high risk for diabetes identified through a population survey, we performed an intervention study with basic lifestyle advice aiming to prevent diabetes.
Research design and methods Among 50 806 participants in the HUNT3 Survey (2006–2008), 5297 individuals with Finnish Diabetes Risc Score (FINDRISC ≥15 were invited to an oral glucose tolerance test (OGTT) and an education session with lifestyle advice, and 2634 (49.7%) attended. Among them, 2380 people without diabetes were included in the prevention study with repeated examinations and education sessions after 6, 12, and 24 months. We examined participation, diabetes incidence, glycemia, and adiposity during follow-up.
Results Of 2380 participants, 1212 (50.9%) participated in ≥3 of the four examinations. Diabetes was detected in 3.5%, 3.1%, and 4.0% of individuals at the 6-month, 12-month, and 24-month examinations, respectively, indicating a 10.3% 2-year diabetes incidence. Mean (95% CI) increases from baseline to 2-year follow-up were 0.30 (0.29 to 0.32) percentage points (3.3 (3.2 to 3.5) mmol/mol) for Hemoglobin A1c, 0.13 (0.10 to 0.16) mmol/L for fasting serum-glucose, 0.46 (0.36 to 0.56) mmol/L for 2-hour OGTT s-glucose, 0.30 (0.19 to 0.40) kg/m2 forbody mass index (BMI) (all p<0.001) and −0.5 (-0.9 to −0.2) cm for waist circumference (p=0.004), with broadly similar estimates by baseline age, sex, education, depressive symptoms, BMI, physical activity, and family history of diabetes. Only 206 (8.7%) participants had evidence of >5% weight loss during follow-up; their fasting and 2-hour s-glucose did not increase, and HbA1c increased less than in other participants.
Conclusion Basic lifestyle advice given to high-risk individuals during three group sessions with 6-month intervals was not effective in reducing 2-year diabetes risk.
- type 2 diabetes
- screening
- prevention
- lifestyle change(s)
This is an Open Access article distributed in accordance with the Creative Commons Attribution Non Commercial (CC BY-NC 4.0) license, which permits others to distribute, remix, adapt, build upon this work non-commercially, and license their derivative works on different terms, provided the original work is properly cited and the use is non-commercial. See: http://creativecommons.org/licenses/by-nc/4.0/
Statistics from Altmetric.com
Significance of this study
What is already known about this subject?
Intensive lifestyle intervention is effective in preventing type 2 diabetes. Also, lifestyle intervention with almost monthly follow-up sessions in primary healthcare settings may reduce weight and prevent diabetes.
What are the new findings?
Basic lifestyle advice given to individuals at high risk of type 2 diabetes during three group sessions with 6-month intervals was not effective in reducing 2-year diabetes risk.
How might these results change the focus of research or clinical practice?
As our low-grade intervention with basic lifestyle advice was ineffective in preventing diabetes, improved population strategies or more intensive individual-level intervention seems necessary to prevent type 2 diabetes.
Introduction
The worldwide prevalence of type 2 diabetes is increasing and prevention of the disease is an important public health priority.1 Intensive lifestyle intervention has proved effective in preventing type 2 diabetes among high-risk individuals in clinical trials, with short-term (~3 years) relative risk reductions of 50–60% and 30–40% long-term relative risk reductions (7–20 years),2–6 but may be difficult to implement on a population level. In primary healthcare settings, more feasible, but still quite intensive lifestyle intervention with almost monthly follow-up sessions has also been effective in reducing weight,7 8 particularly in people following official lifestyle recommendations on weight management; diet with less saturated fat, sugar and highly refined carbohydrates; and more physical activity.7 9 This weight reduction would presumably lead to lower risk of diabetes,7 9 although the effect of these less extensive interventions on glycemia and diabetes incidence is sparsely studied.8
Based on this evidence, diabetes prevention guidelines recommend that high-risk individuals are offered low-threshold, multifactorial and intensive interventions in local communities.10 11 However, these interventions are resource demanding, and the number of eligible users is high. For example, in Norway, approximately 10% of the adult population is estimated to be at high risk of diabetes, indicated by FINDRISC ≥15.12 Only 60% of the municipalities in Norway offer the recommended low-threshold multifactorial intervention (‘Healthy Life Centers’)13 and <10% of the high-risk population participate,12 13 and the situation is likely comparable in other countries.14 15
Low-grade, basic lifestyle advice could be a feasible alternative that would reach out to a higher proportion of the high-risk individuals, but the effects of low-grade lifestyle advice on glycemia and adiposity are insufficiently studied. The control groups in the type 2 diabetes prevention trials often lost 0.1–0.8 kg body weight following basic lifestyle advice,5 16 suggesting that even low-grade lifestyle intervention could reduce adiposity and hyperglycemia. However, people volunteering to intensive lifestyle trials may be particularly motivated for lifestyle change, making their results less relevant for the general population. Further, it is unclear whether subgroups of the population may respond differently to lifestyle advice. Preventive strategies against type 2 diabetes should benefit all, including higher risk groups such as people with low socioeconomic status and depression. Some studies, though not all,17 18 suggest that lifestyle intervention against type 2 diabetes or cardiovascular diseases may be less effective among people with depression19 20 or low socioeconomic status.21
We performed a 2-year intervention study with basic lifestyle advice aiming to prevent diabetes among individuals at high risk of type 2 diabetes identified through a population survey. We examined diabetes incidence and measures of glycemia and adiposity during follow-up, and examined how participation and changes in glycemia and adiposity differed by baseline characteristics.
Research design and methods
Study population
In 2006–2008, all inhabitants aged ≥20 years in Nord-Trøndelag County, Norway, were invited to the HUNT3 Survey (2006–2008), and 50 806 (54.1%) participated.22 The HUNT3 Study population was one of 25 European cohorts included in the Diabetes in Europe —Prevention using Lifestyle, physical Activity and Nutritional intervention (DE-PLAN) Study, whose main goal was to improve the capability to prevent type 2 diabetes in Europe.23 All HUNT3 participants had their diabetes risk predicted using the FINDRISC questionnaire.12 A FINDRISC score of ≥15 out of 26 was considered as high risk for type 2 diabetes.24 25 All 5297 participants with FINDRISC ≥15 and no previously known diabetes were informed about their elevated diabetes risk on site and were invited to a follow-up examination including questionnaires and clinical and laboratory measurements, including an oral glucose tolerance test (OGTT). They received written information by surface mail on how to prepare for the OGTT and made an appointment for the examination by phone. Among the 5297 invited HUNT participants, 2634 (49.7%) attended the examination. Among these, laboratory measurements were lacking from one person, and the OGTT revealed that 253 persons had previously unknown diabetes (fasting serum glucose ≥7.0 mmol/L or 2-hour serum glucose ≥11.1 mmol⁄L). The latter group was referred to their general practitioner (GP) for routine diabetes care, leaving 2380 participants for the 2-year intervention study. Both the HUNT3 Survey and the DE-PLAN intervention were approved by the Regional Committee for Medical and Health Research Ethics of Central Norway and the participants signed a written consent. The participants were invited to all OGTTs by phone. They were invited to the educational sessions by surface mail, and no reminders were given. The intervention study was not registered in a Clinical Trials Register, as this was not required for such community-based uncontrolled interventions beginning enrolment before 1 July 2008, according to the International Committee of Medical Journal Editors.
The DE-PLAN intervention in HUNT3
The intervention consisted of clinical examinations and subsequent group educational sessions at four time points: within 2 months after the HUNT3 Survey and approximately after additional 6, 12, and 24 months. (The educational session at 24 months took place at the end of follow-up and thus did not influence the outcomes in this study.) The educational sessions were held in each of the 23 municipalities, and on average ~30 invitees participated at each session. Each group session lasted 2.5 hours and had four main themes. First, information on diabetes, diabetes risk, and the importance of prevention. Second, nutrition and dietary recommendations, including advice on having 3–4 main meals and 1–2 healthy snack meals per day, increasing the intake of fiber and polyunsaturated fat, eating five portions of fruit, berries and vegetables every day, plentiful intake of legume and wholegrain products, and the use of light dairy products. In addition, they were shown visually how much sugar, calories, fat, and types of fat there are in different sweets and fast food and shown healthy full meal and snack alternatives. Third, physical activity advice based on recommendations from the Norwegian Directorate of Health and in line with European recommendations,26 including advice to perform moderate physical activity such as rapid walking or biking at least 30 min/day. Fourth, information on ongoing local low-threshold opportunities for physical activity. A physician (KM) held the first educational session. A nurse with a clinical postgraduate education in Diabetic Nursing (1-year full-time study) held the educational sessions during follow-up. Themes 2 and 3 were elaborated, with a course in Nordic walking and a particular focus on diet in session 2, and on coping in session 3.
In a few municipalities, sessions 2 and 3 were merged into one session, because session 2 was not completed until the time approached for session 3. Brochures from the Norwegian Directorate of Health about nutrition and physical activity were handed out for free, and a healthy evening meal was provided to the participants, the focus being on easily prepared, healthy, and inexpensive food.
Questionnaires
The participants completed self-administered questionnaires at the HUNT3 Survey and at each DE-PLAN examination. The FINDRISC items12 were included in the main HUNT3 questionnaire that was sent by surface mail together with the invitation to participate in HUNT3 and returned at the HUNT3 examination.22 A second questionnaire, handed out at the HUNT3 examination and returned by mail in a prepaid envelope, included, among other items, the Hospital Anxiety and Depression Scale (HADS).27 HADS consists of 14 questions, seven of them related to depression (Hospital Anxiety and Depression Scale-Depression (HADS-D); each question scored from zero to three, given a maximum score of 21 for HADS-D. We classified a score ≥8 on the seven HADS-D questions as an indication of depression.28 Of the 2380 participants in the DE-PLAN intervention, 2114 (85.7%) answered all seven questions in HADS-D and 74 (3.1%) answered five or six items. For them, we weighted the non-missing answers by multiplying them by 7/5 or 7/6, respectively. At the DE-PLAN examinations, all participants also reported their number of completed years of education.
Clinical measurements
At all four DE-PLAN examinations, HbA1c and fasting and 2-hour OGTT capillary and serum glucose concentrations were measured after overnight fasting. Participants with fasting capillary glucose >8.5 mmol/L were not offered an OGTT, but had a fasting blood sample drawn for HbA1c and serum glucose measurement. OGTT was performed by giving fasting participants 75 g of glucose dissolved in 300 mL of water, to be consumed within 5 min. If plasma-referenced capillary blood glucose was ≥7.0 mmol/L fasting or ≥8.9 mmol/L 2 hours after the glucose load, the participant was given a referral to her/his GP and was recommended follow-up. If the venous samples, which were analyzed the following day, indicated diabetes or impaired glucose tolerance (IGT), the participant’s GP also received information by surface mail. According to the 1999 WHO criteria,29 diabetes was defined as fasting serum glucose ≥7.0 mmol/L or 2-hour serum glucose ≥11.1 mmol⁄L; IGT as fasting serum glucose <7.0 mmol/L and a 2-hour serum glucose of 7.8–11.0 mmol/L. If fasting or 2-hour serum-glucose indicated diabetes, the participant was not invited to further examinations; the further clinical follow-up of diabetes was entrusted to the participants’ GP. One of the study nurses participated at almost all the OGTTs, to ensure equal procedures according to the written study protocol throughout the study.
Laboratory measurements
Venous samples for serum analyses were centrifuged after a minimum of 25, but preferably no longer than 30 min after blood sampling. Fasting and 2-hour serum samples for glucose determination and fasting EDTA blood samples for HbA1c were analyzed at the Department of Clinical Chemistry at Levanger Hospital (Nord-Trøndelag Hospital Trust). Serum glucose was analyzed by hexokinase/Glucose-6-phosphate dehydrogenase methodology (Abbott, Clinical Chemistry, Illinois, USA). HbA1c was measured immunoturbidimetrically by using a microparticle agglutination inhibition method (Multigent, Abbott Laboratories, Illinois, USA). To enable necessary immediate GP referral, plasma-referenced capillary glucose was also measured at the clinical examination site immediately after sampling by glucose dehydrogenase methodology using HemoCue photometer (HemoCue AB, Ängelholm, Sweden).
Statistical analysis
We estimated age-adjusted and sex-adjusted changes (with 95% CI) in HbA1c, fasting and 2- hour OGTT serum glucose, BMI, and waist circumference, from baseline to the 6-month, 12-month, and 24-month follow-up examinations. The associations were analyzed using linear mixed models with random slopes. This approach uses all available information and is less susceptible to bias under the assumption of missing at random.30 From the regression model, we predicted mean values (with 95% CI) of the glycemia and adiposity measures, fixing age and sex at their mean values. The results are reported overall and by baseline age (<50, 50–69, or ≥70 years), sex, education level (≤10, 11–13, or ≥14 years), and HADS depression score (<8 or ≥8). In additional analyses, we similarly estimated changes in glycemia and adiposity by baseline BMI, physical activity, and family history of diabetes. Further, we estimated changes in glycemia during follow-up according to weight reduction (>5% weight reduction from baseline to at least one of the follow-up examinations) and leisure time physical activity (≥3-hour weekly activity in at least one of the follow-up examinations) during follow-up. These characteristics have earlier been associated with successful diabetes prevention in a randomized trial of intensive lifestyle intervention.5
We used logistic regression analysis to examine how participation differed by baseline age, sex, education, and depressive symptoms and estimated the age-adjusted and sex-adjusted predicted probability of participation in each subgroup. We estimated both the probability of attending the baseline DE-PLAN examination among all 5297 invitees and the probability of continued participation (defined as participating in at least three out of four DE-PLAN examinations) among the 2380 participants of the intervention study. Data were analyzed using Stata version 13.1 for Windows (StataCorp, College Station, Texas, USA).
Results
Figure 1 shows a flow chart of the study population. Table 1 shows baseline characteristics of all 5297 HUNT3 participants invited to the baseline OGTT and of the 2380 participants of the DE-PLAN intervention. Among the 2380 participants, 1217 (51.1%) participated at 6-month follow-up, and 1165 (48.9%) participated at each of the examinations at 12 and 24 months. Mean (SD) interval from the HUNT3 Survey to the baseline DE-PLAN examination was 1.5 (1.6) months. Mean (SD) intervals from the baseline DE-PLAN examination to the follow-up examinations were 7.0 (1.7), 13.9 (2.3), and 23.5 (1.9) months for the 6-month, 12-month, and 24-month examinations, respectively.

Flow chart of the HUNT3 Survey and the Diabetes in Europe —Prevention using Lifestyle, physical Activity and Nutritional intervention (DE-PLAN) intervention study.
Baseline characteristics of the 5297 HUNT3 participants invited to the Diabetes in Europe —Prevention using Lifestyle, physical Activity and Nutritional intervention (DE-PLAN) baseline examination and of the 2380 participants of the DE-PLAN intervention study, given as mean (SD) unless otherwise stated
Overall, 2634 (49.7%) of invitees took part in the baseline examination, with similar attendance for women and men, but moderately higher partaking among those <50 years (58.5%) compared with 50–69 (52.1%) or ≥70 years of age (43.1%) (online supplementary table 1). Attendance was slightly lower among those with depressive symptoms (47.4% vs 52.3%). Among the 2380 DE-PLAN participants, 50.9% participated in at least three out of the four DE-PLAN examinations. Such continued participation did not markedly differ between the groups, but was highest in the age group 50–69 years (54.1%), slightly higher among men than women (54.3% vs 48.8%), highest among those having 11–13 years of education (58.4%), and slightly lower among participants with depressive symptoms (46.6% vs 53.5%) (online supplementary table 2).
Supplemental material
New diabetes was identified in 43 (3.5%), 36 (3.1%), and 47 (4.0%) individuals at the 6-month, 12-month, and 24-month examinations. Under the assumption that diabetes incidence was similar in participants and non-participants during follow-up, these 126 observed incident cases of diabetes correspond to a 2-year diabetes incidence of 10.3% (245 cases) among the 2380 participants. The diagnosis was based on a single diagnostic test, but 58 (46.0%) of the 126 observed incident cases of diabetes had at least two test values suggestive of diabetes at the time of diagnosis (fasting serum glucose ≥7.0 mmol/L, 2-hour serum glucose ≥11.1 mmol⁄L, or HbA1c ≥6.5% (48 mmol/mol)).
Overall, mean HbA1c increased by 0.30 (95% CI 0.29 to 0.32) percentage points (pp) (3.3 (3.2 to 3.5) mmol/mol), from 5.67% (38 mmol/mol) to 5.98% (42 mmol/mol), during the 2-year follow-up (p<0.001). The only sign of a favorable course was a very modest (0.06 pp) and temporary decline in HbA1c from 6-month to 12-month follow-up. The 2-year increase in HbA1c was ~0.3 pp in all subgroups by sex, age, education level, or HADS-D score at baseline (figure 2).

Mean (95% CI) HbA1c at baseline and 6-month, 12-month, and 24-month follow-up, overall and by sex (A), and by baseline age (B), education (C), and Hospital Anxiety and Depression Score-Depression (D).
Fasting serum glucose was stable from baseline to 6-month follow-up, but subsequently increased and was 0.13 mmol/L (95% CI 0.10 to 0.16) higher at 2-year follow-up than at baseline (p<0.001). The 2-year increase in fasting serum glucose was slightly stronger among men than women (0.17 (95% CI 0.12 to 0.21) mmol/L vs 0.11 (95% CI 0.07 to 0.14) mmol/L), but did not substantially differ by age, education level, or HADS-D (figure 3).
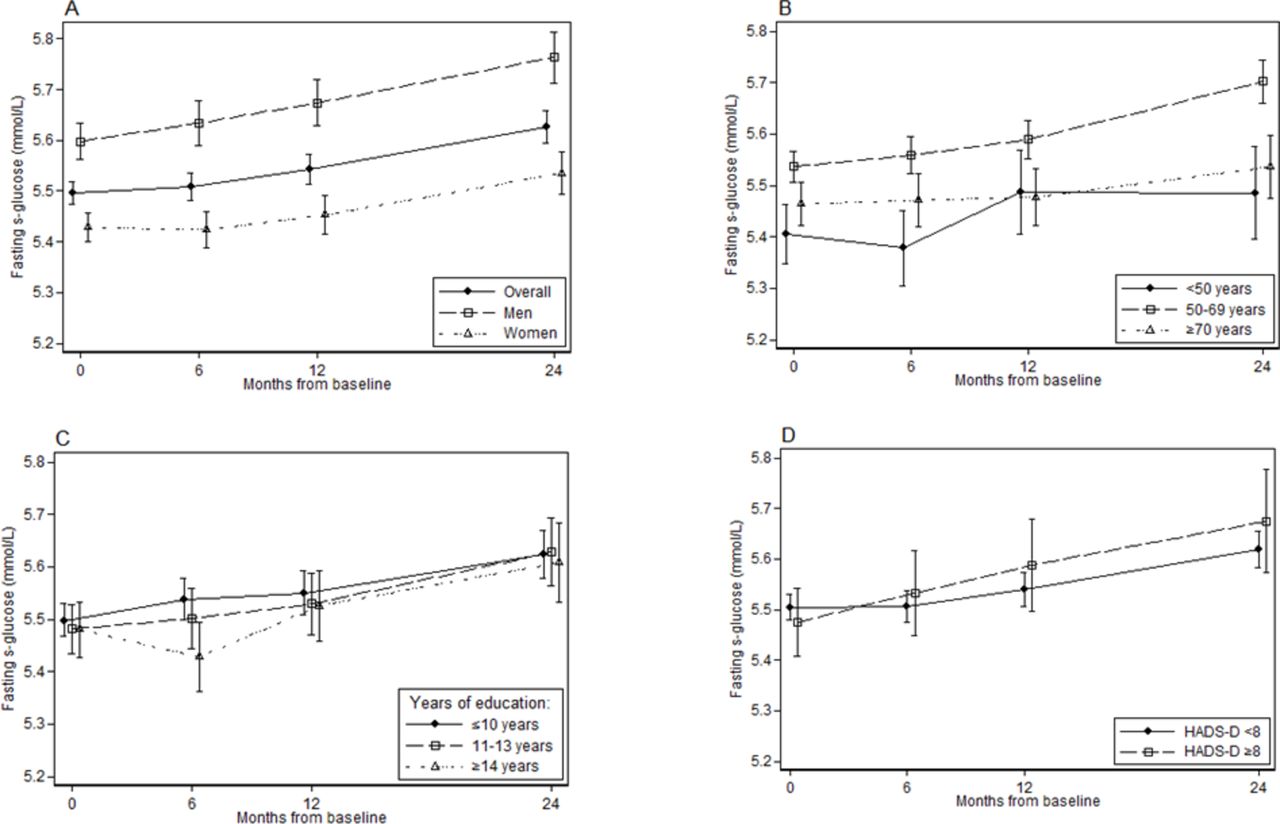
Mean (95% CI) fasting s-glucose at baseline and 6-month, 12-month, and 24-month follow-up, overall and by sex (A), and by baseline age (B), education (C), and Hospital Anixety and Depression Score-Depression (D).
Two-hour OGTT serum glucose was also stable from baseline to 6-month follow-up, but increased thereafter and was 0.46 mmol/L (95% CI 0.36 to 0.56) higher at 2 years than at baseline (p<0.001). There was a 0.3–0.6 mmol/L 2-year increase in 2-hour OGTT serum glucose across all subgroups, except for a less convincing 0.21 (95% CI −0.03 to 0.44) mmol/L increase among people with ≥14 years of education (online supplementary figure 1).
Supplemental material
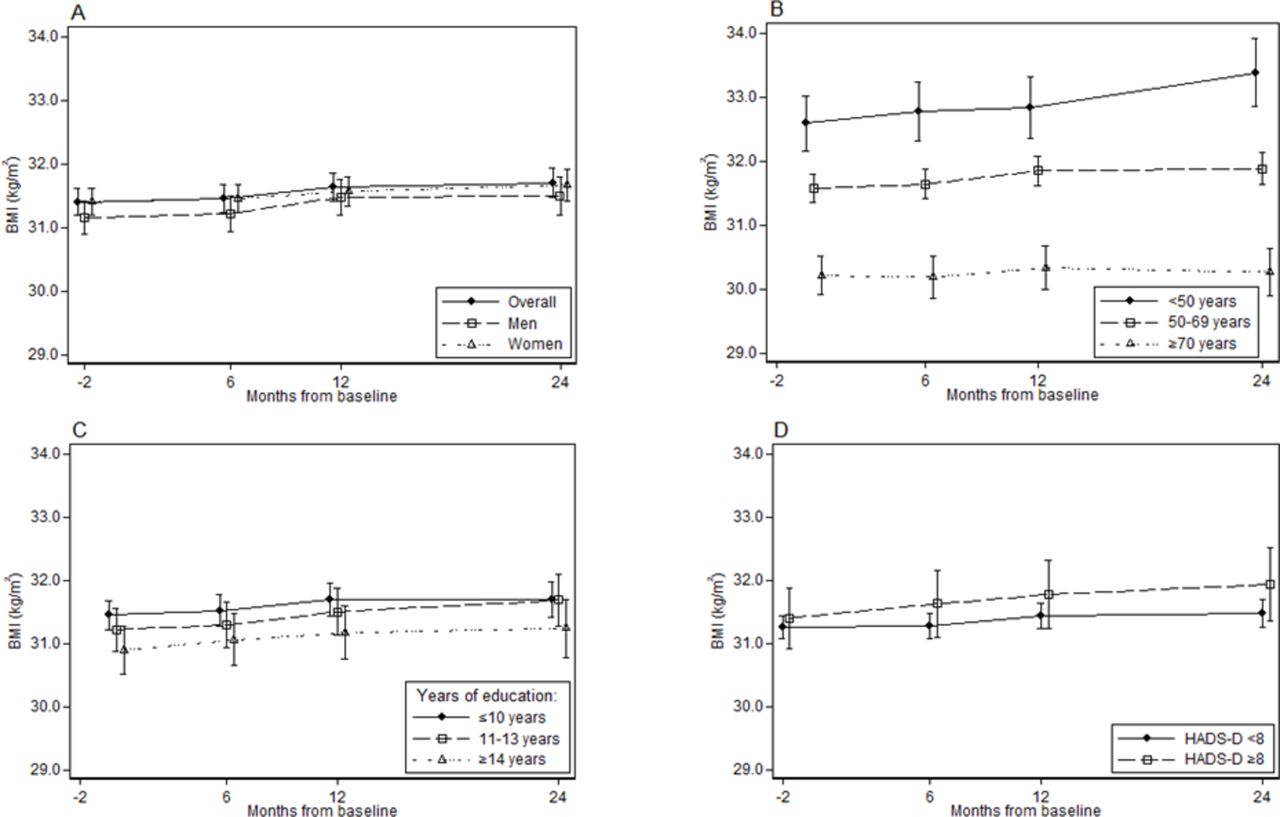
BMI increased by 0.30 kg/m2 (95% CI 0.19 to 0.40) during the 2-year follow-up (p<0.001). The 2-year BMI increase was stronger at age <50 years (0.79 kg/m2, 95% CI 0.51 to 1.08) and absent at age ≥70 years (0.05 kg/m2, 95% CI −0.14 to 0.25), but was otherwise 0.2–0.5 kg/m2 in all subgroups (figure 4).

Mean (95% CI) BMI at baseline and 6-month, 12-month, and 24-month follow-up, overall and by sex (A), and by baseline age (B), education (C), and Hospital Anxiety and Depression Score-Depression (D).
Waist circumference was 2.4 cm lower at 6-month follow-up compared with baseline, but subsequently increased and was 0.5 cm (95% CI 0.2 to 0.9) lower at 2-year follow-up than at baseline (p=0.004). Changes in waist circumference were similar across subgroups (online supplementary figure 2).
Mean changes (with 95% CI) in measures of glycemia and adiposity from baseline to each of the follow-up examinations, overall and by subgroups of age, sex, education level, or HADS-D at baseline, are provided in online supplementary table 3. We additionally examined changes in measures of glycemia and adiposity by baseline levels of BMI, physical activity, and family history of diabetes and observed that glycemia and BMI increased from baseline to 2-year follow-up in all subgroups (online supplementary table 4).
Among the 2380 participants, 1194 (50.2%) reported to have ≥3-hour weekly leisure time physical activity at at least one follow-up examination, 206 (8.7%) had >5% weight reduction from baseline to at least one of the follow-up examinations, and 145 (6.1%) fulfilled both these criteria. Participants with >5% weight reduction did not increase their fasting and 2-hour OGTT serum glucose values from baseline to 2-year follow-up, and participants with both >5% weight reduction and ≥3-hour weekly physical activity had lower 2-year increase in HbA1c (0.20 pp, 95% CI 0.13 to 0.26), compared with participants who fulfilled neither criteria (0.32 pp, 95% CI 0.29 to 0.36) (online supplementary table 5).
The 2380 participants provided a total of 5927 examinations, of which 643 (10.8%) were performed >3 months earlier or later than the planned time points (which was within 2 months after the HUNT3 Survey and approximately after additional 6, 12, and 24 months). In a sensitivity analysis, we re-examined the 2-year changes in glycemia and adiposity after exclusion of these 643 measurements, but the results remained similar to those observed in the main analysis (data not shown).
Conclusions
In this 2-year population-based uncontrolled intervention study, high-risk individuals were informed about their elevated risk of type 2 diabetes and received basic lifestyle advice aimed at preventing diabetes at baseline and after 6 and 12 months. Glycemia and BMI increased during the 2-year follow-up, and the estimated 2-year diabetes incidence was 10.3%. Glycemia and BMI increased in all subgroups by baseline age, sex, education, depressive symptoms, BMI, physical activity, or family history of diabetes.
The strengths of the study include the large sample size, which allowed precise estimates of change both overall and in subgroups. Our participants were selected using a widely recommended type 2 diabetes prediction tool (FINDRISC), which makes the study relevant for a primary care type 2 diabetes prevention setting.11 31 32 The population-based design is a particular asset; this design means that the results are likely more representative for a general population of individuals at high risk for type 2 diabetes, compared with evidence from trials more likely to enrol people who are highly motivated for lifestyle change.33 Even the control groups in these trials may have had favorable lifestyle changes and weight loss beyond what we may expect in the general population. The discrepancy between gradual increases in glycemia and BMI in our population-based sample, and the favorable weight changes observed after basic lifestyle advice in the control groups of intensive lifestyle trials,5 34 may be explained by a stronger motivation for lifestyle change among people enrolled in these trials. We believe that the present study informs more realistically on what can, or cannot, be achieved by providing basic lifestyle advice to prevent diabetes in the general population.
A limitation of our study is the lack of a control group, which means that we do not know whether the observed changes during follow-up were different from what we would have observed if no lifestyle advice had been given. Nonetheless, the estimated 10.3% 2-year diabetes incidence is not lower than what we would expect without any intervention based on previous studies of FINDRISC and risk of OGTT-defined diabetes.5 35 36 Further, our observed weight increase contrasts with the substantial weight loss observed in Randomized controlled trials (RCTs) of intensive lifestyle intervention5 16 and with the moderate weight loss observed after less intensive intervention in primary healthcare settings.7 8 Additionally, only 8.7% of our participants had evidence of >5% weight loss during the intervention, compared with ~40% in the intervention groups and 13% in the usual care groups in RCTs.5 16 Thus, our results seem to imply that our low-grade intervention was not sufficient to achieve a clinically relevant beneficial effect on diabetes prevention. Nonetheless, we cannot exclude that other forms of providing basic lifestyle advice could have been more effective, for example, with more frequent intervention or individual rather than group-level education sessions.
The participation rates in the HUNT3 Survey and the DE-PLAN intervention were ~50%, broadly in line with most recent national and international population-based studies.37 Participation in the HUNT3 Survey was lower in people with lower socioeconomic status and psychiatric disorders; individuals who might have a particularly high risk of diabetes and obesity.38 39 Thus, the diabetes incidence and increases in glycemia and obesity during follow-up might have been even larger if these high-risk groups had participated to a higher extent. Most participants did not attend all examinations, and a few participants were excluded during follow-up due to the development of diabetes. To reduce the impact that these missing observations may have had on the estimated changes in glycemia and adiposity, we analyzed the data using mixed models, as recommended for this purpose.30 For waist circumference, we observed an unforeseen pattern with an abrupt decline from baseline to 6-month follow-up, followed by a steady increase. We cannot exclude that subtle differences in measurement technique between the HUNT3 and the DE-PLAN study nurses may have contributed to the initial drop in waist circumference. As we did not observe a corresponding reduction in BMI, we are reluctant to interpret the decline in waist circumference as a true decline in adiposity, and in any circumstance, the decline appeared short-lasting, as the mean value at 2-year follow-up approached the value at baseline.
We observed no evidence of improvement in glycemia in any subgroup, and the differences in changes in glycemia and adiposity between subgroups were minor. One might expect that people with higher education and no depressive symptoms would have been more compliant to lifestyle advice, but we saw no evidence of a more beneficial course in these individuals, except that the 2-hour OGTT serum glucose increased less among those having a high education level. BMI increased more strongly at younger age; this could indicate that younger people are more likely to follow physical activity advice and gain more muscle mass, which would contribute to higher BMI. Alternatively, the stronger BMI increase in the younger participants could indicate a steeper obesogenic trajectory in younger individuals, but if so, we would have expected to see a similarly stronger increase in waist circumference at younger age.40 Analogously, a stronger increase in BMI in younger versus older individuals has also been shown in a study of long-term weight change in the entire HUNT Study population from 1984–1986 to 2006–2008.40
High participation is one prerequisite for a successful diabetes prevention program at the population level. We estimate that the 2634 attendants at the baseline DE-PLAN examination constitute about one-third of the total number of eligible people with elevated FINDRISC in the underlying population, that is, the adult population of Nord-Trøndelag county.12 Only half of these participants participated in at least three of the examinations. Thus, the majority of eligible high-risk participants chose not to participate and complete our intervention, even though relatively little effort was required from each participant. Although participation did not markedly differ between subgroups, participation was lower at old age and among people with depressive symptoms. The lower participation among people with depressive symptoms is in line with other studies.41
In summary, the substantial 2-year diabetes incidence, the consistent increases in glycemia and BMI, the relatively low participation, and the low proportion achieving substantial weight reduction indicate that our low-grade intervention with basic lifestyle advice did not have clinically meaningful effect on diabetes prevention overall or in subgroups by age, sex, education level, depressive symptoms, BMI, physical activity, or family history of diabetes. Our prevention strategy of informing high-risk individuals about their elevated diabetes risk and providing them with basic lifestyle advice is likely of similar intensity as the preventive measures often offered to high-risk individuals in a primary care setting. However, our strategy appeared ineffective and improved population strategies or more intensive individual-level intervention seems necessary to prevent type 2 diabetes.
Acknowledgments
The authors thank the participants who made this study possible. The authors also thank the diabetic nurse Siv Helene Nordholm, nurse Turid Austheim and the other nurses involved in this study for their excellent work. The Nord-Trøndelag Health Study (The HUNT Study) is a collaboration between the HUNT Research Centre (Faculty of Medicine and Health Sciences, NTNU, Norwegian University of Science and Technology), the Nord-Trøndelag County Council, the Central Norway Regional Health Authority and the Norwegian Institute of Public Health.
References
Footnotes
Contributors KM designed and organized the study, and JT led the overall Diabetesin Europe—Prevention using Lifestyle, physical Activity and Nutritional intervention project. AJ, BOÅ and JHB analyzed the data, and all authors interpreted the results. AJ and BOÅ wrote the manuscript. JH, KM, JT, JHB and SMC critically reviewed the manuscript. AJ is the guarantor of this work and, as such, had full access to all the data in the study and takes responsibility for the integrity of the data and the accuracy of the data analysis.
Funding The HUNT Diabetes in Europe—Prevention using Lifestyle, physical Activity and Nutritional intervention Study received financial support from the Norwegian Directorate of Health and the Commission of the European Communities, Directorate C—Public Health, Grant Agreement No 2004310.
Competing interests None declared.
Patient consent Not required.
Ethics approval Regional ethical committee—Central Norway.
Provenance and peer review Not commissioned; externally peer reviewed.