Article Text

Abstract
Objectives To investigate the association between increase in physical activity and changes in cardiometabolic risk factors during a lifestyle intervention programme in routine clinical settings.
Design Prospective follow-up.
Setting 400 primary healthcare centres and occupational healthcare outpatient clinics in Finland.
Participants Individuals at high risk for type 2 diabetes identified in the implementation project of the national diabetes prevention programme (FIN-D2D) and participating in baseline and 1-year follow-up visits. Final study group comprised the 1871 non-diabetic participants who responded at follow-up visit to a question on stability versus increase of physical activity.
Interventions Lifestyle intervention.
Primary outcome measures Cardiometabolic risk factors (body composition, blood pressure and those measured from fasting venous blood samples) measured at baseline and follow-up visits.
Results Of the participants, 310 (16.6% of all responders) reported at follow-up having clearly increased their physical activity during the past year, while 1380 (73.8%) had been unable to increase their physical activity. Those who increased their activity decreased their weight by 3.6 kg (95% CI 2.9 to 4.3, age and sex adjusted, p<0.001) and waist circumference by 3.6 cm (95% CI 2.9 to 4.3, p<0.001) more than those who did not increase their activity. Similarly, those who increased their physical activity had greater reductions in total cholesterol (group difference in reduction 0.17 mmol/l, 95% CI 0.06 to 0.28, p=0.002), low-density lipoprotein cholesterol (0.16 mmol/l, 95% CI 0.06 to 0.26, p=0.001), low-density lipoprotein/high-density lipoprotein ratio (0.17, 95% CI 0.08 to 0.25, p<0.001) as well as fasting glucose (0.09 mmol/l, 95% CI 0.03 to 0.15, p=0.004) and 2 h glucose levels (0.36 mmol/l, 95% CI 0.17 to 0.55, p=0.023) than those who did not increase their physical activity.
Conclusion Increasing physical activity seems to be an important feature of cardiometabolic risk reduction among individuals at high risk for type 2 diabetes participating in preventive interventions in routine clinical settings.
This is an open-access article distributed under the terms of the Creative Commons Attribution Non-commercial License, which permits use, distribution, and reproduction in any medium, provided the original work is properly cited, the use is non commercial and is otherwise in compliance with the license. See: http://creativecommons.org/licenses/by-nc/2.0/ and http://creativecommons.org/licenses/by-nc/2.0/legalcode.
Statistics from Altmetric.com
Article summary
Article focus
There is evidence from randomised controlled trials that supervised exercise interventions improve cardiometabolic risk factor levels.
It is not known how knowledge from intensive interventions of randomised clinical trials can be applied in various real-life clinical settings with limited resources.
In this paper, we report the results of an analysis of physical activity changes and their association to cardiometabolic risk factors among individual at high risk for type 2 diabetes and participating in preventive lifestyle intervention in routine clinical settings of primary healthcare.
Key messages
Less than one-fifth of the participants reported at ‘1-year’ follow-up having clearly increased their physical activity during the past year.
Those who increased their activity improved clearly their cardiometabolic risk profile including reductions of waist circumference and fasting low-density lipoprotein cholesterol and glucose levels, which result persisted after the adjustment for dietary change.
Increasing physical activity seems to be an important feature of cardiometabolic risk reduction among individuals at high risk for type 2 diabetes participating in preventive interventions in routine clinical settings.
Strengths and limitations
FIN-D2D is the first national effort to implement the prevention of diabetes in a primary healthcare setting.
Follow-up data on the changes in physical activity are available from a subgroup of participants.
The limitations of this report include that physical activity changes are documented by a questionnaire.
Introduction
Randomised clinical trials have shown that type 2 diabetes can be prevented or at least postponed by lifestyle changes including changes in diet and physical activity.1 2 Prospective follow-up studies,3 4 one by clinic randomised controlled trial5 and one co-twin control study,6 suggest that physical activity has an independent role in the prevention of type 2 diabetes. Also, a post hoc analysis of the Finnish Diabetes Prevention Study participants suggested that increasing physical activity may substantially reduce the incidence of type 2 diabetes in high-risk individuals.7 In addition, there is evidence that high leisure-time physical activity (LTPA) or high physical fitness is associated with less total and visceral fat and with a reduced prevalence of high cardiometabolic risk factor levels, coronary heart disease as well as reduced mortality.8 There is accumulating evidence from hundreds of randomised controlled trials that physical exercise may help in improving health via different mechanisms including reduced body fat per cent and improvement in many cardiometabolic risk factor levels measured from blood.9
Usually lifestyle interventions for patients at high risk of diabetes, delivered by a variety of healthcare providers in routine clinical settings, are feasible but appear to be of less clinical benefit than structured intensive trials.10 We wanted to know whether an increase in physical activity is associated with beneficial changes in other cardiometabolic risk factors in an intervention carried out in real-life clinical settings with limited resources. In this paper, we report the results of a post hoc analysis of physical activity changes and their association to cardiometabolic risk factors in the high-risk cohort of the National Program for the Prevention of Type 2 Diabetes, implemented through the FIN-D2D programme in five hospital districts in Finland from 2003 to 2008 covering a population of 1.5 million.11–13
Methods
Subjects
The primary strategy of the FIN-D2D was a ‘high-risk strategy’ aiming at preventing diabetes and reducing cardiovascular risk factor levels among high-risk individuals in daily routines in healthcare centres and occupational healthcare outpatient clinics.12 The aim of the ‘high-risk strategy’ was first to identify individuals at elevated risk of developing type 2 diabetes and to support their lifestyle changes required to reduce their future risk. Altogether, 400 primary healthcare centres or occupational healthcare clinics were involved in the programme. To identify high-risk individuals for type 2 diabetes, the modified Finnish Diabetes Risk Score (FINDRISC; scoring ≥15)14 15 was used. The FINDRISC test forms were available in primary healthcare and occupational healthcare centres, in public places and events, and in the internet.13 15 High-risk individuals were also identified by the history of impaired fasting glucose, impaired glucose tolerance, cardiovascular events and gestational diabetes. After identification, consenting high-risk individuals for type 2 diabetes attended health check-ups conducted in the primary healthcare units as a part of the normal routine; therefore, no informed consent was used, but individuals received written information on the FIN-D2D. The Ministry of Social Affairs and Health in Finland gave the permission to collect the data from healthcare units for evaluation purposes to the National Public Health Institute.
Of the high-risk cohort,13 those individuals (age range 18–87 years) who were non-diabetic at baseline (no previous diabetes diagnosis or screen-detected diabetes) had ‘1-year’ follow-up data and did not get diabetes during follow-up were included in the target group of this study (figure 1). Those individuals who got diabetes (6.7%; 157 of 2355 individuals) were excluded from this study as they are usually a focus of additional intensified lifestyle interventions. Finally, those non-diabetic individuals who responded to the structured question on the stability or increase of physical activity at follow-up (N=1871) formed the final study group of this report. Follow-up visits were defined as visits occurring after 9–18 months of baseline visits (mean 14 months). Visits between 17 January 2004 and 28 August 2007 were considered as baseline visits, and ‘1-year’ follow-up visits were between 17 January 2005 and 12 June 2008.13
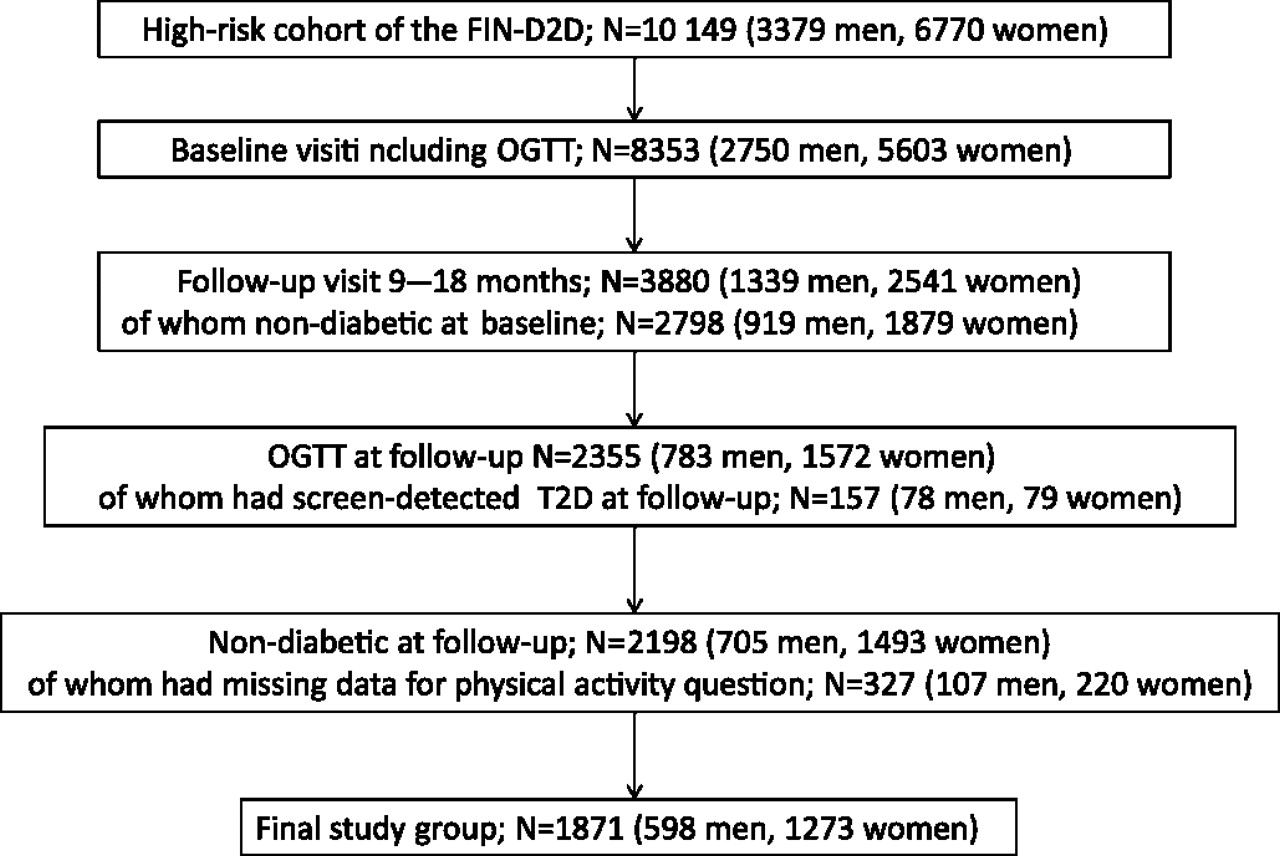
Flow chart of the study participants. OGTT, oral glucose tolerance test; T2D, type 2 diabetes.
Questions on physical activity and diet
LTPA was assessed at baseline and at follow-up by a self-administered questionnaire, which included structured questions about general physical activity level (four alternatives) (appendix question 1), frequency of at least moderate intensity LTPA (appendix question 2), duration of everyday activities (appendix question 3) and a question on changes in physical activity during the past year (appendix question 4) as well as a question on work-related physical activity (appendix question 5). We primarily classified our participants according to responses to the structured question ‘Have you increased your physical activity/exercise training during the past year?’ (the number of responders at follow-up being 1871) which included five options (appendix 1). Participants at follow-up choosing one of the three first options (No, and I do not intend to increase it; No, but I intend to increase it in the near future or I have tried to increase it) were classified as those who had ‘No increase in physical activity’ (n=1380). Those who chose option four (I have clearly increased it) were classified as those who ‘Increased physical activity’ (n=310). Others (n=181) were the group who chose the fifth alternative (I have already previously been highly physically active).
Changes in the use of amount and quality of fat and vegetables, fruits and berries during the past year were asked for in the questionnaire at follow-up (see appendix questions 6–8). Responses to these questions were classified into two classes. Participants who chose one of the three first options or the last option were classified as individuals who had ‘no change’ and those who chose option four were classified as those who ‘changed diet’. If the participant had a change in one of these variables, he/she was considered as having dietary change.
Measurements at baseline and follow-up
The measurements were instructed to be carried out in the primary healthcare setting according to written working instructions. Height was measured to the nearest centimetre. Weight was measured to the nearest 0.1 kg in light clothing. Body mass index (BMI) was calculated as weight (kilograms) divided by height2 (square metres). Waist circumference was instructed to be measured to the nearest centimetre on bare skin midway between the lowest ribs and the iliac crest during expiration. Blood pressure (BP) was instructed to be measured according to the current Finnish guidelines (two times at 1 min interval from the right arm of the sitting subject after 5 min rest using a standard mercury sphygmomanometer or electronic BP measurement device with the recommended cuff size, the mean of two measurements was used in the analysis).
For lipid and lipoprotein determinations, fasting venous blood samples were drawn. Serum levels of total cholesterol, high-density lipoprotein (HDL) cholesterol and triglycerides were determined in the local healthcare centre or occupational healthcare centre laboratories using enzymatic methods. Identical examinations were performed at baseline and at 1-year visit. Low-density lipoprotein (LDL) cholesterol was calculated according to the Friedewald's formula.16
The examination also included an oral glucose tolerance test (OGTT) with a glucose load of 75 g and fasting and 2 h plasma samples.17 The subjects received written instructions on preparation for the test. The test started in the morning after overnight fasting and 20% of the tests used capillary and 80% venous plasma samples at baseline and 15% and 85%, respectively, at 1-year follow-up. Glucose tolerance was classified according to WHO 1999 criteria.17 Individuals reporting at baseline that they had diabetes were not included in the OGTT, and those with fasting venous or capillary plasma glucose level >7.0 mmol/l or 2 h venous plasma glucose >11.1 mmol/l or 2 h capillary plasma glucose >12.2 mmol/l were classified as having diabetes.
All laboratories participated in the national External Quality Assessment Schemes organised by the Labquality (http://www.labquality.fi), and the measurements met the national primary healthcare standards.
Intervention visits
Intervention visits were either individual counselling visits or group sessions, at which the intervention visit form was filled. Counselling based on the intervention experiences in the Diabetes Prevention Study18 and applying different stages of change in behaviour was recommended. The focus of the visits was weight, meal frequency, fat intake, quality of fat, use of salt, fibre intake, alcohol consumption, exercise or smoking taking into account the preferences of the individuals. Group sessions varied from weight maintenance groups to exercise groups and lectures on diabetes and lifestyle changes. The frequency of intervention visits varied between health centres depending on local circumstances and resources, and the total number of intervention visits was recorded. Typical physical activities recommended included brisk walking, cross-country skiing, bicycling and swimming. More comprehensive guidelines of the interventions are freely available in web.19
Statistical methods
Summary statistics are presented as frequencies and percentages for categorical variables and as means (SD) for continuous variables. Pearson's χ2 test was used to compare categorical variables between analysis groups and Student t test was used for continuous variables. Appropriate 95% CIs were calculated for parameter estimates. A paired Student t test or Bhapkar's test was used to examine the changes in self-reported physical activity at the baseline and 1-year follow-up visits.
Mixed models of repeated analyses were used to analyse changes during follow-up in risk factor levels according to self-reported changes in physical activity during follow-up. We first adjusted the results for sex, age at baseline and dietary change during follow-up. As physical activity is known to reduce intra-abdominal fat, we also analysed the results adjusted for sex and age at baseline as well as change in weight or waist circumference. Additionally, we adjusted the results for the number of intervention visits. Statistical analyses and data management were performed using SAS (V.9.2) for Windows. All significance tests were two tailed, and values of p<0.05 were considered statistically significant.
Results
Baseline characteristics of the participants show that the mean BMI was over 30 and mean waist circumference was over 100 cm among both those who increased and did not increase physical activity during follow-up. Mean levels of some of the serum cardiometabolic risk factor levels, such as total cholesterol and LDL cholesterol, were near the upper limit of the recommended range (for details, see table 1).
Baseline characteristics of the participants according to self-reported changes in physical activity at follow-up
Of the participants, 1871 responded at follow-up to the question on increase in physical activity (see appendix question 4) of whom 310 (16.6% of all responders and 18.3% of those who did not report having been highly physically active already previously) reported having clearly increased their physical activity during the past year (table 2), while 1380 were unable to increase their physical activity. Those who reported that they had increased physical activity during follow-up have also increased their physical activity level from baseline to follow-up according to the questions on general physical activity level (p<0.001) and the frequency of at least moderate intensity LTPA (p<0.001), which was not seen among those reporting no increase in physical activity (table 2). Of those participants who increased physical activity during follow-up, 73.2% also changed their diet and 26.8% did not change their diet. Corresponding figures for those who did not increase physical activity were 46.6% and 53.4%, respectively (p<0.001).
Self-reported physical activity at baseline and follow-up according to self-reported changes in physical activity at follow-up
Those who increased their activity decreased their weight by 3.6 kg (95% CI 2.9 to 4.3, sex and age adjusted for group difference, p<0.001), BMI by 1.27 kg/m2 (95% CI 1.04 to 1.51, p<0.001) and waist circumference by 3.6 cm (95% CI 2.9 to 4.3, p<0.001) more than those who did not increase their activity (table 3). Similarly, compared with those who did not increase their physical activity, greater reductions during follow-up were seen among those who increased their physical activity in BP values, the group difference in the reduction of systolic BP being 2.0 mm Hg (95% CI 0.3 to 3.8, p=0.027) and that of diastolic BP being 1.7 mm Hg (95% CI 0.6 to 2.7, p=0.002). Similarly, those who increased their physical activity had higher reductions in total cholesterol (group difference in the reduction 0.17 mmol/l, 95% CI 0.06 to 0.28, p=0.002), LDL cholesterol (0.16 mmol/l, 95% CI 0.06 to 0.26, p=0.001), LDL/HDL ratio (0.17, 95% CI 0.08 to 0.25, p<0.001) as well as fasting glucose (0.09 mmol/l, 95% CI 0.03 to 0.15, p=0.004) and 2 h glucose levels (0.36 mmol/l, 95% CI 0.17 to 0.55, p=0.023) at OGTT than those who did not increase their physical activity (table 3). HDL cholesterol increased more (by 0.05 mmol/l, 95% CI 0.01 to 0.08, p=0.014) among those who increased their physical activity compared with those who did not do so. As these results were similar for men and women (p for gender × group interaction >0.5 for all variables), the results are not shown separately.
Changes from baseline to follow-up in cardiometabolic risk factors according to self-reported changes in physical activity during follow-up
Most of the differences between those who increased and did not increase physical activity persisted after adjustment for the self-reported dietary change (table 3). After adjustment for sex and age at baseline as well as change in waist circumference, those who increased their physical activity during follow-up decreased their weight (p≤0.001, adjusted for sex, age and change in waist circumference), diastolic BP (p=0.015), total cholesterol (p=0.010) and LDL cholesterol (p=0.005) more than those who did not increase their physical activity.
The total number of intervention visits was higher among those who increased their physical activity than those who did not increase it (mean 3.7 vs 2.8, p<0.0001 by Kruskall–Wallis test). After adjustment for sex and age at baseline as well as the number of intervention visits, the group differences in the changes of risk factors persisted either statistically significant or borderline significant (p<0.1, see table 3).
Discussion
Principal finding
Our study shows that increases in LTPA among individuals at high risk for type 2 diabetes and participating in lifestyle interventions in routine clinical settings of the primary healthcare system were associated with reductions in weight, waist, BP, serum lipid risk factor levels and plasma glucose levels. This finding is in line with the findings of meta-analyses from randomised controlled trials on patients with chronic diseases.9 However, less than one-fifth of those reporting not having been highly physically active already previously reported having increased their physical activity and thus the positive responses can be generalised only to the subgroup that really increased their physical activity during the life intervention programme.
Strengths and weaknesses
FIN-D2D is the first national effort to implement the prevention of diabetes in a primary healthcare setting. The first limitation of our study is that the possibility to participate in the intervention was provided to a large number of individuals, and those who participated may only represent the highly motivated fraction of the population. Second, our study includes limitations related to the analysis of effects of real-life interventions concerning documentation time points and standardisation of different measurements. However, it is likely that these shortcomings do not cause biases which having a major effect on our results. Standardisation of laboratory analyses in particular is a known challenge in large-scale multicentre intervention studies. During our study period, there were some changes in the methodology of measuring fasting and 2 h glucose levels. We recorded the method used and did a subgroup analysis among those participants whose glucose levels had been measured with an identical method at baseline and follow-up. These results are not shown separately as the finding in the subgroup was similar to that presented in our results.
Physical activity changes have been quantified using a variety of subjective and objective methods20 but it is not possible to draw any definite conclusions concerning the validity of self-report measurements compared with various direct methods.21 Unfortunately, good studies on the validity of documenting changes in physical activity are lacking, but we used as the main indicator the self-reported change in physical activity, which we consider reliable. This is supported by the fact that the reported change associated expectedly with the changes between baseline and follow-up in the reports of LTPA and everyday activities (table 2).
It is noteworthy that those who increased their physical activity had more intervention visits than those who did not increase, which may contribute to increased physical activity. Those who increased their physical activity also reported more changes in their diet, but the main results remained either statistically significant or borderline significant after adjustment for the number of intervention visits and after the adjustment for dietary change. Our primary analysis strategy did not include adjustment for baseline values as the baseline values may have an influence on how intensively the intervention guidelines are given. However, we adjusted our results also for baseline values (table 3). After adjustment for baseline values, other group differences persisted as statistically significant but the borderline difference in systolic BP was no more statistically significant after the adjustment. However, it is to note that the group difference in triglyceride levels between those who increased and did not increase physical activity became statistically significant after the adjustment for baseline values (p=0.007). Our study did not include fitness tests, which is a limitation, as a possible increase in aerobic fitness would have provided additional proof for the benefits of physical activity. Increase in physical fitness is one of the most direct and consistent effects of increasing physical activity and is important for future functioning and health.9
Comparisons to other studies
Randomised controlled trials with structured, intensive lifestyle interventions promoting healthy eating and moderate physical activity and focusing on the prevention of diabetes in people at high risk1 2 5 22 have shown that clinically significant weight loss of ≥3.5 kg can be achieved. In our subgroup increasing their physical activity level, the mean reduction was 4.3 kg. It has been shown that physical activity maintains or may increase muscle mass but exercise interventions reduce visceral fat.23 In our study, too, waist circumference was reduced as an indirect indicator of intra-abdominal fat reduction. Furthermore, as maintaining weight loss over time is a challenge,24 regular physical activity is an important way of maintaining both a healthy body weight and a healthy body composition.
The mean decreases in systolic (−3.2 mm Hg) and diastolic (−2.9 mm Hg) BP levels among those who increased their physical activity are in line with those observed in randomised controlled trials.25 Our results are in line with the existing literature that exercise training is usually beneficial for the lipid risk factor levels, although there has been some variation in the results of different randomised controlled trials.26–28 It is noteworthy that reduction in LDL levels was statistically significant also after adjustment for change in diet, change in body weight or change in waist circumference. Physical activity improves serum lipid risk factor levels also via other mechanisms than reduction of body fat.29 Reduced LDL levels are obviously associated with a reduced risk for cardiovascular events,30 31 although longer follow-ups are needed to see whether this is true in our participants. Also, we found a small increase in HDL levels, which usually increases fairly consistently in response to long-term vigorous physical activity.26 Reduced LDL levels and increased HDL levels contributed to the reduced LDL/HDL ratio (table 3).
Fasting glucose levels and 2 h glucose levels in the OGTT also decreased in the subgroup who increased physical activity, which is in accordance with the finding of increased insulin sensitivity usually seen in physically active individuals. The known independent effect of physical activity on insulin sensitivity was seen in particular in the 2 h glucose levels (table 3).
Meaning of the study and implications
Increasing physical activity seems to be an important component in cardiometabolic risk reduction among individuals at high risk for type 2 diabetes participating in preventive interventions in routine clinical settings. In this study, we did not compare individuals who received physical activity counselling with individuals who did not receive counselling. However, our finding supports current recommendations on that increasing physical activity is an important part of the preventive interventions of individuals at elevated risk for type 2 diabetes. The finding concurs with the abundant observational evidence on the importance of increasing physical activity on health.8 32 33
Unanswered questions and future research
The purpose of this analysis was not to investigate the factors that predict increases in LTPA. As only a small proportion of our target group increased their physical activity, there is a need to investigate how to identify those sedentary individuals able to increase their physical activity levels and also to study the most effective ways of implementing physical activity recommendations in real life, possibly taking into account individuals' self-efficacy, psychological flexibility and other factors.
Conclusion
Increasing physical activity seems to be an important feature of cardiometabolic risk reduction among individuals at high risk for type 2 diabetes participating in preventive interventions in routine clinical settings.
Appendix 1 Question on leisure physical activity and diet

References
Supplementary materials
Supplementary Data
This web only file has been produced by the BMJ Publishing Group from an electronic file supplied by the author(s) and has not been edited for content.
Files in this Data Supplement:
- Data Supplement - Manuscript file of format pdf
Footnotes
To cite: Kujala UM, Jokelainen J, Oksa H, et al. Increase in physical activity and cardiometabolic risk profile change during lifestyle intervention in primary healthcare: 1-year follow-up study among individuals at high risk for type 2 diabetes. BMJ Open 2011;1:e000292. doi:10.1136/bmjopen-2011-000292
Funding FIN-D2D was supported by hospital districts of Pirkanmaa, Southern Ostrobothnia, Northern Ostrobothnia, Central Finland and Northern Savo, the Finnish National Public Health Institute, the Finnish Diabetes Association, the Ministry of Social Affairs and Health in Finland, Finland's Slottery Machine Association, the Academy of Finland (grant number 129293) and Commission of the European Communities, Directorate of Public Health (grant agreement number 2004310) in cooperation with the FIN-D2D Study Group and the Steering Committee: Huttunen J, Kesäniemi A, Kiuru S, Niskanen L, Oksa H, Pihlajamäki J, Puolakka J, Puska P, Saaristo T, Vanhala M and Uusitupa M. Role of study sponsors: the funding organisations (except for the hospital districts) had no role in the design and conduct of the study; the collection, management, analysis and interpretation of data; and the writing of the manuscript for publication.
Competing interests None.
Ethics approval Ministry of Social Affairs and Health in Finland gave the permission to collect the data from healthcare units specifically for scientific evaluation purposes including scientific publication of data to National Public Health Institute.
Contributors UMK designed this post hoc substudy, drafted the manuscript and is the guarantor. JJ analysed the data. All authors contributed to the study design, collection and interpretation of data and writing of the manuscript. All authors declare that they accept full responsibility for the conduct of the study, had access to the data and controlled the decision to publish.
Provenance and peer review Not commissioned; externally peer reviewed.
Data sharing statement No additional data available.