Article Text

Abstract
Objective Various cardiovascular prediction models have been developed for patients with type 2 diabetes. Their predictive performance in new patients is mostly not investigated. This study aims to quantify the predictive performance of all cardiovascular prediction models developed specifically for diabetes patients.
Design and methods Follow-up data of 453, 1174 and 584 type 2 diabetes patients without pre-existing cardiovascular disease (CVD) in the EPIC-NL, EPIC-Potsdam and Secondary Manifestations of ARTerial disease cohorts, respectively, were used to validate 10 prediction models to estimate risk of CVD or coronary heart disease (CHD). Discrimination was assessed by the c-statistic for time-to-event data. Calibration was assessed by calibration plots, the Hosmer–Lemeshow goodness-of-fit statistic and expected to observed ratios.
Results There was a large variation in performance of CVD and CHD scores between different cohorts. Discrimination was moderate for all 10 prediction models, with c-statistics ranging from 0.54 (95% CI 0.46 to 0.63) to 0.76 (95% CI 0.67 to 0.84). Calibration of the original models was poor. After simple recalibration to the disease incidence of the target populations, predicted and observed risks were close. Expected to observed ratios of the recalibrated models ranged from 1.06 (95% CI 0.81 to 1.40) to 1.55 (95% CI 0.95 to 2.54), mainly driven by an overestimation of risk in high-risk patients.
Conclusions All 10 evaluated models had a comparable and moderate discriminative ability. The recalibrated, but not the original, prediction models provided accurate risk estimates. These models can assist clinicians in identifying type 2 diabetes patients who are at low or high risk of developing CVD.
Statistics from Altmetric.com
Introduction
One of the major complications of type 2 diabetes is cardiovascular disease (CVD). People with type 2 diabetes are at a twofold to fourfold increased risk of developing CVD.1 Formerly, diabetes was regarded as a ‘coronary risk equivalent’ implying a 10-year cardiovascular risk of >20% for every diabetes patient.2 However, recent evidence showed a wide distribution of risk depending on, among others, glycated haemoglobin level and number of concomitant risk factors.3 ,4 Current guidelines have started to acknowledge the heterogeneity in risk and include different treatment recommendations for diabetes patients without other risk factors who are considered to be at lower risk.5 ,6 To identify those diabetes patients who will benefit most from treatment or to determine the intensity of treatment, accurate cardiovascular risk stratification is important.
Over the past decades, many prediction models for cardiovascular risk have been developed. In a recent systematic review, we identified 45 cardiovascular prediction models applicable to diabetes patients, of which 12 were specifically designed for patients with type 2 diabetes.7 Only few of these prediction models were evaluated in independent patient populations.7 The older and most commonly used prediction model, the UK Prospective Diabetes Study (UKPDS) risk engine,8 has been externally validated, and only showed a moderate ability to discriminate between patients who will and will not get an event. Further, there was poor agreement between predicted and actual cardiovascular risk.9–11 Nevertheless, this risk score was included in the influential National Institute of Health and Care Excellence guideline for the management of diabetes.12 In recent years, diabetes management has changed considerably (e.g. wider use of lipid and blood pressure-lowering agents), which questions the use of such an ‘older’ model in current clinical practice. Newer cardiovascular prediction models have been developed for diabetes patients but information on the predictive performance of these contemporary models in external populations is very limited. Meanwhile, validation of risk scores in independent populations is an essential step in risk score development.13 ,14 Therefore, the aim of this study is to quantify the predictive performance of all cardiovascular prediction models developed specifically for diabetes patients. A complete and robust external validation is conducted by inclusion of three validation cohorts with different patient settings and by evaluating the risk scores both before and after simple recalibration to the disease incidence of the target populations.
Methods
Selected cardiovascular risk models
A systematic review identified 12 articles presenting cardiovascular risk scores for diabetes patients specifically.7 Three risk scores predict heart failure or stroke and one did not contain sufficient information to recalculate the model; hence, these four risk scores were excluded.15–18 One additional CVD model for diabetes patients, published after publication of the systematic review, was included in the present study.19 One study provided both a CVD risk score and a coronary heart disease (CHD) risk score.20 Altogether, five CVD models and five CHD models were considered.
The prediction models for CVD were the Action in Diabetes and Vascular disease: preterAx and diamicroN-MR Controlled Evaluation (ADVANCE) risk engine,21 Fremantle risk score,22 New Zealand Diabetes Cohort Study (DCS) risk score,20 Swedish National Diabetes Registry risk score23 and the Cardiovascular Health Study (CHS) risk score.19 The prediction models for CHD were: the DCS risk score,20 Diabetes Audit and Research in Tayside Scotland (DARTS) risk score,24 Hong Kong Diabetes Register risk score,25 Atherosclerosis Risk in Communities (ARIC) risk score26 and the UKPDS risk engine.8
Seven models predict 5-year risk, whereas the ARIC and CHS risk scores predict 10-year risk and the ADVANCE risk engine 4-year risk. Most models are based on a Cox proportional hazards model, except the DARTS risk score (Weibull model) and the UKPDS risk engine (Gompertz model). Online supplementary eTables 1 and 2 provide an overview of predictors used in each model and a short description of the development cohorts.
Study population and design
The study population consisted of three cohorts of patients with type 2 diabetes: the Dutch and German (Potsdam) contributions to the European Prospective Investigation into Cancer and Nutrition (EPIC-NL and EPIC-Potsdam) which recruited patients between 1993 and 1998 and the Secondary Manifestations of ARTerial disease (SMART) study which recruited patients from 1996 onwards. The first two are general population-based cohorts while SMART is a hospital-based cohort of patients newly referred either for the treatment of atherosclerotic CVD or for the management of cardiovascular risk factors only (i.e. hyperlipidaemia, hypertension or diabetes). The three cohorts have comparable endpoint definitions and comprise different patient settings. All cohorts are described in more detail elsewhere,27–29 and a brief description including measurement of predictor values and vital status during follow-up is provided in the online supplement.
In total, 536 prevalent type 2 diabetes cases were identified at baseline in EPIC-NL, 1332 in EPIC-Potsdam and 1685 in SMART. Patients with a history of CVD (EPIC-NL n=71, EPIC-Potsdam n=157, SMART n=1101) and patients with no follow-up (EPIC-NL n=12, EPIC-Potsdam n=1, SMART n=0) were excluded from the analyses. This resulted in 453 patients in EPIC-NL, 1174 patients in EPIC-Potsdam and 584 in SMART for analyses. All participants gave written informed consent prior to study inclusion. The studies were approved by the local ethical committees.
Endpoints
Participants were followed for CVD and CHD. CHD was defined as acute myocardial infarction (AMI) in EPIC-Potsdam, AMI and ischaemic heart disease in EPIC-NL, and AMI or sudden cardiac death in SMART. CVD was defined as AMI or stroke in EPIC-Potsdam; AMI, ischaemic heart disease, stroke, sudden death or heart failure in EPIC-NL; and as a composite of AMI, stroke and vascular mortality in SMART. ICD-10 codes are provided in the online supplement.
Statistical analysis
Time at risk was calculated as time between enrolment and diagnosis of CHD or CVD, date of death, or end of follow-up, whichever came first. Missing predictor values were imputed using 10-fold multiple imputation by predictive mean matching (R-package MICE) including all predictors and the outcome and were pooled using Rubin's rule. Data were assumed to be missing at random conditional on other predictors and/or the outcome. Excluding these participants would yield a loss of efficiency. Further, complete case analysis may have provided biased results, since missing data rarely occur completely at random and might be dependent on the outcome.30 Missing values ranged up to 13.6% (for cholesterol) in EPIC-NL, 21.6% (for HbA1c) in EPIC-Potsdam and 18.0% (for atrial fibrillation) in SMART. The variable albumin to creatine ratio (used in the ADVANCE,21 Fremantle22 and DCS20 risk score) was only available in SMART and not in EPIC-NL and EPIC-Potsdam. In these patients, it was replaced by a proxy based on estimated glomerular filtration rate (see online supplement for details). Retinopathy and atrial fibrillation (only used in the ADVANCE model) were missing in all three cohorts and in the two EPIC cohorts, respectively, and were assigned a value of zero.
Performance of the models was expressed by discrimination (ability to distinguish between patients who will get the disease and patients who will not get the disease) and calibration (agreement between observed and predicted risks). Discrimination was assessed by Harrell's c-statistic for time-to-event data. Calibration was assessed by the Hosmer–Lemeshow χ2 test, calibration plots and expected to observed ratio (number of predicted events divided by number of observed events assuming a Poisson distribution). Calibration was first assessed using the original model and the original time span. Calibration is known to be strongly influenced by the incidence of the outcome in the validation population. To reduce this source of miscalibration, prediction models were recalibrated to the incidence of the outcome in our validation cohorts. For each model in each cohort, recalibration was performed by replacing the original baseline disease-free survival with the average 5-year disease-free survival of the validation cohort. Accordingly, the mean linear predictor was centred to the average risk factor distribution of the validation cohorts. Here, we present calibration of the models after recalibration, as in practice it is also advised to recalibrate a model before putting it to use.13 ,31 Calibration results before recalibration are provided in the online supplement.
A sensitivity analysis was performed including patients with a history of CVD only for EPIC-NL and SMART because patients with a history of CVD in EPIC-Potsdam have not been followed. As the number of outcomes was relatively small, we also reassessed the discrimination of each model using all available follow-up time (i.e. including events that occurred beyond the 5-year time horizon). Statistical analyses were performed using R-2.15.2 for Windows (http://cran.r-project.org/).
Results
In EPIC-NL, 91 CVD and 79 CHD events were documented, of which 52 and 32, respectively, occurred during the first 5 years of follow-up. In EPIC-Potsdam, 73 (41 in first 5 years) CVD events and 39 (23 in first 5 years) CHD events were documented. In SMART, 58 (29 in first 5 years) CVD events were documented and 27 (14 in first 5 years) CHD events.
Online supplementary eTable 3 displays the baseline characteristics of the validation cohorts. EPIC-Potsdam and SMART consisted of more men than EPIC-NL. Patients in SMART were slightly younger, had a shorter diabetes duration and lower HbA1c concentrations compared with the other two cohorts. Further, a higher proportion of patients in SMART were treated with antihypertensive and lipid-lowering drugs compared with the other cohorts.
Discrimination
Most CVD risk scores had a moderate discrimination in all three cohorts, except for the CHS risk score which had a discrimination of only 0.54 (0.46 to 0.63) in EPIC-NL (figure 1). This risk score performed better in EPIC-Potsdam (0.61 (0.52 to 0.70)) and SMART (0.68 (0.59 to 0.78)). Overall, a better discrimination of the CVD risk scores was observed in the SMART cohort, whereas all risk scores had the lowest discrimination in the EPIC-NL cohort.

Discrimination of the cardiovascular disease prediction models in EPIC-NL, EPIC-Potsdam and Secondary Manifestations of ARTerial disease (SMART). The figure displays the c-statistic and 95% CI.
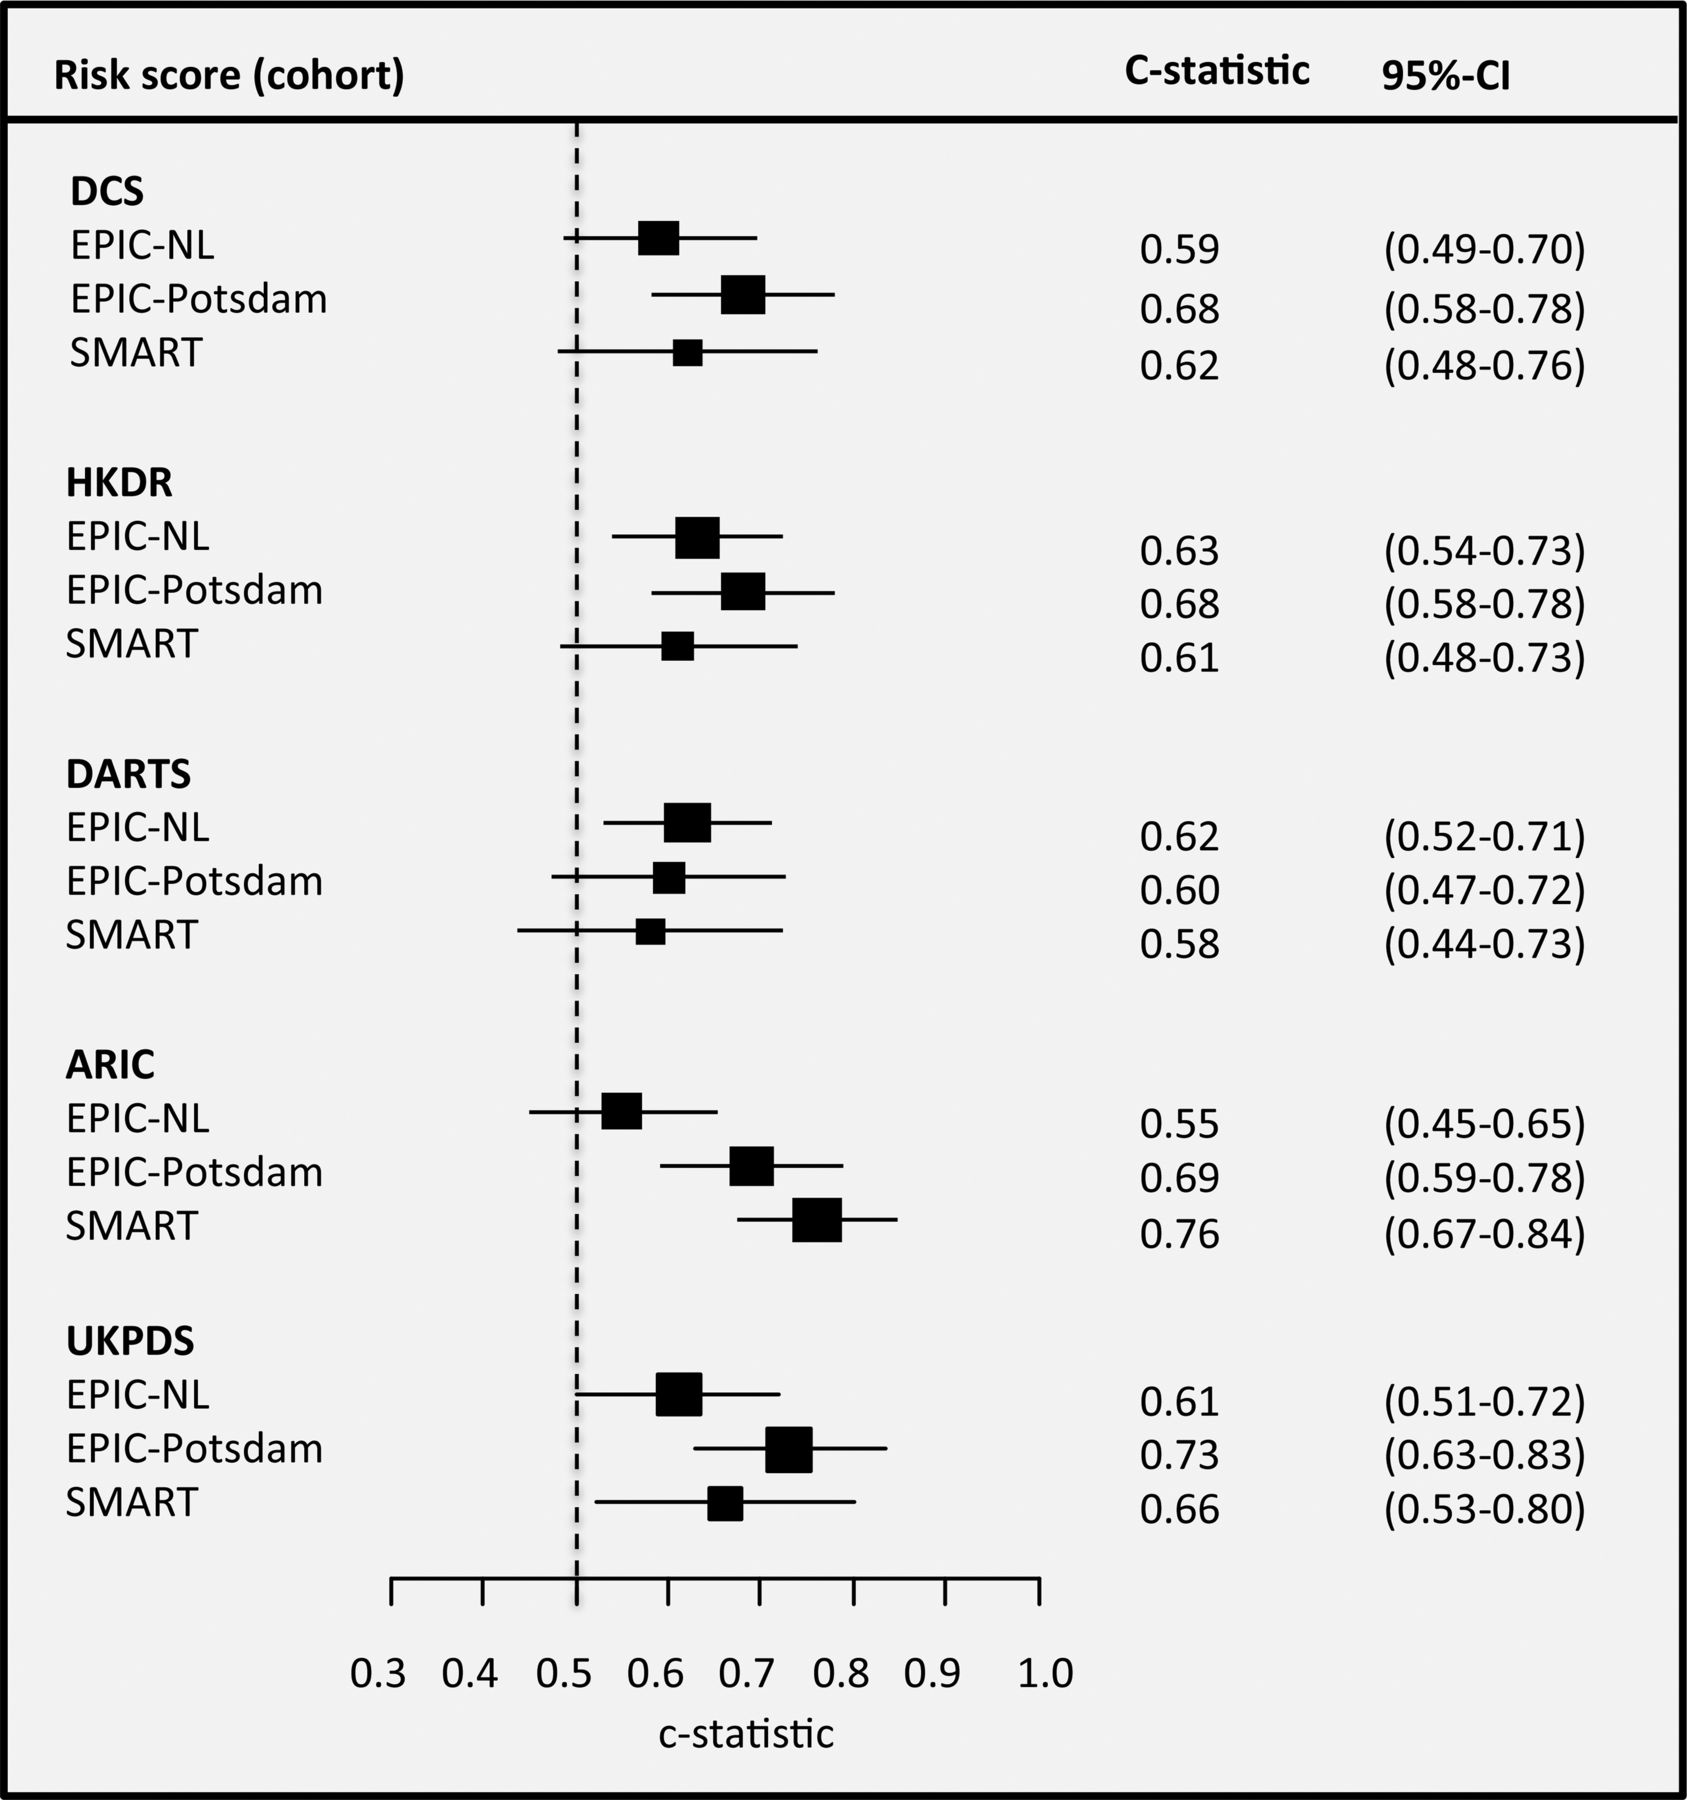
All risk scores performed moderately in discriminating between patients who will and will not get a CHD event during follow-up (figure 2). Discrimination of most risk scores was slightly better in EPIC-Potsdam than in SMART and EPIC-NL. The c-statistic ranged from 0.55 (0.45 to 0.65) for ARIC risk score in EPIC-NL to 0.76 (0.67 to 0.84) in SMART.

Discrimination of the coronary heart disease prediction models in EPIC-NL, EPIC-Potsdam and Secondary Manifestations of ARTerial disease (SMART). The figure displays the c-statistic and 95% CI.
Calibration
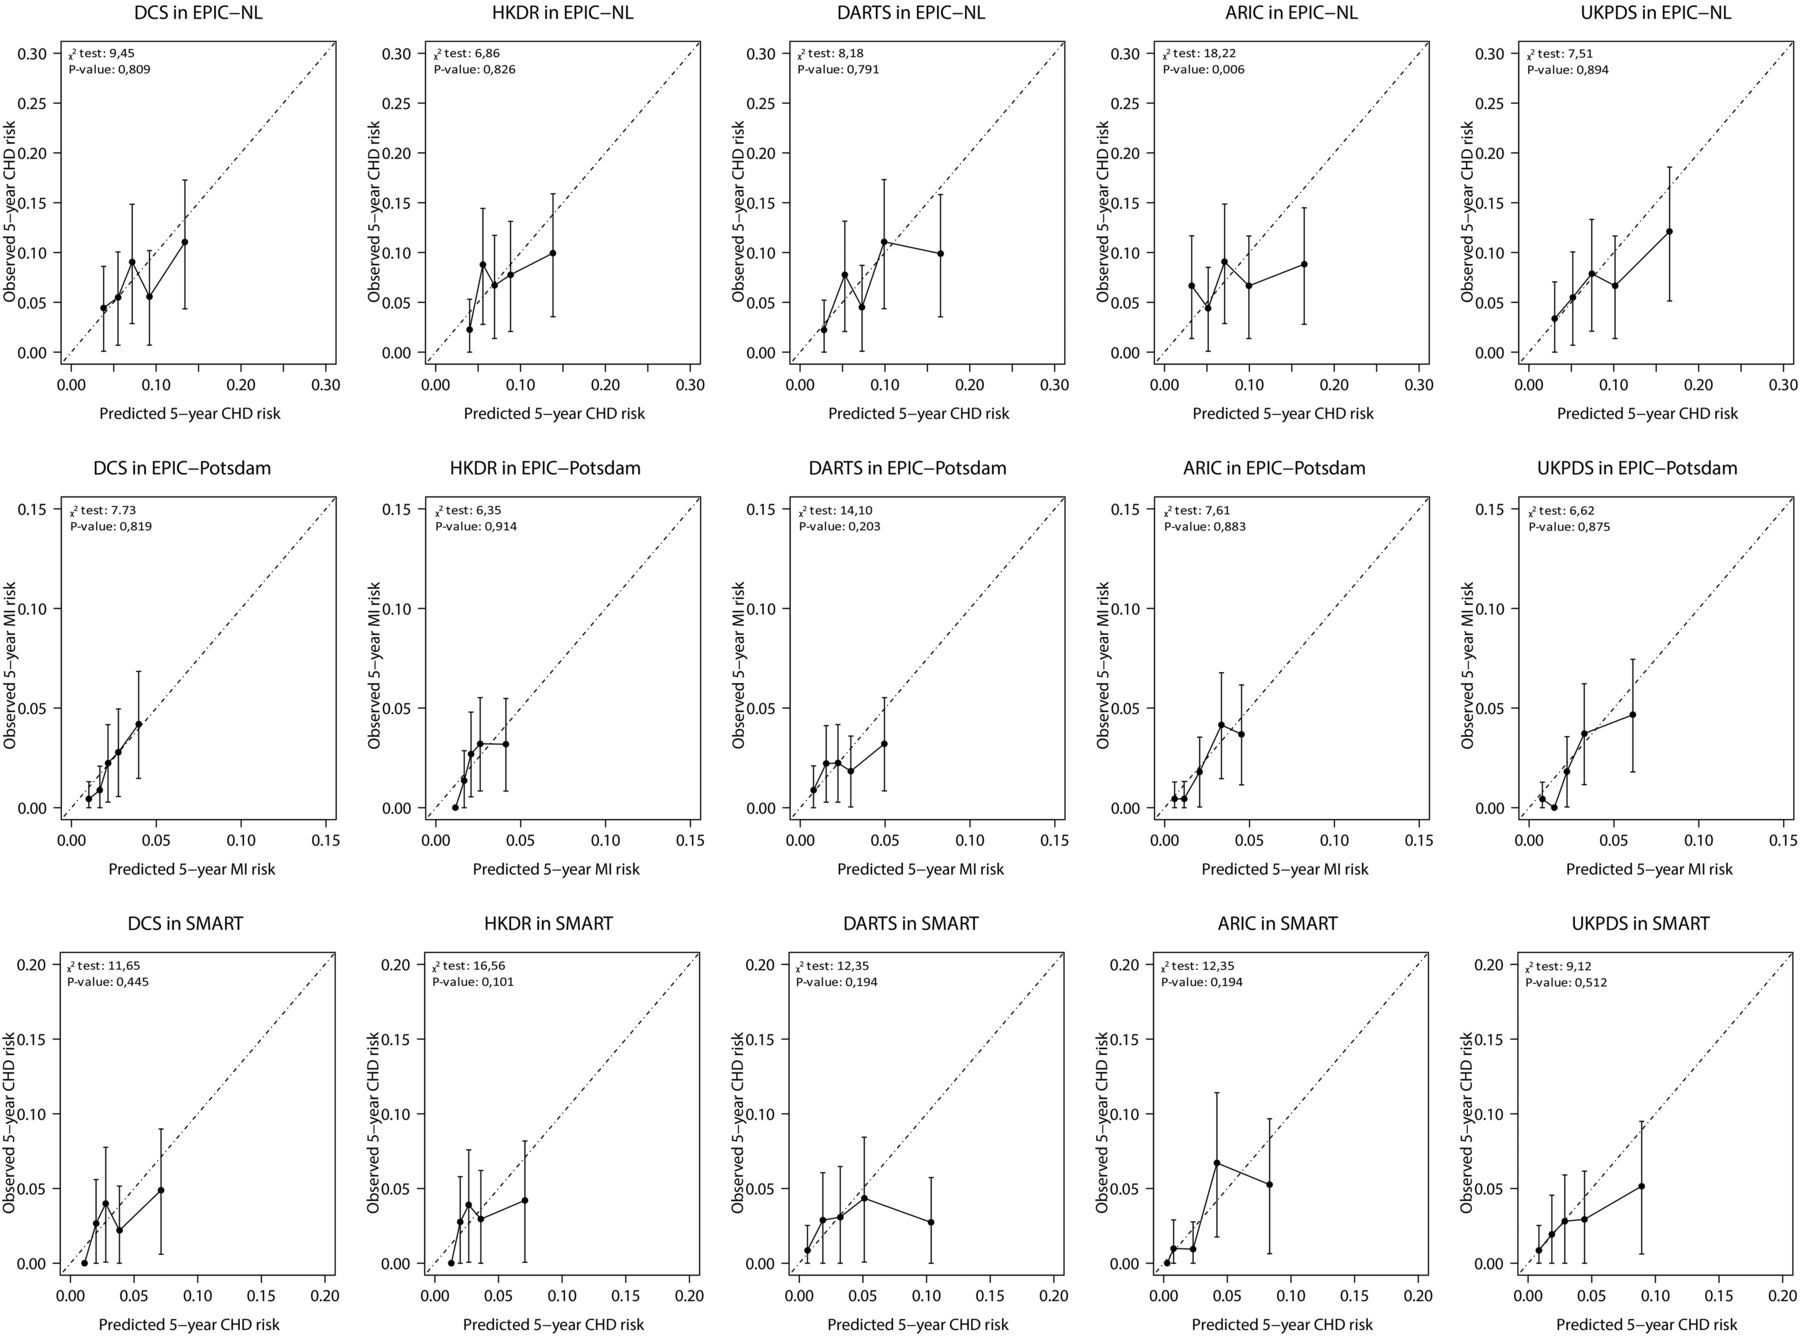
Table 1 shows the expected to observed ratios for the 5-year risks estimated by the risk scores after recalibration. The observed 5-year CVD and CHD risks were 11.5% and 7.1%, respectively, in EPIC-NL, 3.7% and 2.1% in EPIC-Potsdam and 5.7% and 2.7% in SMART. Even after recalibration, all risk scores slightly overestimated risk, although mostly not significant. The largest overestimation was observed in the SMART cohort. Overestimation of risk was highest with the UKPDS risk engine in EPIC-NL (1.19 (0.85 to 1.69)) and in EPIC-Potsdam (1.33 (0.90 to 1.98)) and with the DARTS risk score in SMART (1.55 (0.95 to 2.54)). The calibration plots (figures 3 and 4) show that the overestimation of risk mainly occurred in patients in the highest risk categories for all risk scores. Before recalibration, the calibration of most scores was poor (p values for the Hosmer–Lemeshow χ2 statistic were below 0.05; see online supplementary eFigures 1 and 2) and they highly overestimated risk. After recalibration, χ2 statistics improved and most yielded p values above 0.05, indicating no significant difference between observed and predicted absolute risks.
Expected to observed ratio of the prediction models in EPIC-NL, EPIC-Potsdam and SMART

Calibration plots after recalibration of the cardiovascular disease (CVD) prediction models in EPIC-NL, Secondary Manifestations of ARTerial disease (SMART) and EPIC-Potsdam. The plots display the observed 5-year CVD risk (y-axes) plotted against the average predicted 5-year risk (x-axes) within groups defined by quintiles of predicted risk.

Calibration plots after recalibration of the coronary heart disease (CHD) prediction models in EPIC-NL, Secondary Manifestations of ARTerial disease (SMART) and EPIC-Potsdam. The plots display the observed 5-year CHD or myocardial infarction (MI) (for EPIC-Potsdam) risk (y-axes) plotted against the average predicted 5-year risk (x-axes) within groups defined by quintiles of predicted risk.
Sensitivity analyses
The sensitivity analysis including patients with a history of CVDs yielded comparable results. However, discrimination for the risk scores was generally slightly lower in the SMART cohort inclusive of patients with previous vascular diseases (see online supplementary eFigures 3 and 4). The observed risks were much higher than in the original analyses, 15.4% CVD risk in EPIC-NL and 10.6% CVD risk in SMART. The risk scores still overestimated risk and calibration plots were largely similar to the plots in the primary analysis (see online supplementary eFigures 5 and 6). Including all endpoints that occurred during follow-up, the c-statistics decreased slightly in the EPIC-NL and EPIC-Potsdam cohorts, whereas they increased for SMART (see online supplementary eFigures 7 and 8).
Discussion
In the present study, we assessed the predictive performance of cardiovascular prediction models developed for patients with type 2 diabetes in three different cohorts. The ability of different risk scores to discriminate between patients who will and will not get an event was comparable and only moderate in all three cohorts. After simple recalibration, there was a good agreement between predicted and observed risks for all models, although risk was slightly overestimated in patients with the highest risk.
The strengths of this study are the inclusion of all published cardiovascular prediction models designed for patients with type 2 diabetes and the assessment of these models in three independent cohorts with different disease incidences, in different clinical settings and with only slightly different endpoint definitions. Additionally, we assessed the performance of both the original and recalibrated prediction models, as the predictive performance is strongly influenced by the degree of similarity of disease incidence in development and validation populations.13 ,31 Nevertheless, some limitations need to be addressed. First, not all predictors included in the prediction models (ADVANCE, Fremantle and DCS) were available in two of the three cohorts (albumin to creatine ratio, retinopathy and atrial fibrillation were missing). Exclusion of these models would have led to an incomplete validation. We addressed this issue by assigning a value of zero to atrial fibrillation and retinopathy and by using a proxy for albumin to creatine ratio, which could have resulted in some loss of discriminatory power. Missing values on other predictors ranged up to a fifth of measurements and were completed by multiple imputations to increase efficiency and reduce bias. A second issue is the relatively small number of outcomes occurring in the cohorts over the first 5 years. This resulted in relatively wide CIs for the c-statistics, which has to be taken into account when assessing discrimination. However, a sensitivity analysis using all follow-up data showed comparable discrimination and did not alter our conclusions. Further, differences in model performance attributable to variation in study population characteristics versus differences in endpoint definitions between cohorts could not be disentangled. Last, prescription of glucose-lowering, lipid-lowering and antihypertensive drugs differed between the cohorts, with prescription rates being lower in the EPIC cohorts. This likely reflects differences in clinical setting (hospital versus population-based cohorts) and recruitment period.
In general, discrimination of the risk scores in this validation study was rather moderate. This could be explained by the fact that the risk scores aim to predict the risk of a disease (i.e. CVD or CHD) in patients who already have a related disease (i.e. type 2 diabetes) and might thus be more homogeneous, making it more difficult to discriminate between those who will and will not get an event. The discriminative performance of different risk models varied only marginally within a single validation cohort. For example, all five CVD risk scores showed a discrimination index between 0.64 and 0.69 in SMART. This is surprising since the models were developed in different clinical settings, comprising general population cohorts, primary care cohorts and trial participants. Hence, in this validation cohort, consideration of the clinical setting in which the model was developed is not helpful in selecting the best discriminating model.
Furthermore, performance of risk models varied widely between the validation cohorts and most models performed best in SMART and worst in EPIC-NL. For example, the c-index of the CHS risk score was 0.54 in EPIC-NL and 0.68 in SMART. This can be explained by the fact that the EPIC-NL cohort mainly consists of women, in contrast to the other two cohorts. Gender is an important predictor in most scores, but when the prevalence of a predictor is low, its usefulness for discrimination is poor. Thus, characteristics of the validation cohort have a large influence on the performance of a risk model. Further, differences in outcome definitions between development and validation samples could have influenced performance, with better expected discriminatory power when outcome definitions are more similar.
The ADVANCE,21 Fremantle,22 DCS20 and DARTS24 prediction models have been externally evaluated once before. These studies showed similar results, except for the Fremantle score which had a much better discrimination of 0.84 (0.76 to 0.91). This might be explained by the small size and high disease incidence in their validation cohort, or by differences in patient characteristics between their validation set and our cohorts. In a previous validation study of the UKPDS risk engine in a combined cohort of EPIC-Potsdam and EPIC-NL, we observed a discrimination of 0.65 and a poor calibration, comparable with the results of this study.11 The UKPDS risk engine has also been validated by other studies with varying results; discrimination ranged from 0.65 to 0.76.10 ,11 ,32 ,33 CHD risk is overestimated by the UKPDS risk engine in most validation studies, similar to the overestimation found in the present study. An explanation might be that this risk score is derived in a population from the seventies; diabetes treatment and detection have improved since then and cardiovascular complications in diabetes patients have decreased.
Whereas formerly all diabetes patients were classified as patients with high cardiovascular risk, and treated accordingly, there is a gradient in risk among diabetes patients.3 ,4 Prediction models can assist in estimating their actual risk and might prevent overtreatment in low-risk patients. Therefore, prediction models are increasingly used to guide treatment and inform patients of their risk.5 To be useful in clinical practice, the models should provide accurate and externally validated estimates of risk.14 Although in our validation study discrimination was only moderate, this might not be the optimal measure to assess the performance of prediction models.34 If the aim is to identify patients at different levels of risk to guide treatment decisions, agreement between predicted and actual risk (i.e. calibration) is more important and justifies the use of these models in clinical practice. In our validation study, the calibration of the risk models, after appropriate recalibration, was acceptable. The slight overestimation of risk in high risk is probably less relevant in clinical practice as these patients would meet the treatment threshold anyway, even if actual risk is somewhat lower. Notably, the performance of the original models was poor and this provides a strong argument against implementing a prediction model in clinical practice without recalibrating the risk model to the disease incidence and risk factor distribution of the target population first. Future studies could use data from national databases and hospital or general practitioners registries to validate and update existing algorithms for enhancing predictive accuracy in the population of interest. Given their similar performance, the use of a recalibrated score with fewest missing or most easily obtainable predictors would be a pragmatic choice for clinical practice.
In conclusion, this comprehensive validation study showed a comparable and moderate ability to discriminate between patients who will and will not get an event for all cardiovascular prediction model designed for type 2 diabetes patients. Simple recalibration of the risk models to the disease incidence of the target population resulted in generally accurate estimates of actual risk. There was not a single model outperforming the others. The recalibrated models, but not the original models, can assist clinicians in identifying patients with type 2 diabetes who are at low or high risk of developing CVD.
Key messages
What is already known on this subject?
Type 2 diabetes increases the risk of cardiovascular disease (CVD).
Many algorithms have been developed to predict cardiovascular risk for individual type 2 diabetes patients but only few have been validated in independent populations.
What might this study add?
This study shows the predictive performance of all CVD risk algorithms specifically designed for type 2 diabetes patients in three independent populations.
The ability of all models to distinguish between patients who will and will not have an event (discrimination) is moderate and comparable between all algorithms.
Predicted and observed risks were close after simple recalibration to the disease incidence and average risk factor distribution of the target population for all algorithms.
The original models largely overestimated risk in all three validation cohorts.
How might this impact on clinical practice?
This study provides a strong argument to recalibrate CVD risk algorithms for diabetes patients to the disease incidence of the target population before implementation in clinical practice.
The recalibrated risk algorithms can assist clinicians to identify type 2 diabetes patients who are at low or high risk of developing CVD.
Given their similar performance, a pragmatic approach would be to use the recalibrated model with fewest missing or most easily obtainable predictors.
Acknowledgments
This research was performed within the framework of CTMM, the Center for Translational Molecular Medicine (http://www.ctmm.nl), project PREDICCt (grant 01C-104), and supported by the Netherlands Heart Foundation, Dutch Diabetes Research Foundation and Dutch Kidney Foundation.
References
Supplementary materials
Supplementary Data
This web only file has been produced by the BMJ Publishing Group from an electronic file supplied by the author(s) and has not been edited for content.
Files in this Data Supplement:
- Data supplement 1 - Online supplement
Footnotes
JvdL and SvD contributed equally to this study.
Contributors JvdL and SvD designed and carried out the data analyses, interpreted the results and drafted the manuscript. JWJB, YvdG, FLJV, KGMM, YTvdS and LMP contributed to the research data, designed the data analyses, interpreted the results and revised the manuscript for important intellectual content. AMWS, DLvdA, UN, HB and GEHMR contributed to the research data, interpreted the results and revised the manuscript for important intellectual content. JWJB and LMP are the guarantors of this work and, as such, had full access to all the data in the study and take responsibility for the integrity of the data and the accuracy of the data analysis.
Funding Center for Translational Molecular Medicine, Netherlands Heart Foundation, Dutch Diabetes Research Foundation, Dutch Kidney Foundation.
Competing interests KGMM receives funding from the Netherlands Organisation for Scientific Research (project 9120.8004 and 918.10.615).
Patient consent Obtained.
Ethics approval University medical centre ethics committee.
Provenance and peer review Not commissioned; externally peer reviewed.