Article Text

Abstract
Objective Singapore is a microcosm of Asia as a whole, and its rapidly ageing, increasingly sedentary population heralds the chronic health problems other Asian countries are starting to face and will likely face in the decades ahead. Forecasting the changing burden of chronic diseases such as type 2 diabetes in Singapore is vital to plan the resources needed and motivate preventive efforts.
Methods This paper describes an individual-level simulation model that uses evidence synthesis from multiple data streams—national statistics, national health surveys, and four cohort studies, and known risk factors—aging, obesity, ethnicity, and genetics—to forecast the prevalence of type 2 diabetes in Singapore. This comprises submodels for mortality, fertility, migration, body mass index trajectories, genetics, and workforce participation, parameterized using Markov chain Monte Carlo methods, and permits forecasts by ethnicity and employment status.
Results We forecast that the obesity prevalence will quadruple from 4.3% in 1990 to 15.9% in 2050, while the prevalence of type 2 diabetes (diagnosed and undiagnosed) among Singapore adults aged 18–69 will double from 7.3% in 1990 to 15% in 2050, that ethnic Indians and Malays will bear a disproportionate burden compared with the Chinese majority, and that the number of patients with diabetes in the workforce will grow markedly.
Conclusions If the recent rise in obesity prevalence continues, the lifetime risk of type 2 diabetes in Singapore will be one in two by 2050 with concomitant implications for greater healthcare expenditure, productivity losses, and the targeting of health promotion programmes.
- Adult Diabetes
- Statistical Methods
- Demographics
- Simulation
This is an Open Access article distributed in accordance with the Creative Commons Attribution Non Commercial (CC BY-NC 3.0) license, which permits others to distribute, remix, adapt, build upon this work non-commercially, and license their derivative works on different terms, provided the original work is properly cited and the use is non-commercial. See: http://creativecommons.org/licenses/by-nc/3.0/
Statistics from Altmetric.com
Key messages
-
Asians in general, and Singaporeans in particular, are increasingly at risk of diseases such as type 2 diabetes that are associated with modern, high calorie, sedentary lifestyles.
-
Forecasts of the prevalence of diseases such as type 2 diabetes require models that quantify and predict the changing dynamics of the drivers of the epidemic, including population age structure and evolving obesity levels.
-
Using evidence synthesis, Bayesian inference, and individual-based modeling, we have developed forecasts of type 2 diabetes prevalence and incidence to 2050 in different segments of the population of Singapore, with ethnic minorities bearing a disproportionate burden, a marked rise in the incidence of type 2 diabetes in the workforce, and a rise in the lifetime risk to one in two.
-
It’s tough to make predictions, especially about the future.
––Yogi Berra
Introduction
Type 2 diabetes mellitus (T2DM) looms large over Asia. Asians, especially South Asians, are predisposed toward T2DM to a greater extent than ethnic Europeans.1 ,2 At even greater risk are ethnic Asians living in Europe or the Americas, where this predisposition is accentuated by the adoption of modern, urban lifestyles rich in processed, energy-dense foods and reduced physical activity. Examples abound: rates of T2DM are 1.3–4.8 times higher among American Asians and Pacific Islanders than in Europeans living in the Americas,3–6 2–3 times higher among American Japanese than in Japanese living in Japan,7–9 and 1.9–6 times higher among South Asians versus Europeans living in Europe.10 ,11 India (51 million) and China (43 million) already have more people with type 2 diabetes than the USA (27 million),12 but as lifestyles and diets in rapidly developing Asia become increasingly urbanized, it therefore must be expected that the burden of T2DM will continue to grow in the most populous continent.
Singapore is a microcosm of Asia. Three broad ethnicities, corresponding to the three major population centers in Asia, are represented in the city-state: East Asians, in the Chinese majority, South East Asians, via the Malay, and South Asians of mostly Indian and Sri Lankan descent. Over the past few decades, these groups have been exposed to significant changes in lifestyle, diet, and other environmental influences that are typical of a high-income society, changes that are reflected in the doubling of the prevalence of T2DM from 5% in the 1980s13 to 11% in 2010.14 Rapidly ageing, increasingly sedentary, Singapore presages the problems other Asian countries will face in the decades ahead.
Since T2DM is one of many competing public health issues that will accompany the ageing of Singapore, as in Asia, it is vital to be able to forecast the future burden of T2DM to facilitate rational planning of public health campaigns. To predict involves positing a model that encapsulates epidemiological and medical subject-area expertise on the main drivers of T2DM at the individual and population levels. Rigorous subsequent parameterization of the model ensures its relevance to the population to which it is applied. The degree of complexity of the model depends on the objective of the analysis and the data available: neither too simplistic, lest it fail in extrapolation to scenarios it was not validated for; nor more complex than is needed to meet those objectives. Methods used in other settings to forecast the evolving burden of chronic diseases include microsimulation models positing assumptions on future obesity and physical activity trends,15 extrapolating linear regressions of the prevalence of overweight and adjusting geographic distribution using deprivation indices,16 forecasting the changing demography of a country with or without increasing incidence,17–20 and modeling body mass index (BMI) and its impact on development of T2DM and related complications.21 ,22
One of the most challenging issues in developing a model for a future public health phenomenon is that the health of a population is never in a stable equilibrium. Although the observed rise in T2DM prevalence from 8.6% (95% CI 7.7% to 9.6%) in 1992 to 11.3% (95% CI 10.3% to 12.3%) in 2010 in Singapore can be attributed to ageing, as the age-specific prevalence has remained relatively static since the 1990s,14 it would be misleading to forecast the future prevalence of T2DM by applying the historic age-specific prevalence of T2DM to a projected age distribution at some future time point—for the age-specific prevalence of obesity, and overweight, another important risk factor of T2DM,23 have risen substantially in most demographic segments over this time period.24 This rise foreshadows an increase in the age-specific prevalence of T2DM, as the increasingly obese young of today become the increasingly diabetic old of tomorrow. Predictions must hence incorporate ageing and secular trends in obesity, reflecting changes in diet and physical activity, as otherwise they may severely understate the future burden. Furthermore, evidence of a genetic contribution to T2DM from familial aggregation (the risk of T2DM increases twofold to fivefold for individuals having a family history,25 ,26 while heritability of T2DM—the proportion of phenotypic variance attributed to genetic factors—has been estimated at approximately 26% in a Danish population-based twin study27) suggests that the effect of genetics should also be incorporated.
This paper describes a demographic, epidemiological model of Singapore and its use in forecasting the total prevalence of T2DM (diagnosed and undiagnosed) to 2050. The model is an individual-based model which represents each resident in the city-state, past (from 1990) and future (to 2050), thereby facilitating the incorporation of obesity trends, both secular and over an individual's life span. The model incorporates demographic processes including the mass migration Singapore has experienced over the past two decades, submodels for the evolution of each individual's yearly BMI and genetic risk of T2DM, and a T2DM onset submodel, and data from national statistics, nationally representative cross-sectional surveys, longitudinal studies, molecular epidemiological cohort studies, and the literature, analyzed using Bayesian statistical methods.
Methods
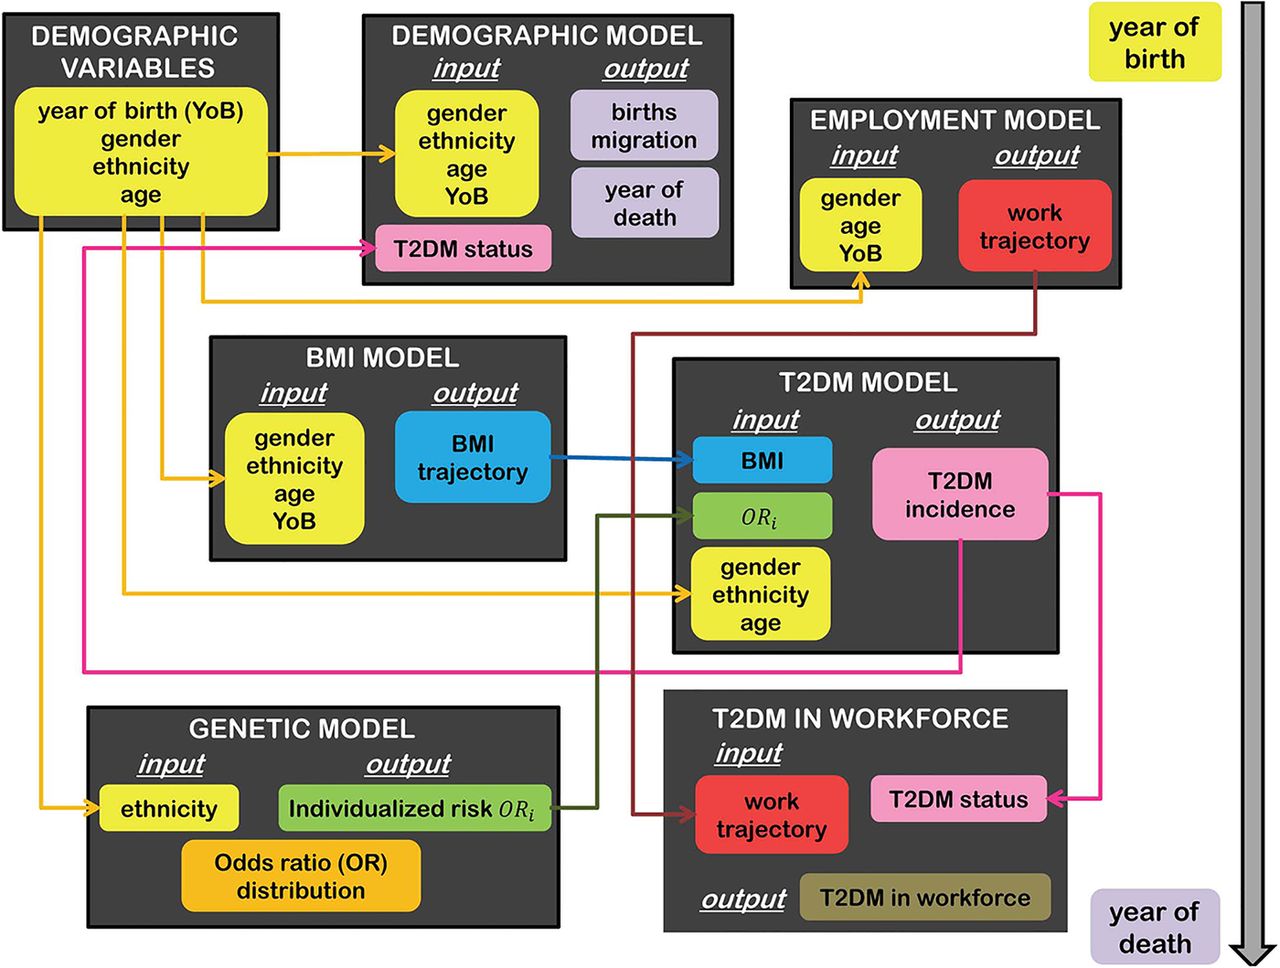
The model contains submodels as depicted in figure 1 and summarized below. Mathematical details are provided in the online supplementary methods.

Overview of model structure. Boxes represent submodels; arrows indicate direction of information flow between submodels. BMI, body mass index; T2DM, type 2 diabetes mellitus.
Demographic model
The model is incremented in units of 1 year and tracks the resident population of Singapore from 1990 to 2050. Individuals die according to mortality rates that vary by age, year of birth, gender, and for the three main ethnicities of Singapore—Chinese, Indian, Malay—and a fourth category aggregating others (mostly of mixed ethnicity; other South East Asians; and Europeans28).
The mortality rate is parameterized as a smooth spline function stratified by gender with proportional hazards for other effects, including T2DM status.
Fertility rates differ for each age, year of birth, and ethnicity, with ethnicity assumed to be inherited maternally. The fertility rate is modeled as a Gaussian function with parameters that are functions of demographic factors.
Migration (outward and, especially, inward: the population grew from 3 million in 1990 to 5.1 million in 2010) is represented by a baseline migrant age profile curve, a spline curve stratified by ethnicity and gender, with a random effect applied to each year to reflect the economic situation and government policy changes. The parameters of these models are estimated from national statistics released by the Singapore Department of Statistics, in particular the 1990, 2000, and 2010 censuses of population, the annual yearbook of statistics, which conveyed information on the size, age structure, gender, and ethnic composition over time, and life tables by gender and fertility and mortality rates. These rates and statistics (except the censuses and life tables) had for the most part a resolution only to 5-year age bands—coarser for older ages—and no information on migration. Crude birth rates and death rates by ethnicity during the period 1990–2010 were obtained from the Report on the Registration of Births and Deaths.
A three-state Markov model describes how the resident population moves between work, unemployment, and out of the workforce, conservatively assuming no correlation between T2DM and workforce participation, and no changes in retirement ages. In this, weekly transition probabilities between states vary by age, calendar year, and gender, and are estimated from the annual Report on the Labour Force in Singapore, which provides data on the resident population by 5-year age groups, gender, and workforce status, and unemployed resident population by 10-year age groups and duration of unemployment (in weeks), and the General Household Survey in 1995 and 2005, which provide data by 5-year age groups, gender, and workforce status. We obtained estimates of weekly age-dependent transition probabilities via Markov chain Monte Carlo (MCMC) methods.29 ,30
BMI model and data
We developed an individual, hierarchical model of BMI trajectories over an adult life span, stratified by gender and ethnicity. In this, an individual's BMI over time is described by Gaussian fluctuations around a sequence of connected lines, with joints at age 35, 55, and 75. Each individual has a different starting BMI (at age 18) and three BMI gradients, which are assumed to come from a multivariate normal distribution whose hyperparametric mean and covariance are common to all individuals of that gender and ethnic group. These hyperparameters are estimated using (1) longitudinal data from the Singapore Prospective Study programme (SP2), which contains BMI measurements and T2DM status at two of three time points (the 1992 or 1998 National Health Survey (NHS) and a follow-up visit around 2005), and (2) aggregate data from the 2004 and 2010 NHSs on the proportions of four BMI categories (underweight, normal weight, overweight, and obese) within age bands (18–29, 30–39, 40–49, 50–59, 60–69) and gender/ethnicity groups.
Genetic risk factor model and data
From a combined list of 44 single-nucleotide polymorphisms (SNPs) previously reported to be associated with T2DM in an Asian population,31–33 association analysis between the SNPs and T2DM was performed using additive logistic regression on SNPTEST software34 in three cohort studies—the Singapore Chinese Eye Study (SCES, with 302 people with type 2 diabetes and 1089 without), the Singapore Malay Eye Study (SiMES, with 794 patients with type 2 diabetes and 1420 non-diabetes), and the Singapore Indian Eye Study (SINDI, with 977 people with type 2 diabetes and 1169 without). Fourteen SNPs were collectively selected for the p value threshold of 0.05 in at least one cohort study representing one major ethnic group in Singapore (see online supplementary table S1). To account for heterogeneous genetic risks within ethnic groups, the joint distribution of 14 SNPs associated with T2DM in each of the three main ethnicities of Singapore was determined from the corresponding cohort study. Assuming representativeness of the cohorts and no gender bias in the distributions of the associated risk alleles, the frequencies of all 16 384 allele combinations of 14 SNPs were determined within these groups. A point estimate of the odds ratio (OR) for each SNP from a meta-analysis35 was combined with these frequencies to determine the distribution of ORs for T2DM for each ethnicity. As the distribution of ORs conditional on ethnicity was approximately log normal, we derived its mean and SD by weighing log ORs with associated allele frequencies. To prevent double counting the effect of ethnicity on T2DM incidence and genetic risks, we standardized the ORs such that the weighted mean OR within each ethnic group was 1 (see online supplementary figure S1). In the simulation model, for people belonging to the three main ethnicities, individuals’ genetic risks, which were modeled to be conditionally independent of their BMI trajectories given ethnicity, were selected randomly from the appropriate distribution of ORs. For people belonging to other ethnic groups, the distribution of ORs of the Chinese majority was used.
Type 2 diabetes onset model and data
Using the same longitudinal data as in the BMI model, we generated a single putative BMI trajectory that matches the observed data for each individual using importance sampling. This was then used together with age, gender, and ethnic group within a logistic model for T2DM incidence. The cumulative probability of developing T2DM between the two observation times was derived by summation and used to generate the likelihood function, which permitted estimation using MCMC. In the simulation model, the probability of progressing from a non-diabetic state to T2DM was calculated annually conditional on the individual's demographics and BMI and genetic risk, with the effects assumed to operate multiplicatively in the ORs.
All participants provided written informed consent.
Sensitivity analysis
We also developed a model in which BMI and genetics were excluded as risk factors and the risk of getting T2DM was a function of age, ethnicity, and gender only. This model is described in the online supplementary methods.
Software
All statistical analyses were performed in R V.3.0.036 or JAGS V.3.1.037 ,38 using customized scripts that took around 24 h to run on a desktop for each model and demographic group. All graphics were created using the grid package.39 Simulations were run in C++ with individuals represented as objects, linked to their mothers, with attached static and dynamic variables. The simulation was initialized using the demographic structure described in the 1990 census, with individuals added to the population when their mothers gave birth or when they immigrated to Singapore. Multiple runs using different random number seeds and parameters, drawn from the posterior distribution to account for parametric uncertainty, were used to build up a Monte Carlo sample, with each simulated population queried to output characteristics, such as the number of people with type 2 diabetes within any age range at any time. The C++ code was compiled using the GCC compiler, and runs, covering the time horizon 1990–2050 and around 6.25 million individuals, took an average of 3 min for one whole run.
Results
Incidence of type 2 diabetes
Incidence rates were estimated and projected from the fitted model by extracting new, potentially undiagnosed cases of T2DM among various demographic segments. Crude incidence rates, past and future, are tabulated in table 1 by gender and ethnicity. Incidence rates are expected to double over the period 1990–2050 for all the demographic groupings considered. Among the Chinese, the incidence is expected to rise from 5 (95% prediction interval 4–5) per 1000 woman-years to 9 (7–10), or 6 (5–6) per 1000 man-years to 12 (10–13), over these six decades. For Malays, the rise is steeper (7 (6–8) to 14 (13–16) among women or to 17 (15–18) in men), and for Indians, steeper still, with an annual incidence of 17 (16–19) to 19 (17–21) per 1000-person years by 2050, from 8 (7–10) to 10 (9–12) in the 1990s.
Modeled and forecast crude type 2 diabetes incidence rates, per 1000 person-years
Prevalence of type 2 diabetes
The total prevalence of T2DM (diagnosed and undiagnosed) among Singapore adults (age 18–69) is projected to rise from 7.3% (6.8–8%) in 1990 to 15% (13.8–16.2%) in 2050 (figure 3B). Modeled past and projected future age-specific prevalence rates are depicted in figure 2. The prevalence was generally markedly higher in Indians and Malays than Chinese Singaporeans, with Malays and Indians having a risk profile roughly the same as a Chinese 10 years their senior. Although prevalence among female Chinese sexagenarians is projected to stay relatively constant, rates are expected to grow substantially in other groups: by 2050, we expect 35% (31–39%) of Chinese men aged 60–69 having T2DM, and around half of the Malays and Indians of that age group (figure 2). A moderate risk in prevalence among young adults is forecast (see online supplementary table S2).
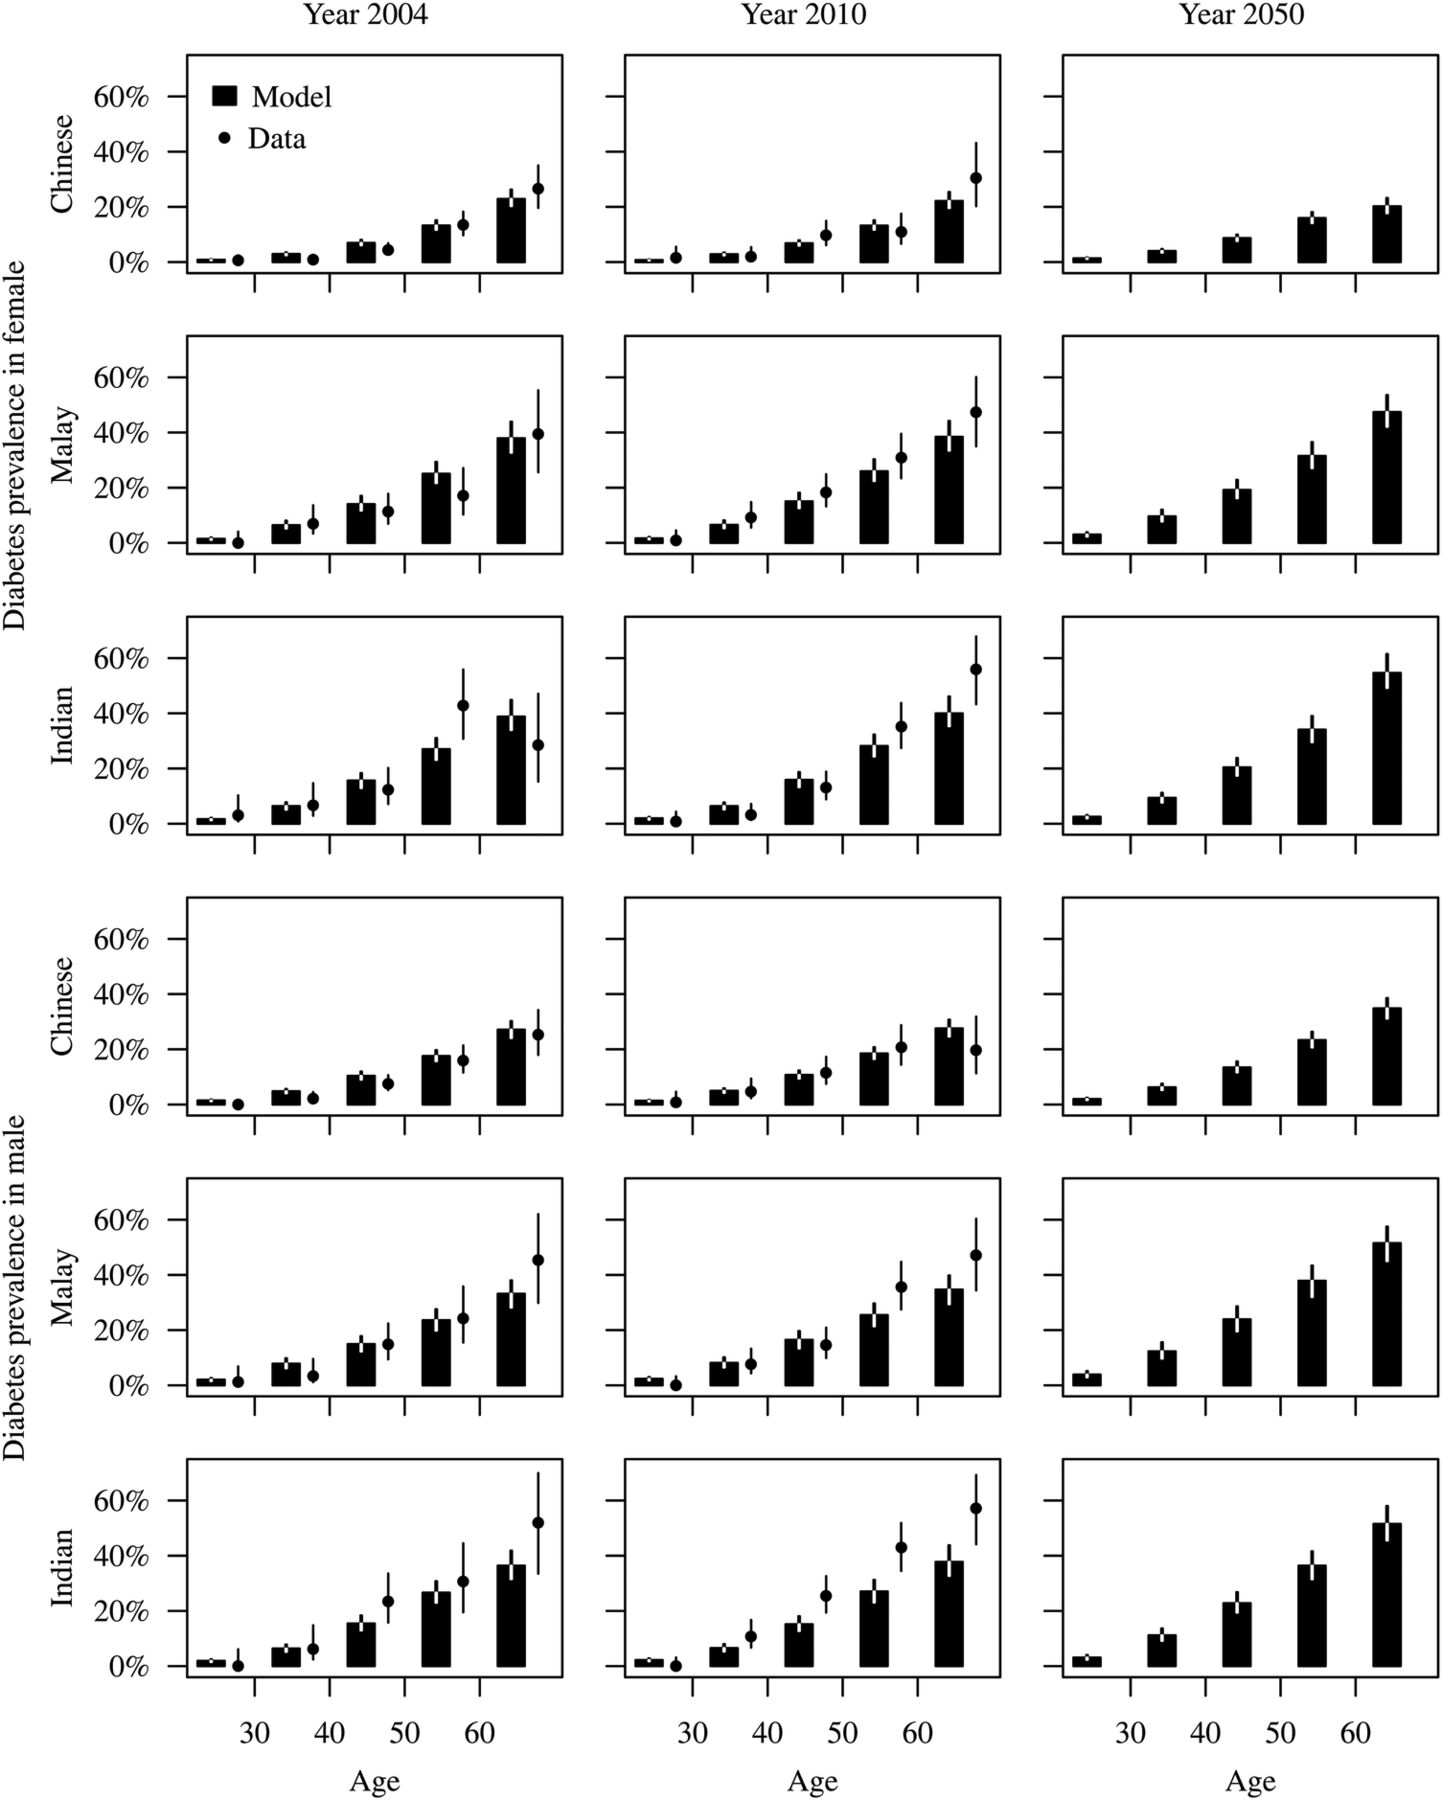
Age-specific, gender-specific, and ethnicity-specific prevalence estimates and forecasts of (diagnosed and undiagnosed) type 2 diabetes. Model forecasts are presented as bars with 95% prediction intervals. Data are indicated by dots with 95% empirical CIs.

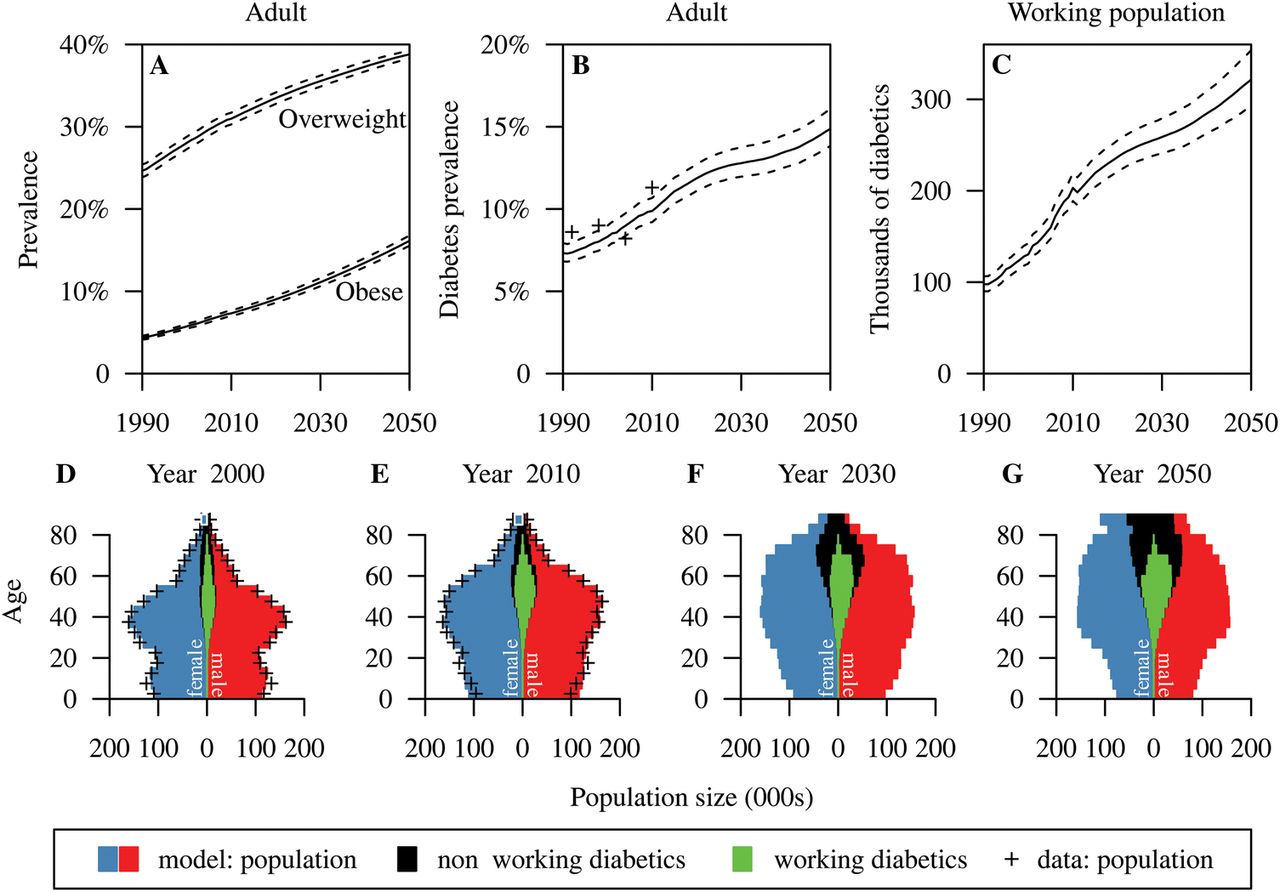
Obesity and type 2 diabetes forecasts. Top: forecast prevalence of obesity and overweight in adults (A), forecast prevalence of type 2 diabetes among working age adults (B) and number of patients with type 2 diabetes in the workforce (C). Means and 95% prediction intervals are plotted. For prevalence, point estimates from the National Health Surveys are overlaid. Bottom (D–G): modeled age pyramids with patients with type 2 diabetes and diabetic workers overlaid. Red and blue bars indicate women and men, respectively; black bars indicate patients with type 2 diabetes (not in the workforce) of both genders; and green bars indicate working diabetics. The + symbol indicates data from the censuses of 2000 and 2010.
Age and overweight
The projected rise in the total prevalence of T2DM in Singapore is driven by two factors: the modeled ageing and fattening of the population. The age pyramid (figure 3D–G) is predicted to become increasingly top heavy, with the proportion of the population under age 20 falling from 25.2% (2010) to 15.9% (2050), and the proportion over the age of 60 soaring from 13.3% to 31.9% over the same time frame. The effect of this rise in the prevalence of the main risk factor (advanced years) is compounded by a dramatic rise in obesity and overweight levels. The fraction of the population that is obese is predicted to quadruple from 4.3% in 1990 to 15.9% by 2050, while those overweight are projected to expand in number from 24.6% in 1990 to 38.6% by 2050 (figure 3A). This projected increase in BMI at the population level can be attributed to all subgroups (see online supplementary figure S3–S7). The forecast rise in obesity levels is most stark for Malays and Indians (hitting 40% among Malay women aged over 40), but the large Chinese majority is also expected to see a rise in obesity levels of around 10 percentage points (see online supplementary table S3).
The confluence of these factors will, if the projections hold true, lead to a rise in the number of those in the workforce living with T2DM, a proxy for the impact of T2DM on productivity and corporate health insurance plans, from 97 600 (89 800–106 100) in 1990 to 321 600 (293 000–353 700) by 2050 (figure 3C). The type 2 diabetic population is predicted to increase from 358 500 (333 900–386 100) in 2010 to 673 200 (624 700–727 400) in 2030 and to 909 300 (839 700–986 900) in 2050.
Model validation
Demographic structure
The model is seeded with the 1990 census. It reproduces the 2010 census very accurately (figure 3E), save for a slight underprediction of the number of women aged 25–40, which we attribute to migration.
BMI trajectories
The distribution of each pair of BMI observations for the SP2 participants agrees well with the posterior predictive distribution of trajectories within each ethnic group and gender demographic segment (see online supplementary figure S2).
Prevalence of type 2 diabetes
The modeled overall proportion of patients with type 2 diabetes closely corresponds to results of the NHSs, except for the outlying 2004 survey (figure 3B). It is not known why the 2004 NHS is so discrepant from the other NHSs. Prevalence of T2DM within age, gender, and ethnic groups is similar between the model and data (figure 2), though the small sample sizes on stratification lead to unstable empirical estimates with broad uncertainty intervals, so the concordance is not perfect.
Sensitivity analysis
We also developed a simpler model for T2DM that does not take into account BMI changes and genetic effects, with population ageing being the main factor contributing to the increase in prevalence of T2DM in this model. Consequently, projected T2DM prevalence among Singaporean adults aged 18–69 by 2050 for the simpler model is 11.8% (11.2–12.6%), lower than in the full model (15%) even though the overall historic prevalence of the two models is quite close to each other (7.1% for the reduced model and 7.3% for the full model in 1990; see online supplementary figure S9). The reduced model for T2DM assumes that the effect of age on T2DM risk is constant over time. As a result, the lifetime risk for Singaporean adults aged 18–69 for this model does not change much over time, from 38.9% (36.3–41.9%) in 1990 to 39.2% (36.9–42.5%) in 2050. In the full model, lifetime risk for T2DM for Singaporean adults aged 18–69 is projected to rise from 34.5% (31.9–38.2%) in 1990 to 43.8% (40.8–47.5%) in 2050 as the increasing BMI trend is accounted for. An interesting observation is the gender difference in projected lifetime risk of T2DM in the two models (see online supplementary table S4). For the reduced model, women would have a marginally higher lifetime risk than men (39.9% vs 38.4% in 2050). In the full model, however, women are forecast to have a lower lifetime risk than men (lifetime risks of T2DM by 2050 are 37% in women and 51% in men). This is due to Chinese women, the largest group of women in Singapore, not experiencing the same rise in overweight as did men and other women, so that simple forecasts based on current age prevalence would substantially underestimate future prevalence of T2DM in all groups other than Chinese women.
Discussion
Modeling provides a way to explore what-if scenarios quickly and cost effectively. In this paper, we use modeling to answer the question: If the recent rise in obesity levels in Singapore were maintained, what would the effect on the prevalence of T2DM be one generation from now? The answer is worrying: a rise in the overall prevalence from 1 in 13 to around 1 in 6 working age adults, a lifetime risk of around 1 in 2, and an increasing burden of T2DM in the workplace. T2DM has been estimated to reduce a worker's productivity by around a third in the USA,40 due to disability, premature mortality, early retirement, and absenteeism, in that order,41 while in Canada, those with T2DM were found to be between 150% and thrice as likely not to be in the labor force, and to have an income approximately 25% lower than non-diabetics.42 Employers in Singapore will have to decide whether they should take responsibility for preventive action, such as screening or weight loss programmes, to mitigate future losses.
Singapore is an ideal test bed for public health research in Asia. Not only does its Chinese, Indian, and Malay population make it a miniature of Asia as a whole, but other countries in Asia are likely to look increasingly like Singapore, as they become increasingly developed, urbanized, sedentary, and aged. The current prevalence of T2DM in populations comparable genetically and culturally, but at an earlier stage of development, is markedly lower (in mainland Chinese sexagenarians 19%43 vs 25% in Singapore Chinese, in elderly Malays in Malaysia 21%44 vs 37%), boding ill for the future elsewhere in Asia.
All modeling studies make some degree of simplifying assumptions. In this study, the risk of developing T2DM is determined by demographic factors, a secular trend, genetics, and current BMI, as a proxy for overweight and general ill health. The model averages over other factors that have a role include epigenetics,45 physical activity,46 diet,47 family history,48 socioeconomic status, and pregnancy.49 The formulation as an individual-level model allows observed variability between individuals to be characterized, along with risk factors that vary dynamically over lifetimes. The genetic risk model includes 14 SNPs that are significantly associated with T2DM in the Singapore population and assumes that these have an effect independent of BMI, as none of the 14 SNPs has been reported to be associated with overweight/obesity in the Singapore setting.50 Future work should verify this assumption and might incorporate the effect of genetic factors on BMI, for which twin studies indicate that estimated BMI heritability is 47–90%.51 The primary data source on weight that was available to us was aggregate statistics from the NHS, which on stratification led to small demographic segments with substantial sampling variability. The model we used pools information between age groupings and from cohort studies, which we believe yields more reliable estimates. Even more reliable estimates of change might result from mining medical records, which would permit relaxation of the distributional assumptions used herein.52 The data used to parameterize the models of BMI and T2DM were from cohort studies based on nationally representative samples of adults, overcoming the common difficulty in generalizing from cohort studies to the general population, though this means that BMI trajectories in childhood and adolescence were not modeled. With data on childhood obesity, the prevalence of which has risen globally in recent decades,53 we would have been able to capture any recent changes in this critical age period. Future work should address this data paucity. The model assumes no interaction between overweight/T2DM and workforce participation except interactions mediated by demographics, and research is needed in the Singapore setting to elucidate whether any additional interactions are present. The T2DM model does not incorporate prediabetes, an intermediate state of T2DM when blood glucose level shows abnormalities—impaired fasting glucose or impaired glucose tolerance—but does not exceed the threshold determining T2DM. Introducing a prediabetic state into the T2DM model would stratify the non-diabetic population into low-risk and high-risk groups, enhancing the capability of the model for possible intervention evaluation. This would, however, require additional information on reversion rates from a prediabetic state to a normal state or on progression rates from a prediabetic state to T2DM in the Singapore context.
The long-term goal of this modeling project is to bring together three models: the present one, which projects the prevalence of T2DM in different subpopulations, a model of outcomes—from more complications from macrovascular diseases (eg, cardiovascular disease) and microvascular diseases (eg, kidney, nerve, and eye diseases), to healthcare expenditure and workplace absenteeism—and a model of interventions, such as healthy eating or active lifestyle programmes. Taken together, these would allow the effectiveness, and cost effectiveness, of different health promotion interventions to be assessed in silico to enhance the evidence base of public health decision making by determining how much of a reduction to levels of overweight and obesity would be needed to substantially reduce the burden of T2DM, and how much can realistically be achieved by health promotion campaigns.
References
Supplementary materials
Supplementary Data
This web only file has been produced by the BMJ Publishing Group from an electronic file supplied by the author(s) and has not been edited for content.
Files in this Data Supplement:
- Data supplement 1 - Online supplement
Footnotes
-
Contributors TPP developed and programmed the model, performed statistical analysis, and wrote the paper. LA developed the model, provided demographic expertise, and wrote the paper. EST provided endocrinological expertise and wrote the paper. KHXT performed statistical analysis and wrote the paper. QY performed statistical analysis and wrote the paper. WYL provided epidemiological expertise and wrote the paper. YYT, CYC, XW, and TYW contributed to genetic analysis and wrote the paper. KSC conceived the study, provided public health expertise, and wrote the paper. ARC conceived the study, supervised the study, developed the model, and wrote the paper. He is also the guarantor of this paper.
-
Funding This work was supported by the Population Health Metrics and Analytics project, funded by the Ministry of Health, Singapore. ARC is also grateful for funding from the NUS Initiative to Improve Health in Asia. Grant number NIHA-2011-1-004.
-
Competing interests None.
-
Ethics approval The SP2, SCES, SINDI, and SiMES studies were approved by the Singapore Health Services Centralised Institutional Review Board.
-
Provenance and peer review Not commissioned; externally peer reviewed.
-
Data sharing statement No additional data are available.