Article Text

Abstract
Objective We evaluated long-term impact of sustained weight loss versus weight regain on cardiovascular risk factors in real-world clinical practice.
Methods We evaluated 129 obese patients with diabetes enrolled in Weight Achievement and Intensive Treatment (Why WAIT) program, a 12-week clinical model of intensive lifestyle intervention. After 1 year, we divided participants into group A, who maintained <7% weight loss (47.3%) and group B (52.7%), who maintained ≥7% weight loss. We continued to follow them for a total of 5 years.
Results The total cohort lost 23.8 lbs (−9.7%) at 12 weeks and maintained −16.2 lbs (−6.4%) at 5 years (p<0.001). Group A maintained −8.4 lbs (−3.5%) and group B maintained −23.1 lbs (−9.0%) at 5 years. In group A, A1C decreased from 7.5±1.3% to 6.7±0.9% at 12 weeks but increased to 7.7±1.4% at 1 year and 8.0±1.9% at 5 years. In group B, A1C decreased from 7.4±1.2% to 6.4±0.9% at 12 weeks and rose to 6.8±1.2% at 1 year and 7.3±1.5% at 5 years. Despite weight regain, group A maintained improvement in low-density lipoprotein-cholesterol and high-density lipoprotein-cholesterol with worsening of serum triglycerides and no change in blood pressure (BP). Group B maintained improvement in lipid profile for 5 years and had significantly lower BP for 18 months.
Conclusions Weight reduction in patients with diabetes can be maintained for 5 years and is predicted by patients’ ability to maintain ≥7% weight loss at 1 year. A1C and triglycerides deteriorate with weight regain, while other lipid improvements are maintained. Sustained weight loss is associated with significantly lower A1C for 5 years and lowers BP for 18 months.
Trial registration number NCT01937845.
- Weight Management
- Lifestyle Intervention(s)
- Cardiovascular Disease Risk
This is an Open Access article distributed in accordance with the Creative Commons Attribution Non Commercial (CC BY-NC 4.0) license, which permits others to distribute, remix, adapt, build upon this work non-commercially, and license their derivative works on different terms, provided the original work is properly cited and the use is non-commercial. See: http://creativecommons.org/licenses/by-nc/4.0/
Statistics from Altmetric.com
Key messages
Long-term weight reduction in obese patients with diabetes can be achieved in real-world clinical practice and is predicted by patient's ability to maintain ≥7% weight loss at 1 year.
Weight regain is associated with rapid deterioration of A1C and serum triglycerides.
Improvement in low-density lipoprotein-cholesterol and high-density lipoprotein-cholesterol after weight loss continues for long-term despite weight regain.
In patients who sustain long-term weight loss, A1C continues to improve for 5 years and blood pressure continues to improve for the first 18 months.
Introduction
Weight reduction and lifestyle modification are strongly recommended for all overweight and obese patients with type 2 diabetes.1 ,2 We previously demonstrated that modest weight reduction of ∼7% over a 6-month period through caloric reduction and increased physical activity improved insulin sensitivity, endothelial function and several markers of inflammation and coagulation in obese patients with and without diabetes.3 ,4 Other studies showed that insulin sensitivity improved by 58–98% after intensive physical training.5 ,6 However, most of these studies were of short duration of <6 months. Longer term studies of intensive lifestyle intervention in patients with prediabetes and diabetes showed a remarkable weight regain after the first year.7 ,8 Recently, a new analysis of the Look AHEAD study according to the magnitude of weight loss and weight regain showed that larger weight losses produced greater improvements in A1C, systolic blood pressure (BP), high-density lipoprotein (HDL)-cholesterol, and triglycerides at years 1 and 4.9 Despite maintenance of weight loss, A1C levels worsened between years 1 and 4, but remained below baseline only in those with large weight losses. Moreover, those who had large initial weight loss but full regain of weight had greater improvements in A1C levels at year 4 than those with smaller or no initial weight loss. However, it is not known if similar results are observed in long-term weight management in real-world clinical practice.
The primary aim of this study is to evaluate the long-term changes in cardiovascular risk factors in response to sustained weight loss versus weight regain beyond 1 year of enrollment in a translational model of intensive lifestyle intervention designed for use in real-world clinical practice.
Methods
Weight Achievement and Intensive Treatment (Why WAIT) is a 12-week multidisciplinary program for weight reduction and intensive diabetes management designed and implemented at the Joslin Diabetes Center in Boston since 2005.10 The program is followed by monthly support sessions to help participants to maintain long-term weight loss. Over 5 years, we evaluated the differences in cardiovascular risk factors between those who completed the program and sustained ≥7% weight loss at 1 year versus those who failed to maintain similar percentage of weight loss at 1 year.
Participants
Participants in the Why WAIT program were obese patients with body mass index (BMI) between 30 and 45 kg/m2 and with type 1 or type 2 diabetes. They were referred from their primary care physicians or from their endocrinologists at Joslin Clinic. Eligible patients were enrolled in groups of 10–15 participants each. Of the consecutive 141 participants in the Why WAIT program over 3 years from September 2005 to September 2008, 12 participants were excluded from this analysis; 7 dropped out during the 12-week program and 5 had bariatric surgery during the 5 years of the follow-up (figure 1). Bariatric surgery is known to induce significant weight loss that may affect cardiovascular risk outcomes in a different way than non-surgical weight management. The remaining 129 patients had an average age of 53.7±10.1 years, an average BMI of 38.3±5.3 kg/m2 and a mean diabetes duration of 9.6±9.4 years. Twelve patients had type 1 diabetes, and the remaining had type 2 diabetes.
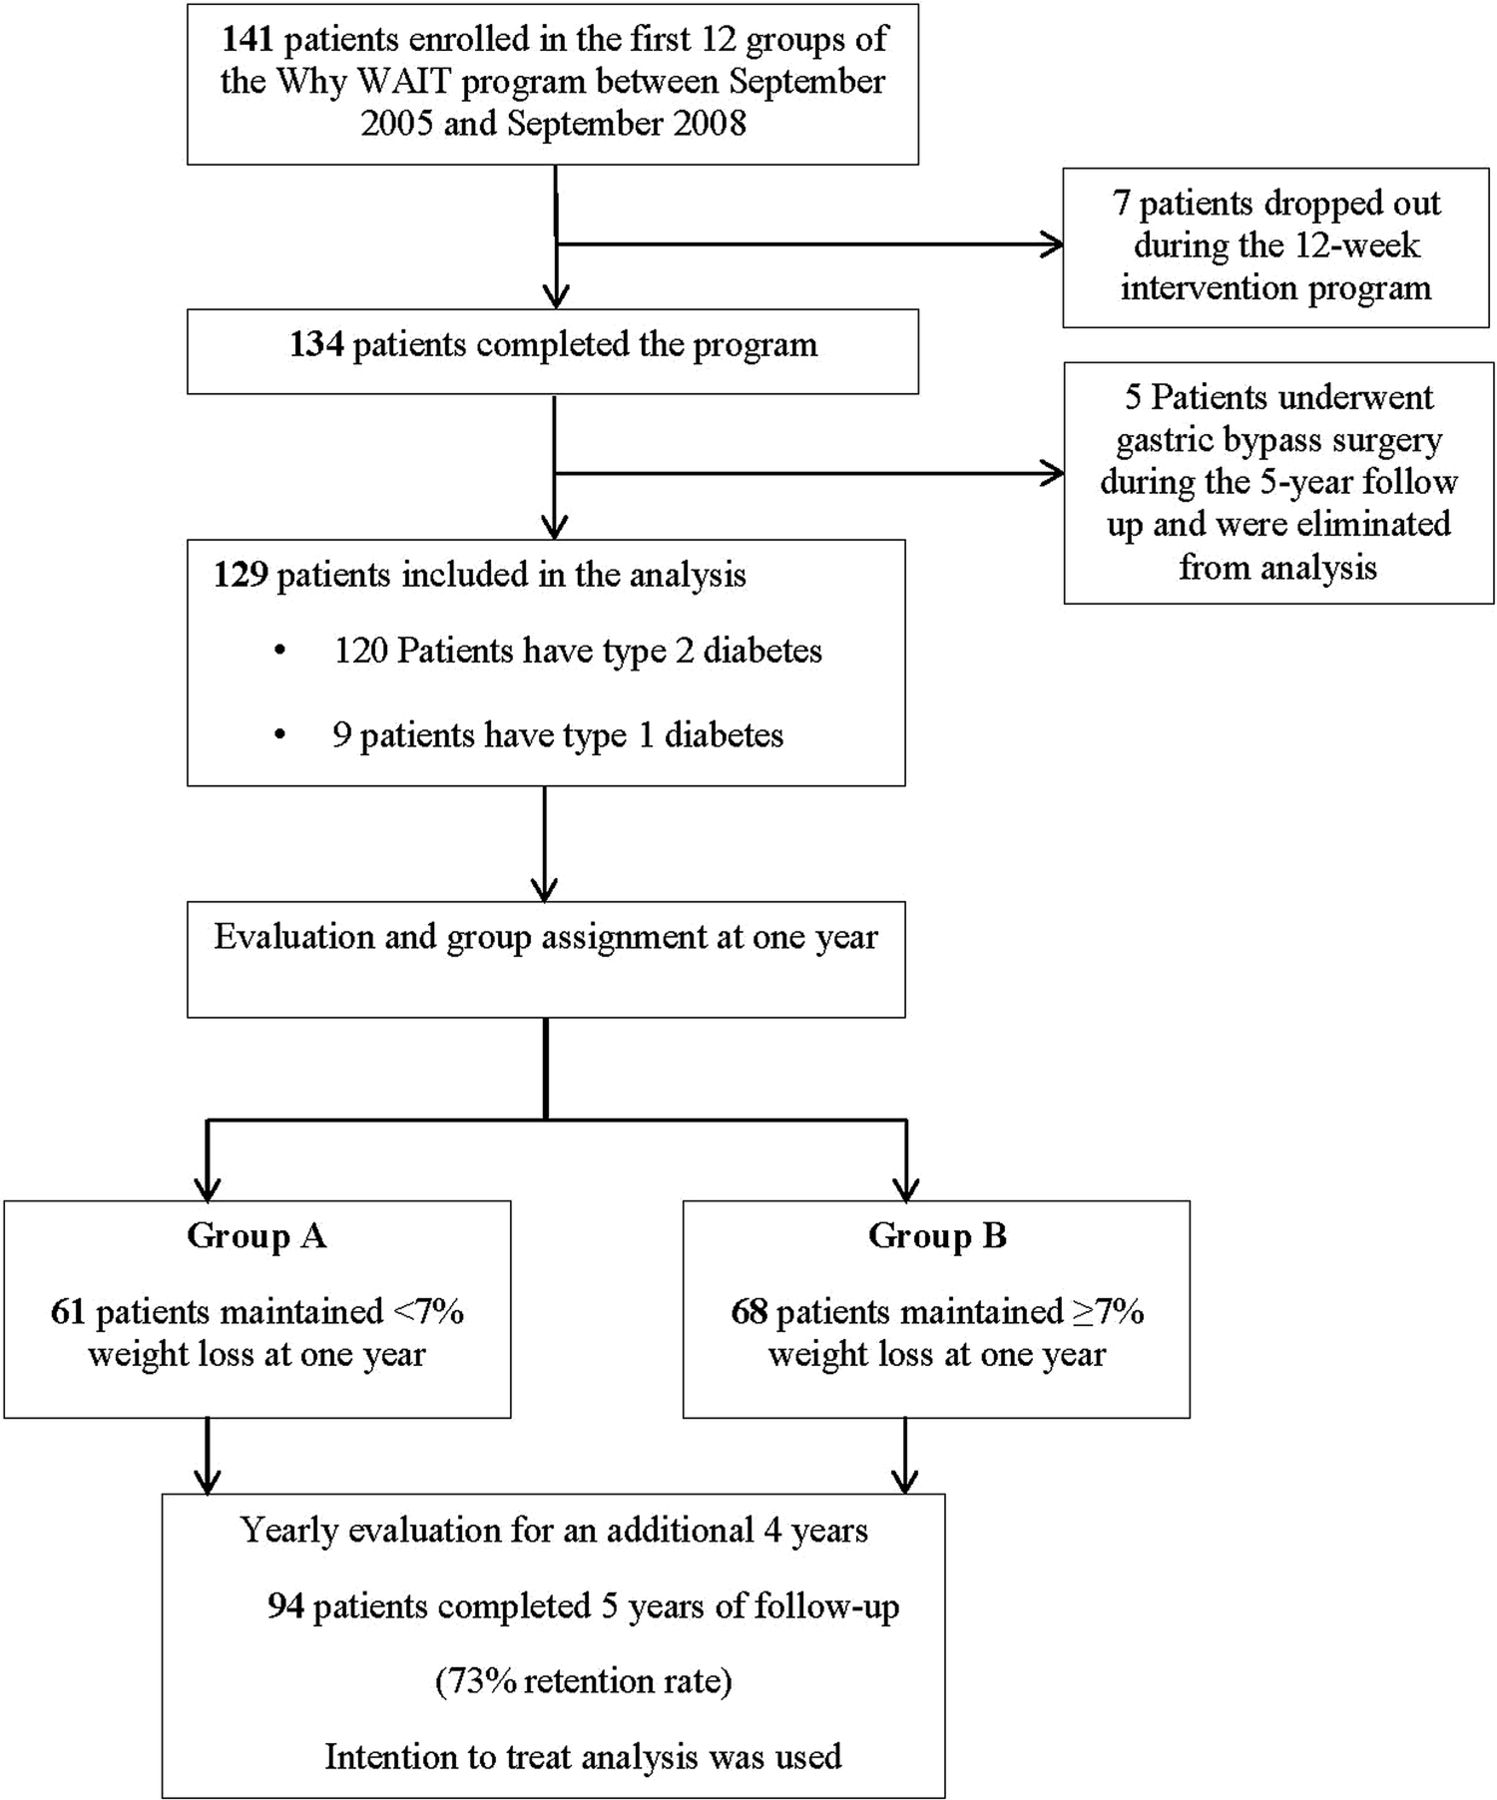
Flow chart of participants in the 5-year follow-up after intensive lifestyle intervention using the Why WAIT model in clinical practice.
Patients were not enrolled into the program if they had abnormal renal function (serum creatinine >1.5 mg/dL or estimated glomerular filtration rate (eGFR) <60 mL/min/1.73 m2 surface area) due to the high protein content in the program's dietary plan. Patients were also excluded if they were unable to exercise due to orthopedic or cardiac reasons. Prior to the program, each participant was asked to provide a medical clearance to exercise signed by a primary care physician or a cardiologist. Participants were also required to have an exercise stress test, if it was not carried out within the prior 2 years, and to have a dilated eye examination to exclude active or potential retinal hemorrhage. Prior to the program, exercise capacity was evaluated using the 6 min walk test,11 ,12 a validated test convenient for assessing patients with limited exercise capacity. Fasting body composition was evaluated using the Bioelectrical Impedance Analysis (BIA) technique (Tanita TBF-410GS, USA).13 Each participant underwent a comprehensive evaluation by the intervention team (diabetologist, registered dietician (RD), clinical exercise physiologist (EP) and psychologist or social worker). The study protocol was approved by the Joslin IRB Committee, and each participant signed the study consent form before enrollment in the program.
Group assignment
After 1 year, we divided participants into group A, who failed to maintain >7% weight loss (47.3%) and group B (52.7%), who maintained ≥7% weight loss. One year was selected as a better differentiating initial-point of long-term weight loss since rebound in body weight frequently occurs within a shorter period and particularly after the initial intensive period of intervention (3 months). We continued to prospectively follow them for an additional 4 years (figure 1). Since group assignment occurred at 1 year, we had to retrospectively analyze the 1 year data and the 12-week program results. However, all analyses after the first year were based on prospective data collected for each group.
Follow-up measurements
Key metabolic parameters were measured at baseline, after 12 weeks of intervention and every 3–6 months during their regular visits to Joslin clinic over 5 years. These measurements included A1C, lipid profile and direct low-density lipoprotein (LDL)-cholesterol, BP, serum creatinine, blood urea nitrogen (BUN) and urinary microalbumin/creatinine ratio.
Anthropometric measurements
Body weight was recorded weekly for the first 12 weeks then during their routine appointments at Joslin clinic over the following 5 years. Waist and hip circumferences and body composition were recorded at the start of the program and after 12 weeks.
Why WAIT program
Why WAIT program is conducted through weekly sessions over 12 consecutive weeks. Each weekly session is 2 hours in duration from 17:00 to 19:00. Full description of the Why WAIT program was previously published.10 In brief, the program included the following five components.
Medication adjustments
Whenever applicable, diabetes medications were changed or adjusted initially by the program diabetologists using a fixed algorithm (see online supplementary appendix 1 and 2). The algorithm was designed to reduce or eliminate medications known to contribute to weight gain or cause hypoglycemia during weight reduction while increasing or initiating other antihyperglycemic medications known to be weight neutral.14 Diabetes medications with proven weight loss potential were encouraged if covered by patients’ insurance plans and were appropriate. Participants were asked to monitor their blood glucose 5–8 times/day; before meals, at bed time, before and after exercise and occasionally after meals. Blood glucose logs were reviewed weekly, and diabetes medications were adjusted accordingly by a diabetes nurse practitioner and/or a certified diabetes educator according to the algorithm. Antiobesity medications were not used in the program. Since the same algorithm was applied for all participants, there was no difference in medications between the two groups at baseline. By the end of 12 weeks, antihyperglycemic medications were reduced by around ∼50%.
supplementary appendix
supplementary appendix
Dietary intervention
All participants received dietary evaluation by the program registered dietitians. The evaluation included review of dietary history and 24 hour dietary recall of typical daily intake, review of adherence to dietary instructions during previous weight management attempts and evaluation of possible potential barriers to follow a structured meal plan. On the basis of gender and typical caloric intake from the 24 hour dietary recall, each participant received a hypocaloric meal plan rounded to the nearest 1200, 1500 or 1800 calorie level. These meal plans were developed according to the Joslin Nutrition Guidelines for obese patients with type 2 diabetes, providing ∼40–45% of daily calories from carbohydrate, <35% from fat with saturated fat <10%, 1–1.5 g/kg of adjusted body weight from protein with 14 g/1000 calories of fiber.15 ,16 All participants were instructed to use diabetes-specific meal replacements (DSMRs) for breakfast and lunch for the initial 6 weeks. The DSMRs used in this program were either BOOST Glucose Control, BOOST Calorie Smart (Nestle Medical Nutrition, Minneapolis, Minnesota, USA) or Glucerna Hunger Smart (Abbott Nutrition, Columbus, Ohio, USA). Participants were encouraged to eat two snacks between meals. Lists of 100-calorie and 200-calorie snacks were provided. For dinner, participants were instructed to select from 14 different menus. Each dinner menu included description of its ingredients, nutrition facts and cooking instructions. Three menu books were designed for the 1200, 1500 and 1800-calorie meal plans. All meal plans were low in glycemic index and low in sodium (<2300 mg/day). Each participant was provided with a written description of the assigned meal plan and a dietary logbook and was asked to record food intake throughout the program. Participants who failed to achieve 3% weight loss by the 4th week or 5% by the 8th week were advanced to the next lower caloric level if no other reasons for slow weight loss were identified. At 6 weeks, participants were provided with alternative menus for breakfast and lunch, which were equivalent in caloric content and composition to the DSMRs. Participants were given the option to either continue to use DSMRs or natural food for breakfast and lunch.
Exercise intervention
After evaluation of exercise history and possible barriers to exercise, an individualized exercise plan was designed by the program EPs based on each participant's health status and exercise capacity. The intensity level of exercise was set above the minimum required to improve participant's current exercise capacity, but below a level that might evoke abnormal clinical symptoms. Exercise intervention included a balanced mix of aerobic exercise (cross and interval training) to promote development and maintenance of cardiovascular health; resistance exercise (circuit and superset training) to enhance muscular strength and endurance and improve performance of daily living; core stability training to improve lower back function and flexibility exercise (stretching) to enhance functional capabilities and reduce risk of injury. The exercise plan included a weekly 60 min exercise session under supervision of EPs. In addition, each participant was given an individualized exercise plan to perform independently at home. Participants were instructed to progress gradually over 12 weeks from 20 min (continuous or intermittent), 4 days/week to 60 min 5–6 days/week. On completion of the initial 12 weeks, participants were encouraged to continue to exercise independently for 60 min/day, 5–6 days/week and maintain ≥300 min/week with focus on 2–3 days/week of total body resistance training to preserve muscle mass.
Cognitive–behavioral intervention
Group behavioral support sessions were conducted during the initial 12 weeks of intervention and were led by a clinical psychologist or a social worker. Sessions incorporated key components of cognitive–behavioral therapy validated for weight management in other clinical trials.17 ,18 These components included self-monitoring of eating and exercise, behavioral goal setting, stimulus control techniques, cognitive restructuring, assertive communication skills, stress management and relapse prevention.17 ,18
Group education
Group didactic sessions were conducted during the initial 12 weeks. Topics discussed in each weekly 60 min session were relevant to weight management and/or diabetes. Educational sessions were conducted by the program's EPs and RDs. At the end of each session, participants were provided with handouts as reminders.
Monthly support session
After completion of the 12-week program, participants were encouraged to attend monthly support sessions designed to provide behavioral support and to motivate them to maintain weight loss. No measurements were taken during these sessions as we previously discovered that measuring weight during these monthly sessions was discouraging participants from coming. Although compliance in attending the 12-week program was high (93% attended all sessions with no difference between the two groups), attendance of the monthly support sessions was very poor. No more than 10% of participants in each group attended more than 6 sessions/year with no difference between groups. Poor attendance was primarily related to the clinic location and the expensive parking.
Statistical methods
All tests of group differences were based on the intent-to-treat principle using all available data. Since clinic visits during the follow-up period was not rigorously scheduled every 3 months, an approximation of each visit time to the nearest 3-month timeline was used. There was no evidence that missing data were dependent on the study group. We examined the group differences at each time point across the 5 years to illustrate the time course of the changes. The mixed-effects maximum likelihood and generalized estimating equation analysis of repeated outcomes were performed using the SPSS Statistics software, V.22 (International Business Machines Corporation, Armonk, New York, USA) using an α level of 0.05. An unstructured covariance matrix was used to account for correlation between repeated outcomes. Data are expressed as mean (SD). Changes in outcome measures from baseline to 5 years were compared using ANCOVA and Mantel-Haenszel tests.
Results
Group A included 61 patients (47.3%) and group B included 68 patients (52.7%). Both groups were equally distributed within the 12 Why WAIT programs conducted over 3 years. At baseline, there were no differences between the two groups in any of the cardiovascular risk factors (A1C, BP, lipid profile) or in indicators of renal function (serum creatinine, BUN and urinary microalbumin/creatinine ratio). Group B was significantly heavier with a BMI of 39.3±5.1 vs group A with a BMI of 37.3±5.2 kg/m2 and consequently had significantly higher waist circumference, higher fat mass and higher fat free mass (table 1).
Baseline characteristics of the participants in the real-world intensive lifestyle intervention
Taken together, all participants lost an average of 23.8±10.1 lbs (−9.7±3.6%, p<0.001) after 12 weeks and their weight decreased from an average of 238.6±40.8 lbs to 216.9±37.8 lbs. Their mean weight lost after 1 year was 20.1±19.2 lbs (−8.1±7.5%, p<0.001) and continued to be statistically lower than baseline for the following 5 years. After 5 years, the average weight loss was 16.2±19.5 lbs (−6.4±7.7%, p<0.001) (figure 2). The large SD reflects the wide variability between those who regained weight and those who sustained weight loss over 5 years.

Percentage of weight loss over 5 years in response to 12-week intensive lifestyle intervention in a real-world clinical practice. All participants N=129. Group A, n=61 (participants maintained <7% weight loss at 1 year). Group B, n=68 (participants maintained ≥7% weight loss at 1 year). ***p<0.001 (group A vs group B).
After 12 weeks, percentage body fat, total fat mass and lean body-mass decreased significantly (p<0.001) (table 2). Lean body-mass to fat-mass ratio increased from 1.3±0.4 to 1.6±0.6 (p<0.001) indicting reasonable conservation of lean muscle mass. Loss of lean body-mass accounted for ∼18% of the total weight loss. Waist circumference decreased significantly by an average of 3.7±2.2 inches (p<0.001) with significant reduction in the waist-to-hip ratio (table 2) indicating a greater loss of abdominal fat. The estimated basal metabolic rate significantly decreased after weight reduction (table 2).
Changes in the body composition and the anthropometric parameters in all participants after 12 weeks of intensive lifestyle intervention in real-world clinical practice
After 12 weeks, group B lost an average of 29.3±9.3 lbs (−11.6±3.2%), which was significantly higher than group A, who lost an average of 17.7±7.2 lbs (−7.7±2.9%, p<0.001). At 1 year, group B maintained an average weight loss of 33.4±16.5 lbs (−13.2±6.4%), which was significantly higher than group A, who only maintained an average loss of 5.4±7.7 lbs (−2.4±3.2%, p<0.001). Weight loss maintenance in group B continued to be significantly higher than weight loss in group A over the following 5 years of follow-up (figure 2). After 5 years, group B maintained an average weight loss of 23.1±21.0 lbs (−9.0±8.1%), while group A maintained an average weight loss of 8.4±14.2 lbs (−3.5±6.0%, p<0.001). Most of the weight regain in group A occurred in the first year then their body weight stabilized. However, they did not return to baseline and their weight remained significantly lower after 5 years (p<0.001) (table 3).
Changes in metabolic and cardiovascular risk factors after 12 weeks, 1 year and 5 years of intensive lifestyle intervention in real-world clinical practice
Group B continued to lose weight after the initial 12 weeks, reached its maximal weight loss at 9 months and then gradually regained weight until stabilized at the 30th month of follow-up. Higher weight loss during intervention and weight maintenance of ≥7% weight loss at 1 year seem to be associated with the long-term maintenance of weight loss in this group.
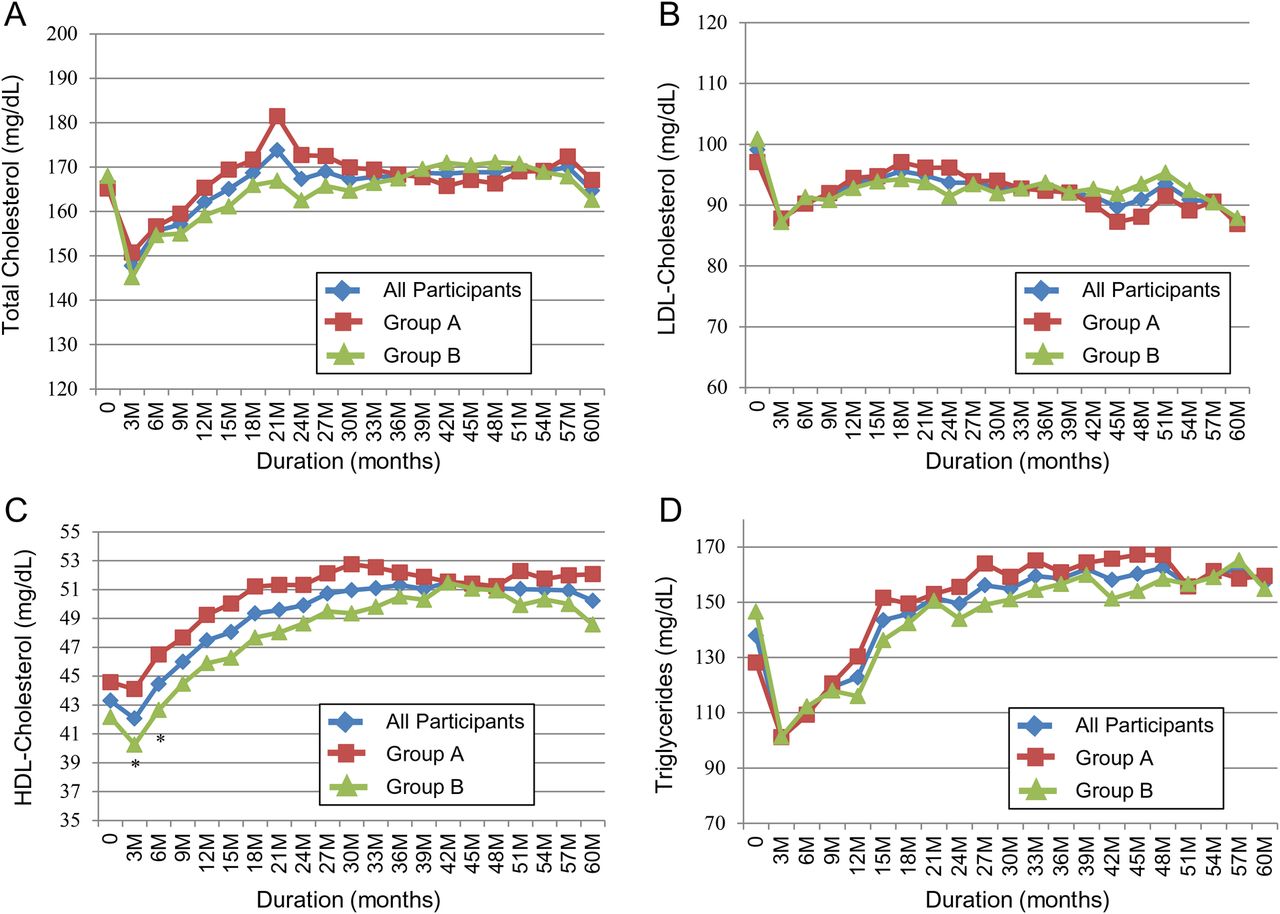
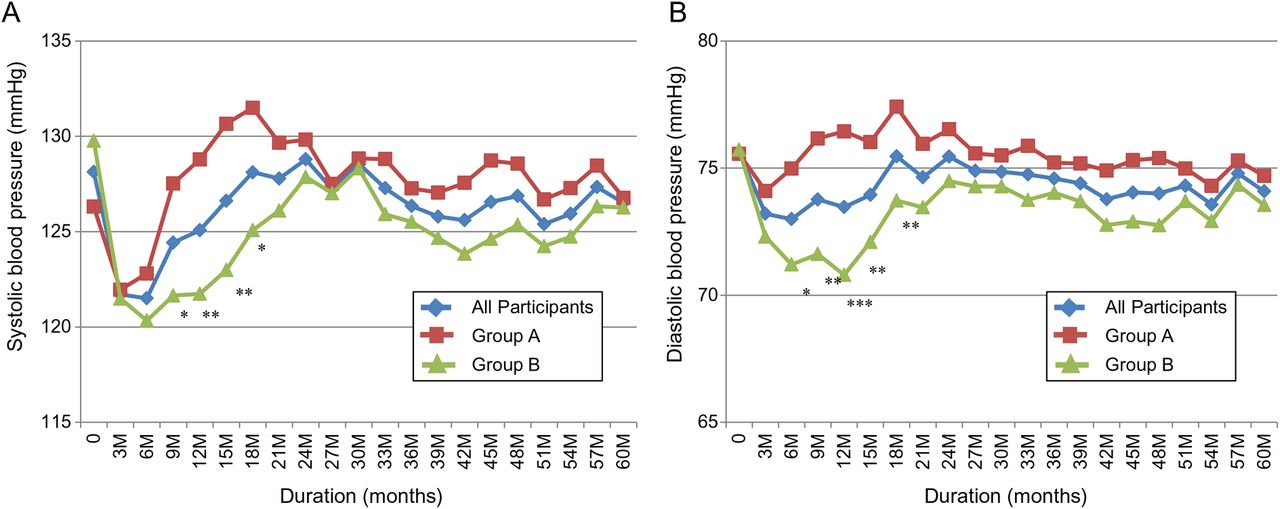
A1C and serum triglycerides rapidly returned to baseline or higher with weight regain (table 3, figures 3 and 4). Despite weight maintenance in group B, A1C gradually increased over time but remained lower than baseline for 5 years. However, the difference was no longer statistically significant at 5 years (figure 2). A1C continued to be significantly lower in group B compared to group A. On the other hand, serum triglycerides increased irrespective of the change in body weight with no difference between the two groups (figure 4). By comparison, LDL-cholesterol continued to be significantly lower from baseline and HDL-cholesterol continued to be significantly higher for 5 years with no difference between the two groups (figure 4). The improvement in systolic BP and diastolic BP disappeared quickly after weight regain in group A (figure 5). It continued to be significantly lower in group B versus group A for the first 18 months of the follow-up, then the difference between the two groups disappeared (figure 5). Systolic BP and diastolic BP remained lower than baseline with weight loss maintenance, but the difference was no longer statistically significant after 5 years (table 3).
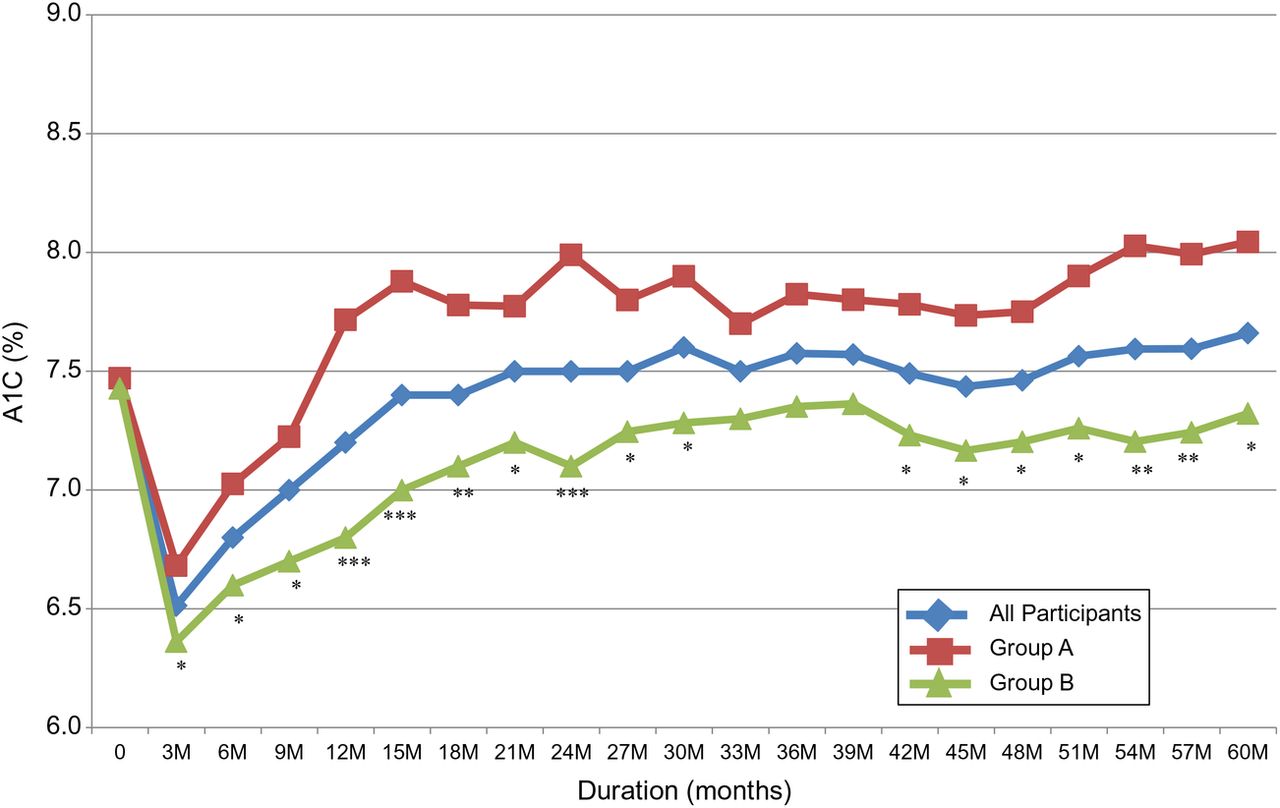
Change in %A1C over 5 years in response to 12-week intensive lifestyle intervention used in a real-world clinical practice. All participants N=129. Group A, n=61 (participants maintained <7% weight loss at 1 year). Group B, n=68 (participants maintained ≥7% weight loss at 1 year). *p<0.05, **p<0.01, ***p<0.001 (group A vs group B).

Change in (A) total cholesterol; (B) LDL-cholesterol; (C) HDL-cholesterol and (D) triglycerides over 5 years in response to 12-week intensive lifestyle intervention in a real-world clinical practice. All participants, N=129. Group A, n=61 (participants maintained <7% weight loss at 1 year). Group B, n=68 (participants maintained ≥7% weight loss at 1 year). *p<0.05 (group A vs group B).

Change in (A) systolic blood pressure and (B) diastolic blood pressure over 5 years in response to 12-week intensive lifestyle intervention in a real-world clinical practice. All participants, N=129. Group A, n=61 (participants maintained <7% weight loss at 1 year). Group B, n=68 (participants maintained ≥7% weight loss at 1 year). *p<0.05, **p<0.01, ***p<0.001 (group A vs group B).
Serum creatinine was significantly lower at 5 years compared to the baseline only in group B (p<0.05), but the significant improvement in urinary microalbumin/creatinine ratio achieved in both groups after 12 weeks diminished over time (table 3).
Average number of medications prescribed to treat cardiovascular disease (CVD) risk factors (diabetes, hypertension and dyslipidemia) was not different between the two groups at baseline or at 3 months, 1 year, or 5 years. However, these medications significantly increased at 5 years only in group A. Similarly, diabetes medications alone were not different between the two groups at any of the follow-up time points. Percentage of patients treated with insulin in group A increased from 37.7% at baseline to 50.5% at 5 years and decreased in group B from 47.1% to 44.1% at 5 years, however, these changes were not statistically significant.
Discussion
To the best of our knowledge, this is the longest follow-up study of non-surgical intensive lifestyle intervention in patients with diabetes in real-world clinical practice. It is also the first to describe the dynamic changes in cardiovascular risk factors over time in clinical practice in relation to weight maintenance versus weight regain. Weight management in real-world clinical practice usually targets broader range of patients. The exclusion criteria for this program were minimized to allow typical representation of patients with diabetes in clinical practice.
Although it is known that weight management is a major challenge for obese patients with diabetes compared to non-diabetic population, this study showed that participants were able to independently maintain 6.4% weight loss after 5 years of an initial 12-week intensive lifestyle intervention program. It also demonstrates that patients who lost and sustained ≥7% weight loss at 1 year were more likely to maintain significant weight loss after 5 years of follow-up. Approximately half of participants in this study fell into this category and were able to sustain an average weight loss of 9% after 5 years. This group also maintained a significantly lower A1C in comparison to those who regained weight. Although weight regain is generally common after significant weight loss, this study showed that body weight stabilized after 30 months of follow-up.
At 12 weeks, all cardiovascular risk factors significantly improved in both groups. However, this improvement gradually disappeared over time albeit at a slower rate in those who sustained weight loss. A1C and triglycerides were the first parameters to rapidly deteriorate with weight regain, while LDL-cholesterol and HDL-cholesterol sustained their significant improvement for 5 years irrespective of weight change over time. During the first 18 months of follow-up, BP was significantly lower in those who sustained weight loss versus those who regained weight. However, BP gradually returned back to baseline even with sustained weight loss.
After the initial and significant decrease in A1C in both groups, it slowly increased over time. This increase was slower during the first year in those who sustained weight loss and continued to be significantly lower over 5 years versus those who regained weight. Additionally, it remained significantly lower from baseline at 1 year and non-significantly lower at 5 years in those who sustained weight loss, but increased significantly to above baseline in those who regained weight. This observation indicates that glucose control is one of the quickest parameters to deteriorate with weight regain. We and others previously demonstrated a significant improvement in insulin sensitivity after short-term weight loss.3 ,19 It was postulated that the reduction in visceral fat after weight loss might account for this improvement.20 ,21 In this study, average waist circumference decreased significantly from baseline. Our results support the recent observations of the Look AHEAD study that despite maintenance of weight loss, A1C levels worsened between years 1 and 4 and remained below baseline only in those with large weight losses.9 Moreover, the study showed that those who had large initial weight loss but full regain of weight had greater improvements in A1C levels at year 4 than those with smaller or no initial weight loss.
Serum triglycerides increased quickly during follow-up. Since deterioration in serum triglycerides was also observed in those who sustained weight loss and A1C, it is possible that participants relaxed their carbohydrates restriction from ∼40% to 45% of the total daily caloric intake to a much higher percentage after the program. Despite weight regain, both groups sustained a significantly lower LDL-cholesterol and higher HDL-cholesterol at 1 year and 5 years. The reduction in saturated fat to <7%, the omission of trans fat, the increase in mono and polyunsaturated fat and the increase in dietary fiber in association with increase in physical activity and exercise beyond the commonly recommended 175 min/week might have contributed to these sustained changes. Since we did not have enough data about long-term changes in lipid-lowering medications, we cannot discount the possibility that sustained improvement in lipid profile might be related to changes in these medications or in their doses. The significant reduction in LDL-cholesterol by an average of 10.1% after 12 weeks might be particularly unique to this dietary intervention. One other trial reported similar reduction in LDL by using comparable macronutrients composition.22
The initial significant reduction in systolic BP and diastolic BP after 12 weeks was gradually lost during the long-term follow-up but they remained non-significantly lower than baseline at 5 years in both groups. In those who sustained weight loss, BP remained significantly lower than those who regained weight for the first 18 months. Renal function remained unchanged over 5 years. Initially, urinary microalbumin/creatinine ratio significantly decreased. One study showed that long-term improvement in renal function after weight reduction may be attributed to improved metabolic factors.23
In this program, average reduction in lean body-mass was only 4.8 lbs (18.7% of total weight loss), which is relatively lower than other weight reduction studies.24 ,25 This may be related to increased strength exercise and protein intake. This might reduce the magnitude of decline in basal metabolic rate, which is frequently seen after weight loss and partially contributes to rapid weight regain.
Diabetes medications were adjusted by diabetologists during the initial intervention period. The algorithm used in this program favored medications that are weight neutral or help weight loss, however, our analysis did not show any difference in the magnitude of weight loss among those who received glucagon-like peptide-1 (GLP-1) analogs versus those who did not.26 In this study, we did not see any difference in the average number of medications prescribed to treat CVD risk factors (diabetes, hypertension and dyslipidemia) at any intervention point between the two groups. However, patients in group A had a significant increase in medications used to treat CVD risk factors at 5 years. Similarly, diabetes medications alone were not different between the two groups at any of the follow-up points, but percentage of patients treated with insulin increased in group A and decreased in group B. This observation indicates a possible delay in adding insulin to those who maintained long-term weight loss.
The cost-effectiveness and the long-term impact of this type of intervention on health-economics of diabetes were not directly calculated in this study. However, a health-economic study showed that 1% weight loss is translated into US$256 or 3.6% saving on total healthcare cost per year and US$131 or 5.8%% saving on diabetes-related cost.27 These numbers are projected to around 27% saving on the total healthcare cost and 44% saving on diabetes-related cost for patient lost and maintained 7% weight loss. Look AHEAD study also showed significant saving on diabetes-related cost, especially cost of medications.9
Since all participants were treated by physicians from the same clinic, regular follow-up in real-world clinical practice was possible every 3–6 months. However, one weakness of this analysis is that 37 participants did not complete their follow-up at different intervals after the first year. The exact reasons for their failure to follow-up were not clear. There was no indication that loss to follow-up occurred in one group more than the other.
Several limitations should be also considered when interpreting the results of this study. One of them is the absence of a comparative control group due to the nature of conducting this model in real-world clinical practice. Since our primary aim was to compare sustained weight loss versus weight regain, addition of a parallel or a historical control group was to add little additional value. It is also important to notice that many of the measured parameters are surrogate markers of cardiovascular risk and may not reflect or suggest actual improvement in cardiovascular outcomes. While the achieved weight reduction was maintained for 5 years, longer follow-up is recommended. A systematic review of 11 long-term studies with a follow-up of more than 2 years showed that mortality risk was reduced by 25% in patients with diabetes who intentionally lost a significant amount of weight.28 Furthermore, this study was conducted at a single tertiary care center, which has facilities and resources not necessarily available at other clinical practices or in primary care settings. Future application of this practice model at other practices may require further adaptation and resources. We also faced several challenges in conducting this study in a real-world clinical practice. For example, participants were followed after the program by >20 different providers at Joslin clinic. It was impossible to control for medications change, which were left to the discretion of the providers. It was also difficult for us to know if the two groups had been treated differently after the initial 12 weeks. Having these information were to strengthen this study.
In general, long-term effects of weight reduction on cardiovascular risk factors vary significantly according to the sustainability of weight loss. Although most of the initially observed benefits gradually disappear over time, their disappearance occurs slower in those who sustain weight loss. A1C and triglycerides are the first parameters to rapidly deteriorate with weight regain while the improvement in LDL-cholesterol and HDL-cholesterol continues for long duration even with weight regain. BP rebounds slowly over the first 18 months of follow-up. The rate of its rebound is significantly slower in those who sustain weight loss.
In conclusion, application of intensive diabetes weight management in real-world clinical practice through a structured multidisciplinary program is feasible. The initial significant improvement in several cardiovascular risk factors is lost over time but at much slower pace in those who sustain weight loss. Weight regain is associated with rapid deterioration in A1C and serum triglycerides, but the significant improvement in LDL-cholesterol and HDL-cholesterol may continue for 5 years.
Acknowledgments
Why WAIT program received unrestricted grant from Novartis Nutrition and LifeScan. Both companies were not involved in design, conduct, data collection, management, analysis, interpretation of results, preparation of manuscript or approval of this study. We are grateful to Cathy Carver, NP, and Jo-Anne Rizzotto, RDN, LDN, CDE, for their substantial administrative support and to Joan Beaton for her efforts in coordinating the Why WAIT program. Martin Abrahamson, MD; Voula Mentzelopoulos, MD; Joanna Mitri, MD; Mohamed Shihab-Eldin, MD; Ahmed Elshebiny, MD; Roberta Capelson, NP; Rebecca Longo, ACNP; Iris Marquis, NP; Elisha Phelan, NP; Cara Kilroy, NP; Jeffrey Richard, RCEP; Michael See, RCEP; Sue-Ellen Anderson-Haynes, RD; Veronica Salsberg, RD; Andrea Penney, RN, CDE; Stacey O'Donnell, RN, CDE; Pamela Needle, RN, CDE; Laura Schwab, RN, CDE; and Erin Kelly, RN, CDE, from the Joslin Diabetes Center in Boston actively contributed to the Why WAIT program at different time periods but were not involved in this study.
References
Footnotes
Contributors OH and AM have full access to all of the data in the study and take responsibility for the integrity of the data and the accuracy of the data analysis. OH directs the Why WAIT program, designed the medication algorithm used in the study, prepared the manuscript and did the data analysis. AdM collected study data and reviewed and edited the manuscript. AmM collected study data and measured the body composition. AG-F designed and conducted the behavioral intervention portion of the program and reviewed and edited the manuscript. NE-S reviewed and edited the manuscript. GA designed the dietary intervention and with AK conducted the dietary counseling and intervention. JS designed and conducted the exercise intervention. JZ conducted the behavioral intervention, reviewed and edited the manuscript.
Competing interests OH receives research support from Neurometrix and Metagenics and consults to Merck Pharmaceutical and Abbott Nutrition. None of the authors’ financial interests are related or influenced this study. Other authors do not have any competing interests to disclose.
Ethics approval The Joslin Diabetes Center, Committee on Human Studies.
Provenance and peer review Not commissioned; externally peer reviewed.
Data sharing statement No additional data are available.