Article Text

Abstract
Objective It is not clear which phase of insulin secretion is more important to regulate lipoprotein lipase (LPL) activity. After a meal, insulin is released and acts as a major regulator of LPL activity. Postprandial hyperlipidemia is a common comorbidity in subjects with insulin resistance (IR). Therefore this study aimed to evaluate the role of the first-phase insulin secretion (FPIS) on postprandial lipidemia in subjects with IR and impaired glucose tolerance (IGT).
Research design and methods This is a cross-sectional, observational and comparative study. We included male and female subjects between 40 and 60 years with a body mass index (BMI) between 23 and 30 kg/m2. Then, patients were divided into three groups. Group 1 consisted of control subjects with normal glucose tolerance and preserved FPIS. Group 2 included patients with IGT and a reduced FPIS. Group 3 consisted of subjects with IGT but normal FPIS. Both groups were paired by age and BMI with subjects in the control group. Subjects underwent an intravenous glucose tolerance test to classify each case, and then a load with a mixed meal load to measure postprandial lipidemia.
Results A total of 32 subjects were evaluated: 10 were control subjects, 8 subjects with IGT with a reduced FPIS and 14 subjects with IGT and preserved FPIS. After administration of a standardized meal, group 2 showed a greater glucose area under the curve (AUC) at 30 and 120 min (p=0.001, for both). This group also showed a statistically significant increase (p<0.001) in triglyceride AUC.
Conclusions A reduced FPIS is significantly and independently associated with a larger postprandial hyperlipidemia in subjects with IGT.
- fist-phase insulin secretion
- postprandial lipidemia
This is an Open Access article distributed in accordance with the Creative Commons Attribution Non Commercial (CC BY-NC 4.0) license, which permits others to distribute, remix, adapt, build upon this work non-commercially, and license their derivative works on different terms, provided the original work is properly cited and the use is non-commercial. See: http://creativecommons.org/licenses/by-nc/4.0/
Statistics from Altmetric.com
Key messages
What is already known about this subject?
After a meal, insulin is released and acts as a major regulator of lipoprotein lipase activity. Postprandial hyperlipidemia is a good marker of accelerated atherosclerosis in patients with insulin resistance
What are the new findings?
A reduced first-phase insulin secretion (FPIS) is both significantly and independently associated with a greater postprandial hyperlipidemia in subjects with impaired glucose tolerance (IGT).
How might these results change the focus of research or clinical practice?
Novel treatment approaches focusing on restoring FPIS in patients with IGT could diminish type 2 diabetes mellitus progression and might reduce cardiovascular risk.
Introduction
The metabolic syndrome and type 2 diabetes mellitus (T2DM) are characterized by increased plasma triglycerides (TG), reduced high-density lipoprotein cholesterol (HDL-C), and increased numbers of small, dense low-density lipoprotein (sdLDL) particles.1 Such lipoproteins are prone to be oxidized and transformed into oxidized-LDL (ox-LDL), predisposing to atherosclerosis and cardiovascular disease.2 Also, apolipoprotein B48 and apolipoprotein B100 have a delay in postprandial clearance, contributing to atherosclerosis.3 4 In patients with insulin resistance (IR), such apolipoproteins and lipid parameters are useful markers for clinical atherosclerosis.5
In healthy subjects, the first-phase insulin secretion (FPIS) plays a key role in glucose homeostasis,6 inhibiting hepatic glucose production and postprandial hyperglycemia.7 In addition, insulin plays a key role in postprandial lipidemia. Clinical studies after a high-fat meal have shown important increment in TG-rich lipoproteins originated from the intestine (chylomicrons) and liver (very-low density, lipoproteins, VLDL). Then, chylomicrons and VLDL are hydrolyzed by lipoprotein lipase (LPL), an endothelial enzyme localized in capillary-rich tissues such as skeletal muscle, adipose tissue and liver.8 After a meal, insulin is released and acts as a major regulator of LPL activity.9 In addition, insulin and glucocorticoids increase LPL gene expression and transmembrane transport.10 Therefore, insulin is a key regulator of LPL under physiological conditions. However, further mechanisms are still under study. For example, it is not clear which insulin secretion phase is more important for LPL activity regulation, and if such mechanisms may be affected because of an IR environment. After glucose intravenous administration, insulin is released in two phases. FPIS is during first 10–15 min and is due to the release of the already synthesized insulin stored in vesicles inside beta cells. The second phase of insulin secretion starts after 25–35 min of the glucose intravenous bolus, and is a consequence of the de novo insulin synthesis and release in response to hyperglycemia. In the context of IR, LPL activity is decreased, causing delayed clearance of TG-rich lipoproteins and accelerating atherosclerosis.11 Another action of insulin is the inhibition of lipolysis in adipose tissue.12 In patients with IR, lipolysis from adipose tissue is increased with a higher supply of free fatty acids (FFAs) to the circulation, which are considered the most important substrate for TG in the liver.13 The consequences are higher TG-rich VLDL synthesis and secretion from liver to circulation.14 15 Then, LPL catalyzes the transformation of TG-rich VLDL into sdLDL,16 promoting atherosclerosis.17 18
Currently, postprandial hyperlipidemia is a good marker of accelerated atherosclerosis in patients with IR.19 However the role of FPIS on postprandial lipidemia pathophysiology is presently unclear; therefore, this study aimed to evaluate the role of FPIS on postprandial lipidemia after a standardized meal load in subjects with IR and impaired glucose tolerance (IGT).
Research design and methods
This is a cross-sectional, observational and comparative study. We included male and female subjects between 40 and 60 years with a body mass index (BMI) between 23 and 30 kg/m2. Then, patients were divided into three groups. Group 1 consisted of control subjects with normal glucose tolerance, as defined by the American Diabetes Association criteria,20 and preserved FPIS (group 1=healthy). Group 2 included patients with IGT and a reduced FPIS (group 2=IGT+reduced FPIS). IGT was defined using glucose concentration between ≥140 mg/dL and <200 mg/dL after 2 hours of a 75 g oral glucose load.20 Reduced FPIS was defined using a standardized test, which requires calculation of the insulin area under the curve (AUC) after the intravenous glucose bolus administration of 0.3 g/kg of body weight. Then, glucose and insulin concentration are measured during the following 2 hours after infusion starts. FPIS was evaluated with blood samples every 5 min during the first half an hour. Afterwards, the second phase of insulin secretion was evaluated measuring insulin concentration every 10 minutes until the test ends. Normally, during the first 15 minutes of the test, an insulin peak is identified representing the FPIS.21 The AUC of this peak is calculated and usually takes one-third of the complete insulin AUC. Therefore, the other two-thirds of insulin AUC correspond to the second phase of insulin secretion, starting approximately after 25–35 min after glucose bolus and lasting 2 hours on average.22 Using this procedure, FPIS was considered reduced when the insulin AUC was lower than 20% of the expected results in control subjects paired by age and BMI. Finally, group 3 consisted of subjects with IGT but normal FPIS; this group was also paired by age and BMI with the control group (group 3=IGT+preserved FPIS). We excluded cases who were taking drugs that potentially can alter the metabolism of carbohydrates or lipids in the last 3 months before the onset of the study, such as oral hypoglycemic agents, fibrates, statins, estrogens, nicotinic acid, steroids, diuretics, beta blockers, and antidepressant or antipsychotic drugs. We also excluded individuals who had a weight loss greater than 3 kg in the last 3 months before the study, a chronic disease that required immobilization in bed, heart, liver or kidney failures, previous myocardial ischemia, primary dyslipidemias, T2DM, other types of diabetes, primary hypothyroidism, infertile women, menstrual irregularities, amenorrhea, and polycystic ovary syndrome. The study was approved by our Institutional Human Biomedical Research Committee (reference #1092). Written and informed consent was obtained from all subjects before starting the study. All clinical investigation was conducted according to the principles stated on the Declaration of Helsinki.
Procedures
Subjects underwent a complete medical history, physical examination and biochemical evaluation to confirmed selection criteria. After individuals were accepted to participate, they were scheduled for first visit after 10–12 hour fasting in order to perform intravenous glucose tolerance test and cluster each case.
Intravenous glucose infusion test
After 10 min rest in a comfortable armchair, two peripheral intravenous lines were inserted in every patient, one in each arm. An intravenous bolus glucose load was administered at a dose of 0.3 g/kg. Then, blood samples were taken every 5 min during the first half an hour, and then every 10 min during the following 90 min. Subjects were clustered according to the FPIS as described above.
Test with a mixed meal
During the second visit, after fasting for 10–12 hours, participants underwent a standardized mixed meal load test using Sustacal. This meal load provided 240 calories, 5.5 g fat, 33 g carbohydrate and 145 g of protein. The subjects were instructed to consume the meal in less than 10 min. Blood samples of 5 mL each were obtained at 0, 10, 30, 60, 120, 180, 240 and 480 min after finishing the meal load.
Subjects with IGT and reduced FPIS were instructed to attend a third visit to receive again a meal load in addition to an intravenous insulin bolus of 0.15 U/kg aimed to emulate correction of FPIS.
The function of beta cells were estimated with the percentage of insulin secretion by β cells (%B) and insulin sensitivity (%S) using homeostasis model assessment with HOMA2 calculator provided in the web page.23
Laboratory analysis
All samples were analyzed at the Department of Endocrinology and Metabolism laboratory from the Instituto Nacional de Ciencias Médicas y Nutrición Salvador Zubirán, a non-profit university-affiliated institution. Glucose, total cholesterol, TG and HDL-C concentration were measured by an automated enzymatic method (Beckman Synchron CX). Insulin values were assessed with a microparticle enzyme immunoassay (MEIA System, Axsym Abbott). FFAs were measured by a colorimetric method (Wako). The alpha-amino nitrogen molecule was measured using an enzymatic colorimetric method developed in our laboratory.
Statistical analysis
Normality of variables were analyzed using Kolmogorov-Smirnov test. According to the distribution of variables, they were expressed as mean and SD or median and IQR for variables with normal or biased distribution, respectively. The AUC was calculated according to the trapezoid method using a Microsoft Excel software, which was uploaded as an online supplementary data. Comparison between the three groups was made with one-way analysis of variance for parametric variables and Kruskal-Wallis for non-parametric ones. Correlation coefficients using Pearson or Spearman analysis, as needed, were used to evaluate FPIS with clinical and biochemical parameters. Multiple linear regression models were developed to identify independent factors associated with the postprandial lipidemia. All reported p values are based on two-sided tests considering ≤0.05 as significant. All analyses were performed with SPSS V.17.0.
Results
Total sample size included 32 subjects. Healthy group 1 consisted of 10 individuals, group 2 included 8 cases with IGT and reduced FPIS, and group 3 included 14 subjects with IGT and preserved FPIS. The baseline characteristics of each group are shown in table 1. The postprandial values are shown in table 2. According to each group selection criteria, group with IGT+reduced FPIS showed greater AUC of glucose coexisting with lower AUC of insulin at 0–10 or 0–30 min, confirming the reduction of FPIS, in comparison with healthy or IGT+preserved FPIS groups (table 1). Also, IGT+reduced FPIS group had lower HOMA2 steady-state beta cell function (%B) than healthy and IGT+preserved FPIS groups (p=0.02).
Baseline characteristics of the subjects studied
Postprandial values of the subjects studied
After administration of a standardized meal (Sustacal), IGT+reduced FPIS group showed greater postprandial hyperglycemia and hypertriglyceridemia measured by AUC 0–120 and 0–480 min, respectively (p=0.001, figure 1). FFA AUC 120’ and alpha amino nitrogen AUC 120’ showed no significant differences between groups (FFA group 1: 40.7 mmoL/L/min (32.1–57.1) vs IGT+reduced FPIS: 42.75 mmoL/L/min (38.1–72.9) vs IGT+preserved FPIS group: 49.7 mmoL/L/min (31.0–57.2), p=0.60; and alpha amino nitrogen, healthy group: 126.9 mmoL/L/min (108.7–700.8) vs IGT+reduced FPIS group: 121.6 mmoL/L/min (100.0–205.7) vs IGT+preserved FPIS group: 151.0 (131.7–178.4), p=0.44).
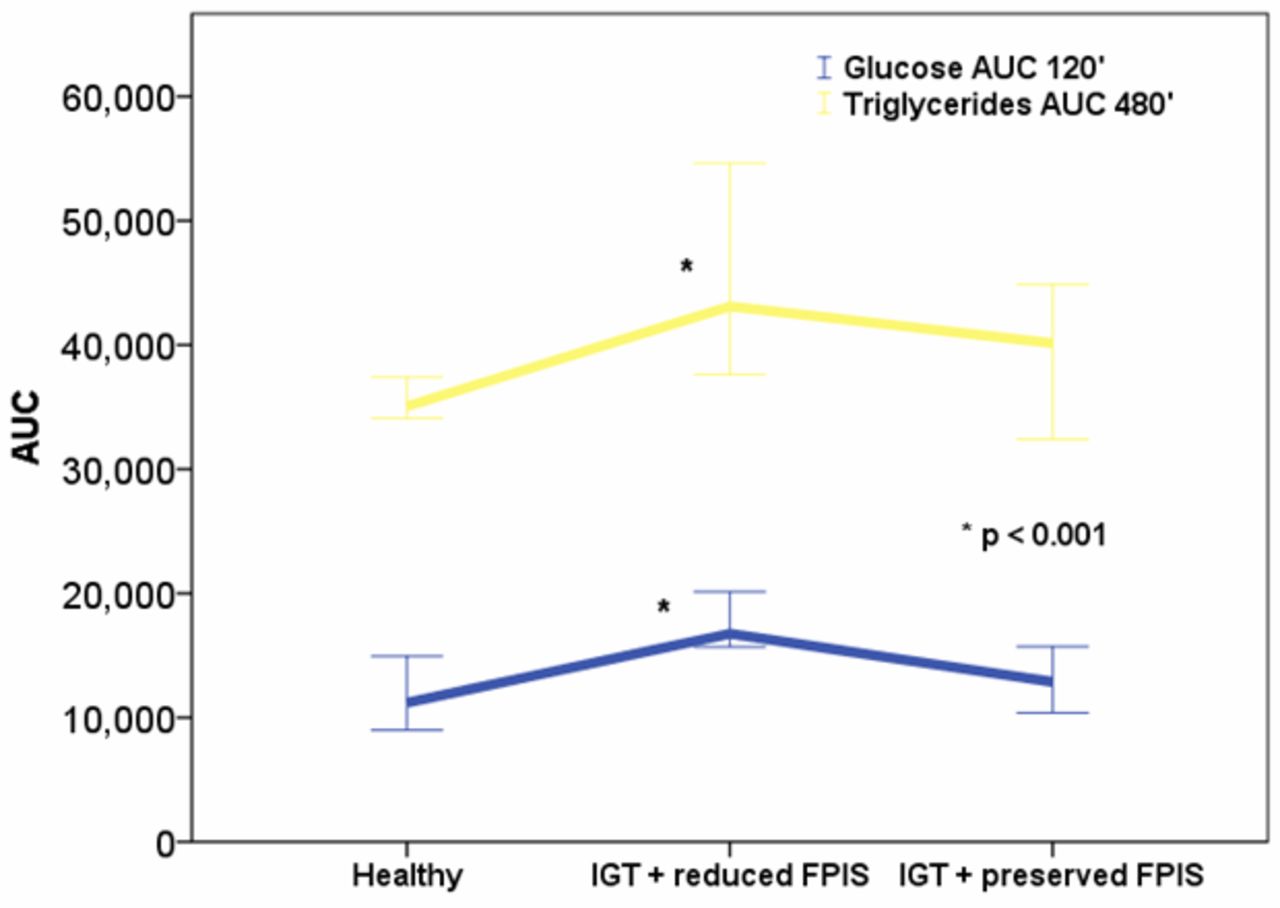
Glucose AUC 120’ and triglycerides AUC 480’ in the three groups studied. AUC, area under the curve.
IGT+reduced FPIS group was then tested again with the meal load but now receiving intravenous insulin in order to restitute FPIS. Interestingly, postprandial TG (AUC 480’) showed no further significant difference compared with IGT+preserved FPIS group: (45 305 mg/dL/min (39 456–49407), and 40 140 mg/dL/min (35 255–44693), respectively, p=0.18, figure 2).

Comparison of triglycerides AUC 480’ between IGT+reduced FPIS group, IGT+preserved FPIS group, and IGT+reduced FPIS+reduced FPIS and FPIS restitution with intravenous insulin. After insulin infusion and FPIS restitution, postprandial lipidemia is corrected and no significant difference between the three groups was found. AUC, area under the curve; FPIS, first-phase insulin secretion; IGT, impaired glucose tolerance.
Correlation analyses were made between the FPIS (insulin AUC 10’ after administration of an intravenous glucose load), with the postprandial lipidemia expressed as fatty acid and TG AUC after the meal load with Sustacal. When all cases were analyzed, we found a statistically significant positive correlation between insulin AUC 10’ with fatty acid AUC 480’ (p=0.35, p=0.04). There was a significant negative correlation between TG AUC 480’ (p=−0.42, p=0.01) and FPIS (insulin AUC 10’). These results are summarized in table 3.
Correlation between the first-phase of insulin secretion and postprandial lipidemia in all subjects studied (n=32)
Regarding second-phase insulin secretion, we found statistically significant correlations with TG AUC when all subjects were analyzed and in the group with subjects with IGT+reduced FPIS (p=0.62, p <0.001, and p=0.95, p <0.001), respectively. We did not find any significant correlation between second-phase insulin secretion and FFA AUC.
Table 4 depicts the linear regression analysis of variables associated with postprandial lipidemia. Gender (male) and FPIS (insulin AUC 10’) were independently associated with the TG AUC 480’ (β=0.44, and β=−0.50, respectively, both p≤0.001)
Multiple linear regression analysis in order to identify independent parameters associated with increment of postprandial triglycerides (AUC TG 480’)
Conclusions
Postprandial hyperlipidemia occurs in subjects with T2DM and contributes to the progression of atherosclerosis, especially those with IR and compensatory hyperinsulinemia.24 Therefore, it was worthy to investigate the mechanisms related to an abnormal increase in postprandial lipids. In this study, we confirmed that a reduced FPIS is significantly and independently associated with greater postprandial hyperlipidemia in subjects with IGT. In addition to FPIS, male gender was an independent factor in determining postprandial lipids elevation.
Subjects with IGT have an increased cardiovascular risk, attributable to a higher and a more prolonged increase in chylomicrons concentration and their remnants, which are more prone to be transformed into large buoyant VLDL (VLDL1 and VLDL2) in the liver. VLDL are then converted into the highly atherogenic sdLDL.25 Elevated TG concentration or TG-rich lipoprotein remnants are currently considered a coronary artery disease risk factor too.26 Similarly, sdLDL are susceptible to cross the subendothelial space and then get thoroughly oxidized.27 The resulting ox-LDL are also very atherogenic lipoproteins.28 The high TG and low HDL-C ratio has been correlated strongly with LDL particle size.29 After an acute coronary syndrome, this ratio is also an independent predictor of cardiovascular events and all-cause mortality.30 Because FPIS was significantly correlated with postprandial lipidemia in our study, it is important to evaluate future association with heart comorbidities and mortality.
In subjects with IGT, adipose insulin resistance is characterized by excessive increase in lipolysis that produces an increase in plasma FFAs despite hyperinsulinemia.31–34 Elevated circulating FFAs and intracellular lipid accumulation appear to inhibit insulin signaling. The final result is a reduced glucose influx in muscle cells because of less GLUT4 translocation to cell membrane.35 36 In subjects with obesity and increased visceral fat, this metabolic disturbance is more severe37 and has been related to T2DM pathogenesis.38
Insulin resistance alters the ability of insulin to activate LPL.39 Lipid infusion without heparin (which enhances LPL activity) in non-diabetic subjects revealed that FPIS and the second insulin secretion phase are affected. Interestingly, this was particularly evident in those with a family history of T2DM.31 It has been shown that FFAs cause beta cell lipotoxic dysregulation and impaired synthesis and secretion of insulin.32 Studies in humans have shown that beta-cell function and insulin sensitivity improve progressively in the postprandial period as the proportion of monounsaturated fatty acids with respect to saturated fatty acids in dietary fats increases.40 Also, saturated FFAs induce the p66(Shc) redox adaptor protein, which mediate lipotoxicity-induced apoptosis in pancreatic β cells.41
Initially, beta cells compensate increasing insulin release. However, chronic elevation of FFA decreases expression of insulin gene,42 and also the gene expression of carnitine palmitoyltransferase-1, acetyl-CoA carboxylase, acyl-CoA oxidase and uncoupling protein 2 (UCP2) are downregulated.43 The final result is depletion of stored insulin in beta cells, reduction of its acute secretion and a reduction on FPIS. Also, these findings suggest a more important role of LPL deficit than an increased de novo lipogenesis as the explanation of higher postprandial lipidemia. As it is shown in our study, FPIS is a measurable condition that should be evaluated, as it has been correlated with beta cell function and T2DM risk.
Our study confirms the finding that men have a higher postprandial TG-rich lipoprotein response compared with women.44
This finding needs to be confirmed in further prospective studies.
One study in overweight Individuals who received supplemented soluble dietary fiber demonstrated an improvement on FPIS, increasing insulin sensitivity.45 In another study, reductions in dietary carbohydrate without reducing energy intake decreased postprandial lipidemia. Moderate-high intensity aerobic and resistance exercising produces consistent reductions in postprandial lipidemia too, when performed 30 min to 20 hours prior to mixed or high-fat meals.46 In a study performed in rats with T2DM-like (Otsuka Long-Evans Tokushima Fatty Rats) with visceral obesity, the administration of nateglinide improved FPIS, resulting in lower TG, chylomicron, VLDL concentration after fat loading and increased LPL mRNA expression in adipose tissue.47 This was not observed in subjects at risk for T2DM.48 In 20 subjects with diabetes who received 90 mg of nateglinide before an oral fat tolerance test, lower postprandial TG and remnant-like cholesterol particles were observed, confirming that early insulin secretion following nateglinide administration inhibited postprandial hyperlipidemia. Taking together, FPIS appears to play a major role in postprandial lipids, risk for future T2DM and worst cardiovascular outcomes.49 Regarding postprandial glycemia, one study showed that FPIS has limited impact on postprandial glycemia in subjects with T2DM,50 but other found that FPIS is a significant predictor of the increase in postprandial blood glucose in patients with T2DM in near normal metabolic control.51
Some limitations must be recognized in our study. First is the relative small sample size in each group. However, this sample size was sufficient to identify statistical differences. Second, we didn’t measure the postheparinic LPL activity. Third, the intravenous insulin dose administered to simulate FPIS is an indirect surrogate that may not reflect the exact same action of endogenous insulin on portal circulation. Lastly, the method to measure FPIS in our study and other studies (insulin AUC 10’) usually shows high coefficients of variation.52
We can conclude that a preserved FPIS is associated with lower postprandial TG concentration. Further studies are needed to address the question if a better LPL activity can be a potential pharmacological target to improve postprandial lipidemia. Postprandial lipidemia is higher and more prolonged when FPIS is lost. These data are relevant to human health because novel treatments focusing on restoring FPIS in patients with IGT could diminish T2DM complications and might reduce cardiovascular risk.
Acknowledgments
MAGS would like to acknowledge Luz del Carmen Abascal-Olascoaga for her support.
References
Footnotes
Contributors The authors’ responsibilities were as follows—FJGP: designed the research; MAGS, DCR, MGG, MEM, ALE, LEGP and FJGP: conducted the research; ALE, LEGP and GLC: made the laboratory analysis; MAGS, DCR, MGG, MEM and FJGP: performed the statistical analyses; MAGS, DCR, MGG, MEM, ALE, LEGP and FJGP: wrote the manuscript; all authors: read and approved the final manuscript.
Funding The study was funded by the Department of Endocrinology and Metabolism of the Instituto Nacional de Ciencias Médicas y Nutrición Salvador Zubirán.
Competing interests None declared.
Patient consent The study was approved by our Institutional Human Biomedical Research Committee (reference #1092). Written and informed consent was obtained from all subjects before starting the study. All clinical investigation was conducted according to the principles stated on the Declaration of Helsinki.
Ethics approval Institutional Human Biomedical Research Committee.
Provenance and peer review Not commissioned; externally peer reviewed.
Data sharing statement All authors agreed to provide additional information for further meta-analysis, including the SPSS database.