Article Text

Abstract
Objective Youth onset type 2 diabetes mellitus (YT2DM) is a globally rising phenomenon with substantial Asians representation. The understanding of its pathophysiology is derived largely from studies in the obese African-American and Caucasian populations, while studies on incretin effect are scarce. We examined the insulin resistance, β-cell function (BC), glucagon-like peptide (GLP)-1 hormone and incretin effect in Asian YT2DM.
Research design and methods This case–control study recruited 25 Asian YT2DM and 15 healthy controls, matched for gender, ethnicity and body mass index. Serum glucose, insulin, C peptide and GLP-1 were sampled during 2-hour oral glucose tolerance tests (OGTTs) and 1-hour intravenous glucose tolerance tests (IVGTTs). Insulin sensitivity was derived from the Quantitative Insulin Sensitivity Check Index (QUICKI), Oral Glucose Insulin Sensitivity Index (OGIS) in OGTT and surrogate index of SI from the minimal model (calculated SI, CSI). Acute insulin response (AIR) was obtained from IVGTT. Total BC was computed as incremental area under the curve of insulin/incremental area under the curve of glucose, during OGTT (BCOG) and IVGTT (BCIV), respectively. Disposition index (DI) was calculated using the product of insulin sensitivity and insulin secretion. GLP-1 response to oral glucose was calculated as incremental area under the curve of GLP-1 (ΔAUCGLP-1). Per cent incretin effect was estimated as 100×(BCOG−BCIV)/BCOG).
Results The YT2DM had marked impairment in BC (>80% reduction in AIR and BCOG, p<0.001) and lower QUICKI (p<0.001), OGIS (p<0.001) and CSI (p=0.015) compared with controls. There was no difference in GLP-1 at all time points and ΔAUCGLP-1 but the per cent incretin effect was reduced in the YT2DM compared with controls (12.1±8.93 vs 70.0±4.03, p<0.001).
Conclusions Asian YT2DM showed similar GLP-1 response to oral glucose as controls but reduced incretin effect, BC and insulin sensitivity. The lack of compensatory mechanisms, as shown by the DI may be partly ascribed to the impaired incretin effect, similar to that of adult T2DM.
Trial registration number NMRR-12-1042-13254.
- Youth
- Type 2 Diabetes
- Beta Cell Function
- Incretin Physiology
This is an Open Access article distributed in accordance with the Creative Commons Attribution Non Commercial (CC BY-NC 4.0) license, which permits others to distribute, remix, adapt, build upon this work non-commercially, and license their derivative works on different terms, provided the original work is properly cited and the use is non-commercial. See: http://creativecommons.org/licenses/by-nc/4.0/
Statistics from Altmetric.com
Significance of this study
What is already known about this subject?
Youth onset type 2 diabetes mellitus (YT2DM) is characterised by obesity, insulin resistance and β-cell impairment.
What are the new findings?
In this study, the Asian YT2DM have preserved glucagon-like peptide (GLP)-1 response to oral glucose but decreased incretin effect, β-cell function and insulin sensitivity.
How might these results change the focus of research or clinical practice?
Further clinical studies in YT2DM are needed to establish the possibility of ‘GLP-1 resistance’ and if incretin-based therapy can benefit glycemic control in YT2DM.
Introduction
Type 2 diabetes mellitus (T2DM) among the youth is a rising phenomenon which poses a public health challenge because development and progression of clinical complications may be more rapid, and associated with greater mortality when the onset of T2DM is early.1 ,2 In the USA, up to 45% of diabetes in adolescents cases are now being attributed to T2DM.3 Adolescents of Asian descent are major contributors of pediatric T2DM.4 ,5
Studies suggest that impaired glucose tolerance and T2DM in obese youth is due to a combination of progressive and rapid deterioration of β-cell function (BC) in the presence of insulin resistance.6 ,7 However, the degree of insulin resistance and the ability of the β-cell to secrete sufficient insulin to adequately respond to the peripheral insulin resistance state appear to vary among different populations and appear to be influenced by genetic and environmental factors.1 ,8 Most studies on youth onset T2DM (YT2DM) were conducted on African-American and Caucasian obese subjects.9–11 Pathophysiological characterization studies among the Asians and studies on incretin effect among youth with T2DM are limited.
The aim of our study was the characterization of a multiethnic Asian population of youth with T2DM and control subjects with comparable gender, ethnicity and body mass index (BMI). We accomplished this characterization by (1) examining insulin resistance and BC both from oral and intravenous glucose tolerance tests (IVGTT); (2) assessing the incretin hormone (glucagon-like peptide-1, GLP-1) response during the oral test; and (3) estimating the ‘incretin effect’ by relating the differences in β-cell responses, from insulin and C peptide, between stimulation with oral and intravenous glucose.
Research design and methods
Subjects with diabetes were recruited from the specialist clinics of three referral hospitals in Malaysia (Penang, Putrajaya and Sarawak General Hospitals). They had been diagnosed and managed as T2DM based on the WHO criteria12 with either clinical features of insulin resistance or long clinical course of non-insulin dependency (ie, absence of diabetic ketoacidosis despite defaulting from insulin therapy). Controls without diabetes and without blood relation, matched for gender, ethnicity and BMI were recruited from community via word of mouth. All participants were <25 years old at the time of assessment.
The participants attended the clinical research centers on three different occasions within a 40-day period to undergo baseline assessment, CT scan for abdominal subcutaneous and visceral fat quantification, oral glucose tolerance test (OGTT) and IVGTT. All subjects underwent similar evaluation.
The study was registered at the Malaysian National Medical Research Register (NMRR 12-1042-13254) on November 29, 2012. The Malaysian Medical Research and Ethics Committee approved the study on June 28, 2013. Written informed consents were obtained from all participants. For participants younger than 18 years old, assent were obtained using a separate age appropriate assent form, alongside written consent from the minor's parents(s) or guardian(s).
Baseline history, anthropometric measurement and laboratory assessment
Baseline information included age, ethnicity, birth history and family history of diabetes, age of diagnosis, duration of diabetes and use of oral antidiabetic agents (OADs) were obtained during baseline assessment. Weight, height, BMI, waist and hip circumferences, blood pressure, presence of acanthosis nigricans and Tanner staging were documented from physical examination. Microalbuminuria was defined as microalbumin-creatinine ratio of >2.5 mg/mmol for men and >3.5 mg/mmol for women on at least two separate occasions.
Fasting venous blood samples (after an overnight fast of 10 hours) were drawn for plasma glucose, lipid profile, glycated hemoglobin (HbA1c), renal profile, liver function tests, glutamic acid decarboxylase-65 antibody (GAD65 Ab) and Islet antigen-2 antibody (IA2 Ab).
Abdominal fat quantification
Limited axial CT scan of the abdomen was performed at L4–L5 intervertebral level. The area of abdominal adipose tissue was calculated using OsiriX imaging software. Tissue with Hounsfield unit between −30 and −190 was considered as adipose tissue. Abdominal adiposity was quantified as total, subcutaneous and visceral adipose tissues.
OGTT and IVGTT
Each subject underwent OGTT and IVGTT on two separate occasions, 24–48 hours apart. For female subjects, these tests were performed during the follicular phase of menstrual cycle. On both occasions, the subjects were studied in a recumbent position after overnight (10 hours) fasting, restraining from medication and tobacco use. For the subjects with diabetes on OADs, the medications were stopped for a minimum of 5 days before any test. Short or intermediate acting insulin was started in the interim to maintain glycemic control, at the discretion of the attending endocrinologists. Subjects regularly treated with long-acting insulin were temporarily changed to short or intermediate acting insulin the night before the tests. The last dose of insulin was given at least 12 hours before the tests to avoid interference with the measurements. Subjects on OADs restarted their usual medications after completion of OGTT and IVGTT.
OGTT—Glucose, insulin and C peptide were sampled at time 0, 30, 60, 90, 120 min after a glucose load (1.75 g/kg, maximum 75 g). GLP-1 hormone was sampled at time 0, 15, 30, 60 and 90 min after the glucose load.
IVGTT—A cannula was inserted in an antecubital vein for blood sampling. Basal blood for measurement of glucose, insulin and C peptide were collected at time −10 and −1 min, after which glucose (300 mg/kg body weight) was infused into a contralateral vein within 30 s, starting at time 0. Blood was then sampled for glucose, insulin and C peptide at time 3, 5, 6, 8, 10, 15, 20, 25, 30, 40, 50 and 60 min postbolus glucose.13
Biochemical measurement
Serum insulin and C peptide were measured on TOSOH ALA System Analyzer using two-site immunoenzymometric assay kits (ST AIA-PACK IRI and ST AIA-PACK C peptide II, respectively) supplied by TOSOH Corporation, Shiba-koen First Bldg., 3-8-2 Shiba, Minato-ku, Tokyo 105-8623 Japan. Interassay coefficient of variation (CV) for insulin at 62 and 146 μU/mL were 8.8% and 4.9%, respectively, and for C peptide at 2.0 and 18.1 ng/mL were 8.3% and 7.9%, respectively. The insulin and C peptide measurements were changed to SI units for subsequent computation and reporting.
Both GAD65 Ab and IA2 Ab were measured using solid phase enzyme immunoassay (IBL International GMBH). The intra-assay (n=5) CVs for GAD65 Ab calculated at 16.9 and 64.94 IU/mL were 7.6% and 8.3%, respectively, while the corresponding interassay (n=5) CVs were 8.4% and 13.8%, respectively. The intra-assay (n=5) CVs for IA2 Ab calculated at 8.68 and 54.02 IU/mL were 15.7% and 9.8%, respectively, while the corresponding interassay (n=5) CVs were 18.6% and 13.7%, respectively. GAD65 Ab and/or IA2 Ab of > 30 IU/mL are considered positive.
Blood samples for GLP-1 measurement were taken in EDTA tubes and put on ice immediately, centrifuged for plasma content and stored at −80°C. GLP-1 concentrations in plasma were measured by radioimmunoassays after extraction of plasma with 70% ethanol (vol/vol, final concentration). Carboxyterminal GLP-1 immunoreactivity was determined using antiserum 89390 which has an absolute requirement for the intact amidated carboxyterminus of GLP-1 7-36amide and cross reacts <0.01% with carboxyterminally truncated fragments and 89% with GLP-1 9-36amide, the primary metabolite of dipeptidyl peptidase IV-mediated degradation. The sum of the two components (total GLP-1 concentration) reflects the rate of secretion of the L cell. Sensitivity was below 1 pmol/L and intra-assay CV was <5%.14
Insulin sensitivity and BC
From the OGTT, fasting and peripheral (dynamic) insulin sensitivities were determined by the Quantitative Insulin Sensitivity Check Index (QUICKI) and the Oral Glucose Insulin Sensitivity Index (OGIS), respectively. These indices have been validated against clamp in T2DM.15 From the IVGTT, insulin sensitivity was estimated with calculated SI (CSI), a validated surrogate index of insulin sensitivity index from the minimal model (SI).16
Homeostatic model assessment for BC (HOMA-%B) was used as a measure of fasting β-cell activity.15 ,17 Insulin secretion was evaluated with the area under the curve (AUC), calculated using the trapezoidal method. During the OGTT, insulin secretion was evaluated with the AUC of C peptide (AUCc peptide) and the amount of insulin reaching the periphery (posthepatic) with AUC of insulin (AUCinsulin). Early phase insulin response during OGTT was calculated for the first 30 min using insulinogenic index, IGI=ΔI30/ΔG30=(I30−Ibasal)/(G30−Gbasal), while the corresponding index for C peptide, IGIC peptide was ΔCP30/ΔG30=(CP30−CPbasal)/(G30−Gbasal). Acute insulin response (AIR) during IVGTT was calculated from the suprabasal average of insulin in the 3–10 min interval after the glucose bolus. The BC describes the ability of glucose to stimulate insulin release from β-cells. It was calculated as incremental AUCinsulin (ΔAUCinsulin) and AUCc peptide (ΔAUCc peptide) over the incremental AUCglucose (ΔAUCglucose) in both tests, which are BCOG during OGTT and BCIV during IVGTT.18 We also calculated the shape index (Whole-Ogtt-Shape-index, WHOSH) for glucose, insulin and C peptide, which correlate with a model-based parameter of BC. Shape indices quantify the degree of variation of a curve. Previous study has shown that a complex shape (ie, higher variability) is associated with better glucose tolerance condition. The C peptide shape index (WHOSHC peptide) has also been shown to correlate with a model-based parameter of BC.19
BC cannot be correctly assessed unless adjusted for the prevailing insulin resistance.20 Under normal conditions, a balance between insulin secretion and insulin sensitivity maintains the tight glucose regulation. The disposition index (DI) reflects the ability to maintain glucose regulation through a balance between insulin secretion and insulin sensitivity. DI was calculated using the product of insulin sensitivity and insulin secretion from OGTT using product of OGIS×ΔAUCinsulin and from IVGTT using product of CSI×AIR.
Assessment of incretin hormone secretion and incretin effect
The incretin hormone, GLP-1, was measured during the 2-hour OGTT at times 0, 15, 30, 60 and 90 min. The GLP-1 secretion was presented as total AUC (tAUC) calculated using the trapezoidal method. The relative response was calculated as fold increase of GLP-1 relative to baseline. Relative early response of GLP-1 (GLP rAUC0–15) was calculated as tAUC0–15/(fasting concentration×15 min) and the relative full response (GLP rAUC0–90) was calculated as tAUC0–90/(fasting concentration×90 min). The incretin effect was estimated by relating the differences in β-cell responses from C peptide between stimulation with oral and intravenous glucose. The incretin effect was estimated by the formula 100×(BCOG−BCIV)/BCOG.21
Statistical analyses
With a ratio of YT2DM to control subjects of 2:1, a sample size of 28 T2DM and 14 control subjects would have the 80% power to detect a mean difference of 70 mL/min/m2 in OGIS (eg, difference between T2DM mean of 350 ml/min/m2 and control's mean of 420 mL/min/m2), with the common SD of 75, and p<0.05.22 Besides, based on a previous study by Pacini et al,21 assuming 66±25% is the incretin effect in 35 controls, 31 T2DM subjects were sufficient to detect a mean difference of 48±25% incretin effect, with 80% power and p<0.05.
The data were collected and analyzed using Statistical Package for the Social Sciences (SPSS) V.20.0. The data were de-identified before their use in analyses. Data of categorical variables were presented in n (%). Data of continuous variables were described in mean±SEM. Inferential analyses using χ2 test were performed between T2DM and control subject groups for demographics, clinical history, metabolic control, and development of comorbidities and complications. Fisher's exact tests were employed wherever assumptions for χ2 tests were not fulfilled. Independent Student's t-tests were employed to investigate the mean differences between T2DM and control groups for age, glycemic and metabolic parameters, indices for insulin sensitivity, BC and incretin effect. The relationship between glycemic control (HbA1c) and incretin effect was examined by Pearson's correlation.
Results
Study subjects
Thirty subjects with clinical diagnosis of T2DM and 18 controls matched for gender, ethnicity and BMI were recruited for this study. Five youth with diabetes and three controls were excluded due to positive pancreatic autoantibodies. Subsequent comparisons were made between the 25 youth with antibodies negative T2DM (YT2DM) and 15 matched controls. The YT2DM were on variable treatment regimens that include diet therapy alone (n=2), metformin alone (n=11), dual OADs (n=4) and combination of OAD(s) and insulin (n=8). The HbA1c was 10.0±4.0% (86±43 mmol/mol) with diet therapy alone, 7.7±1.6% (61±18 mmol/mol) with metformin alone, 9.0±0.5% (75±6 mmol/mol) with dual OADs and 8.5±2.0% (69±21 mmol/mol) with OAD(s) and insulin (p=0.336).
Table 1 summarizes subjects' characteristics and fasting metabolic profile. There were no significant differences in gender, ethnic distributions and pubertal staging but the YT2DM group was about 4 years younger than the controls. The YT2DM group was twice as likely to have either/or both parents with T2DM. Acanthosis nigricans, a marker of insulin resistance, was three times more likely in the YT2DM group. The YT2DM had greater visceral adiposity, despite similar total and subcutaneous adiposity compared with controls.
Physical characteristics and fasting metabolic profile
Glucose, insulin and C peptide responses during OGTT
Figure 1A–C illustrates the glucose, insulin and C peptide excursion during OGTT. Glucose was higher at every time point in the YT2DM than controls. Fasting insulin and C peptide were higher in the YT2DM at baseline. The total pancreatic insulin secretion over 2 hours during the OGTT, as measured by AUCC peptide were lower in the YT2DM compared with controls, 1630±207.3 vs 2796±217.8 (×102) min×pmol/L (p=0.001). The total insulin reaching the peripheral circulation, as measured by AUCinsulin were similarly lower in the YT2DM, 3453±647.3 vs 6240±748.4 (×101) min×pmol/L (p=0.009).
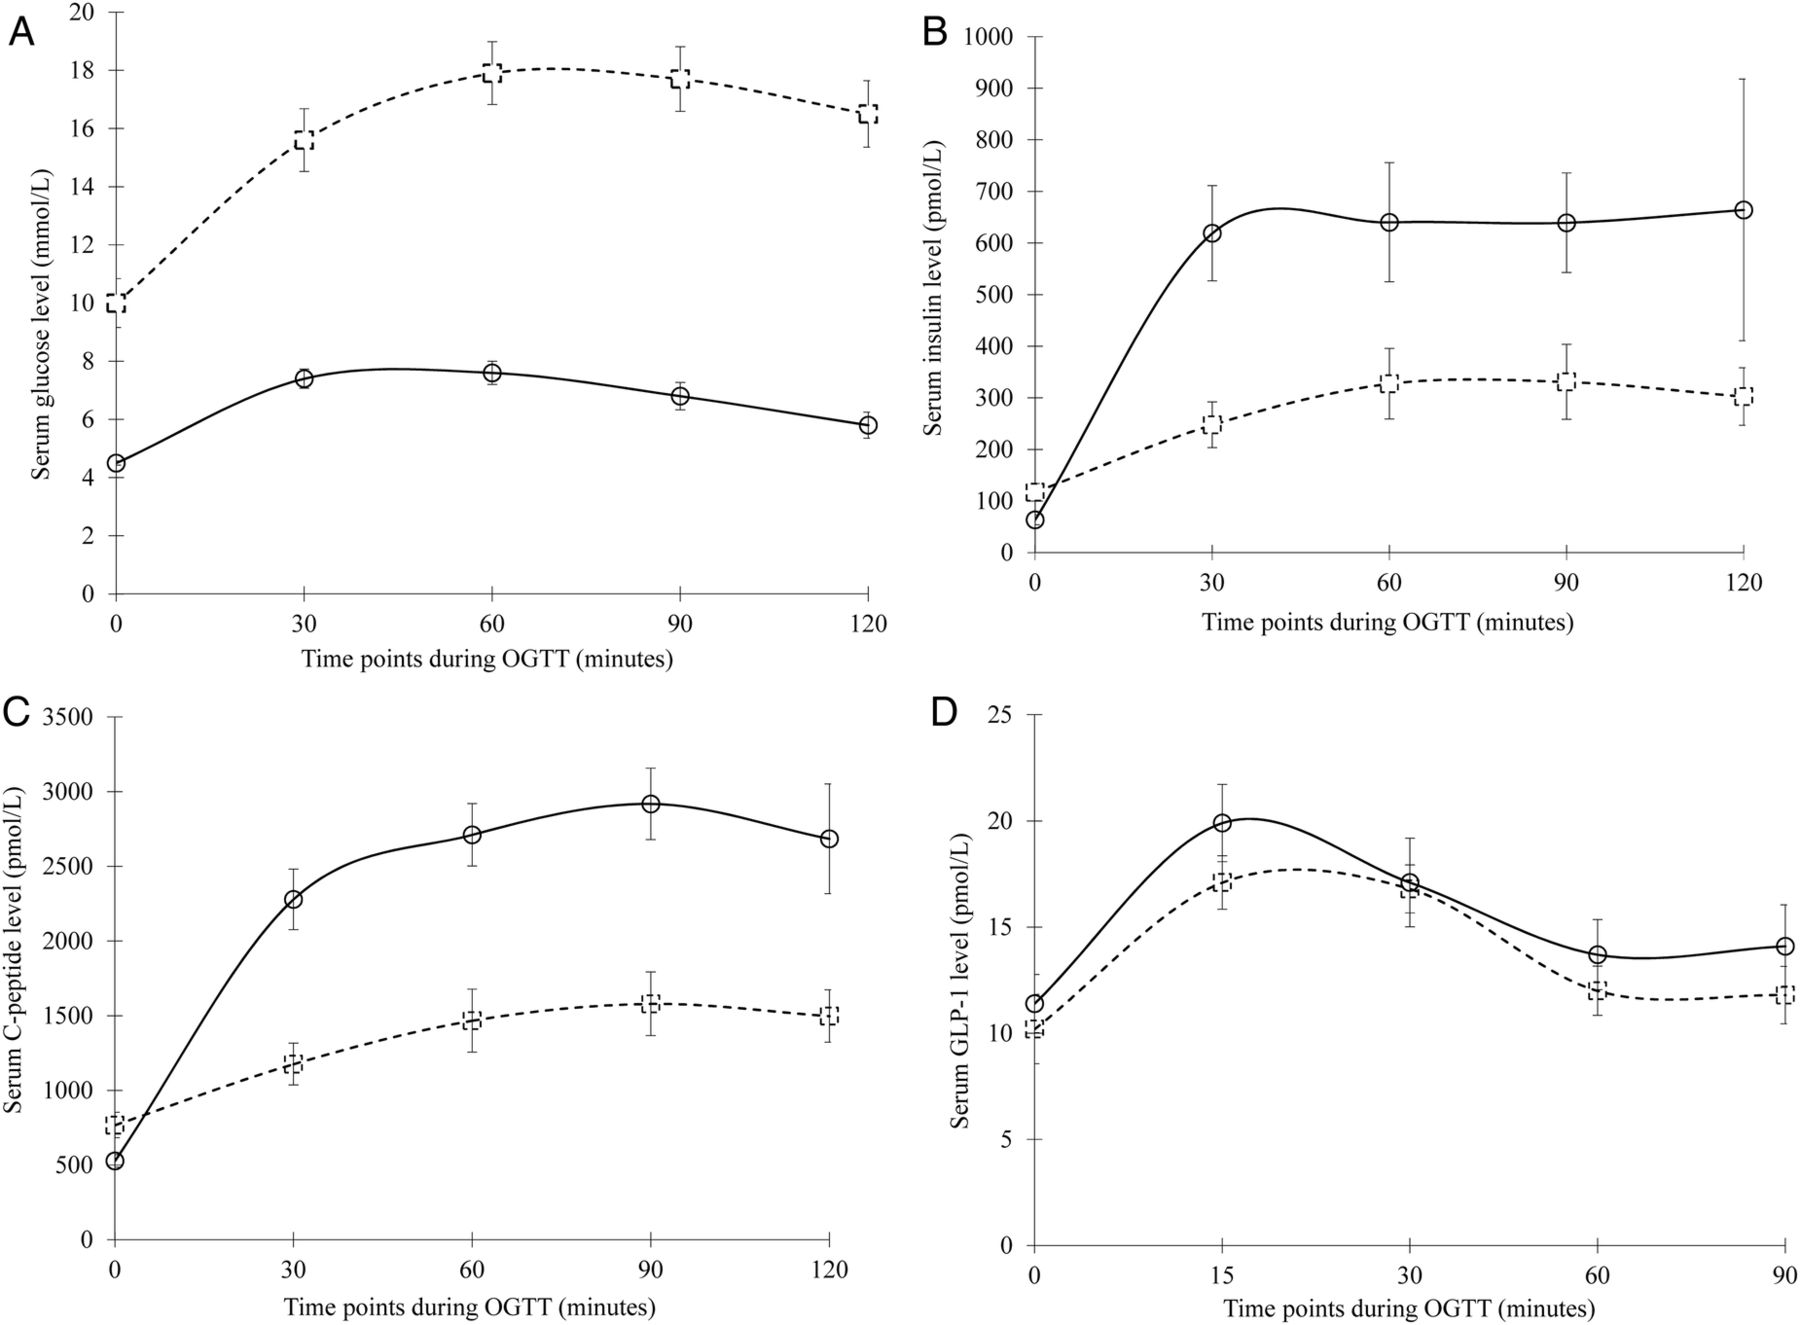
Plasma glucose (A), serum insulin (B), serum C peptide (C) and plasma GLP-1 level (D) during the 2-hour OGTT among subjects with normal glucose tolerance (NGT) (circles with solid line) and YT2DM (squares with dotted line). Data were presented in mean±SEM. GLP-1, glucagon-like peptide-1; OGTT, oral glucose tolerance test; YT2DM, youth onset type 2 diabetes mellitus.
Insulin sensitivity and BC
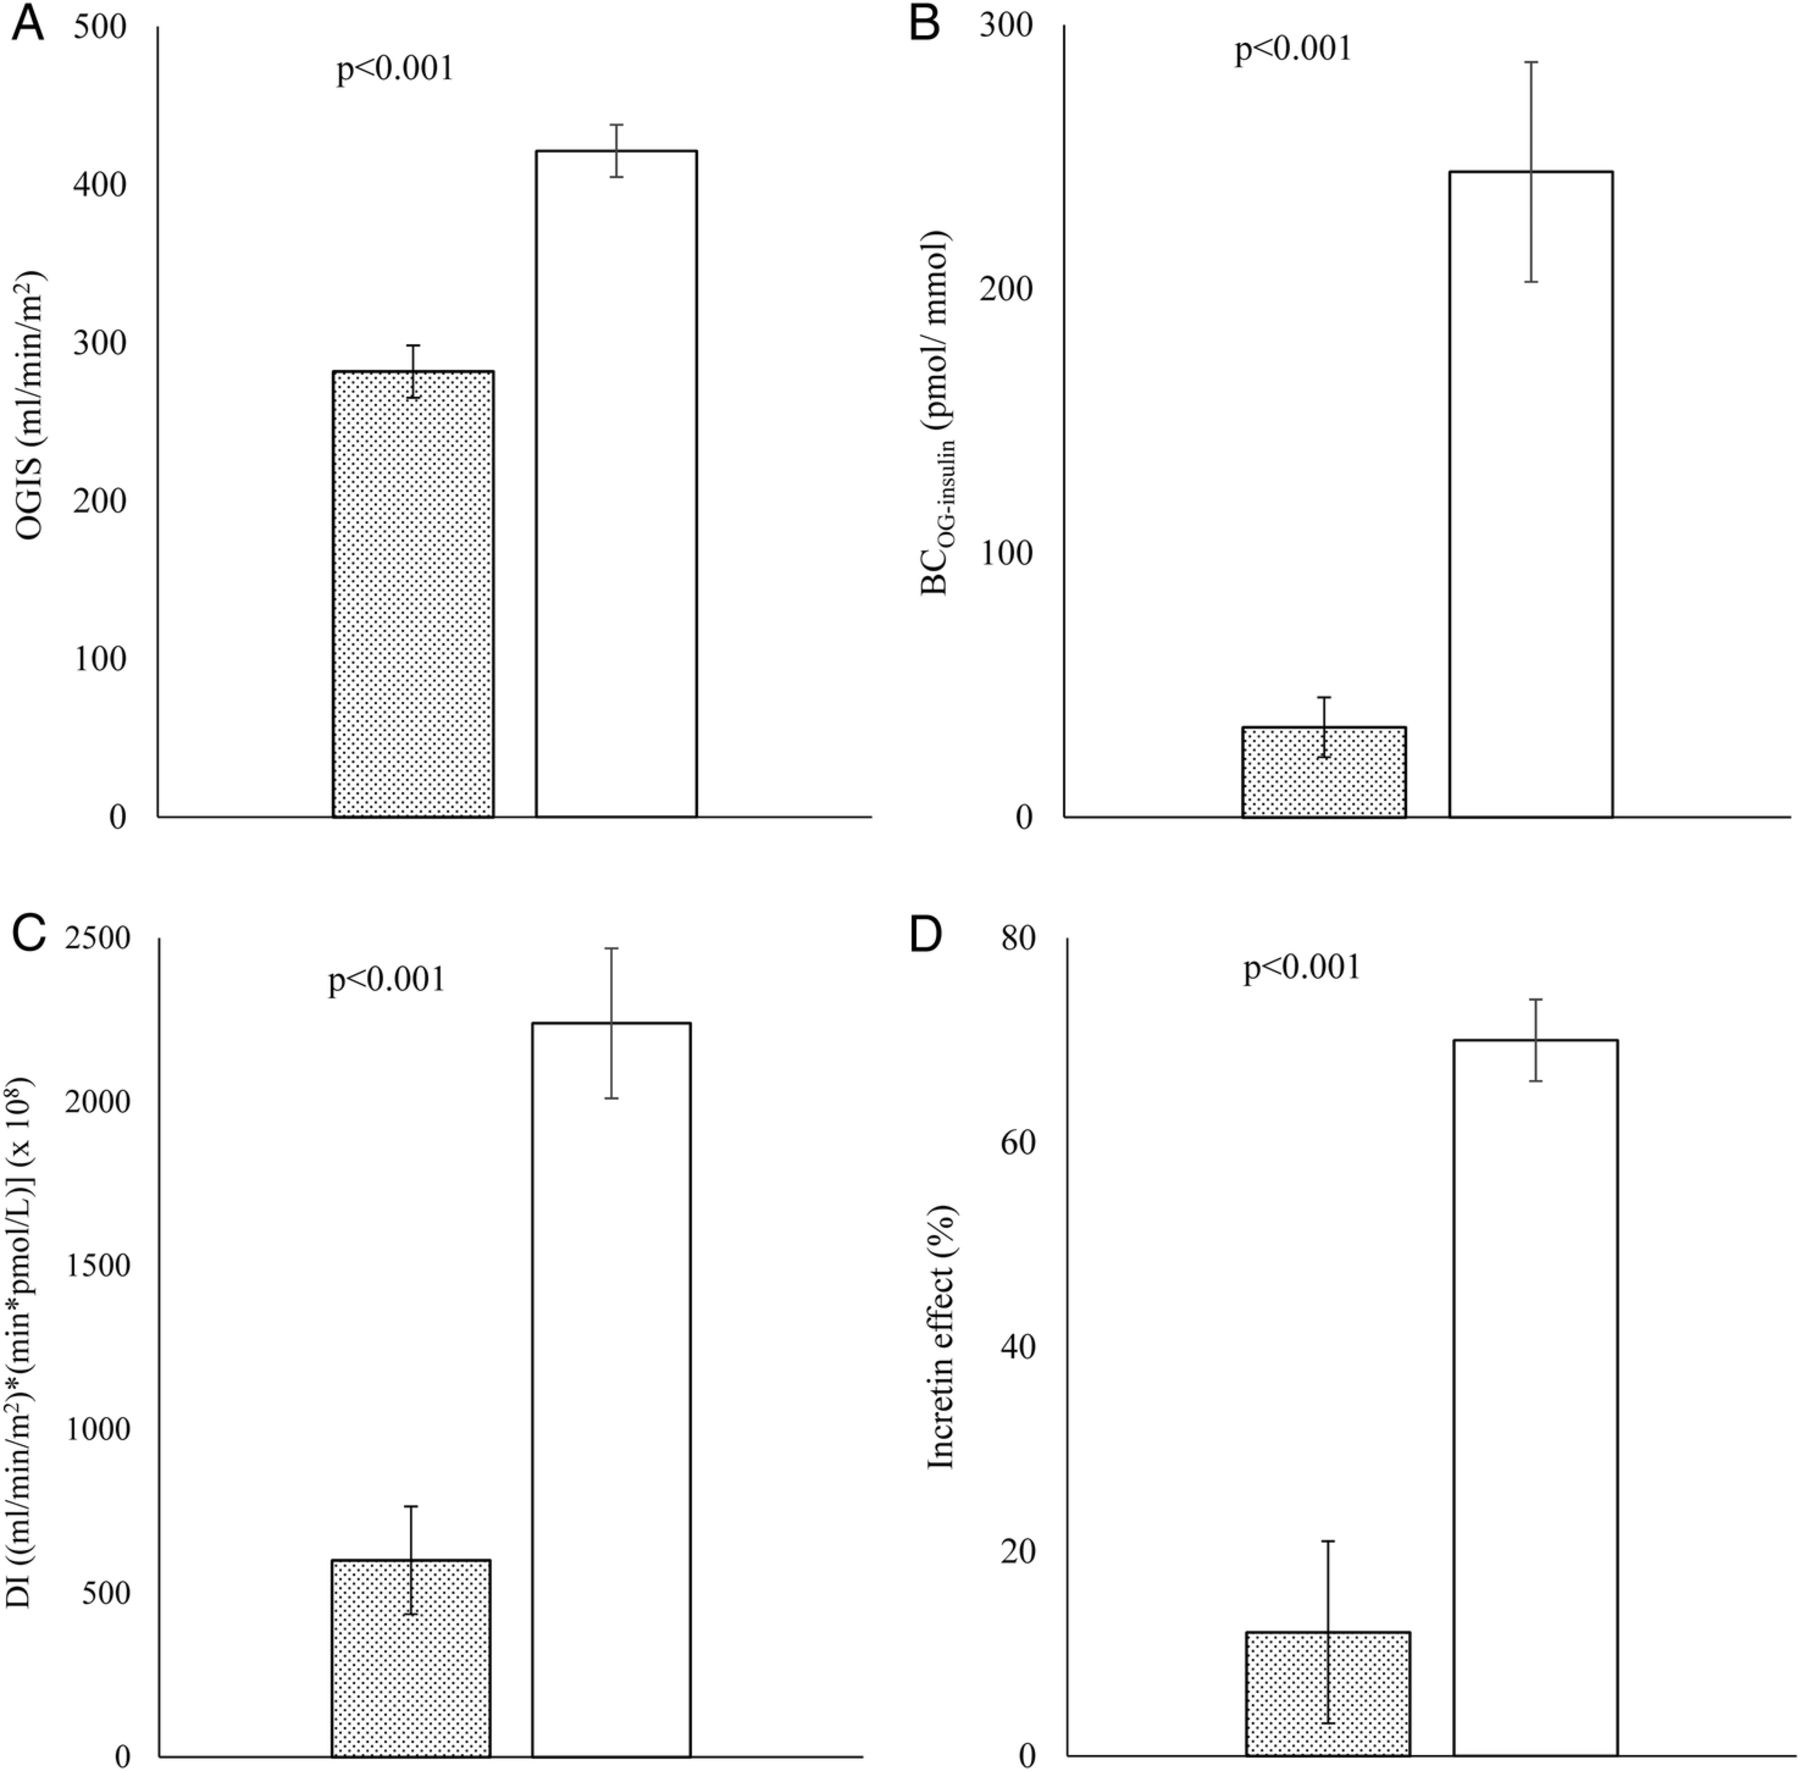
The indices generated from OGTT and IVGTT are reported in table 2 and figure 2A–C. The YT2DM had lower fasting insulin sensitivity (QUICKI) and peripheral insulin sensitivity (OGIS) than the controls. The IVGTT-derived CSI was also lower in the YT2DM group. The early phase insulin responses to glucose challenge, as measured by AIR, were diminished by more than 80% when compared with the controls. IGI and IGIC peptide were similarly lower though they did not reach statistical significance. The BC, BCOG−insulin and BCIV−insulin were reduced in the YT2DM group by 86% and 62%, respectively. The reduced BC was further confirmed by the lower WHOSHC peptide in the YT2DM. The DI, both derived from OGTT and IVGTT, was also reduced in the YT2DM subjects.
OGTT-modeled and IVGTT-modeled parameters of insulin sensitivity and β-cell function
OGIS (A), BC (B), DI (C) derived from OGTT parameters, and incretin effect (D) among subjects with YT2DM (bar graph with dots) and NGT (bar graph without filling pattern). Data were presented in mean±SEM. BC, β-cell function; DI, disposition index; OGIS, Oral Glucose Insulin Sensitivity Index; OGTT, oral glucose tolerance test; YT2DM, youth onset type 2 diabetes mellitus.
Incretin hormone secretion and incretin effect
The GLP-1 responses during OGTT are shown in figure 1D. There was no difference in GLP-1 secretion at baseline and all subsequent time points between YT2DM and control subjects. The total GLP-s secretion (tAUC0–90) for YT2DM and control groups were 1223.4±79.40 and 1347.5±125.84 pmol/L, respectively (p=0.385). Early phase and total GLP-1 secretion were otherwise similar between groups both in absolute (tAUC) and relative (rAUC) terms. Despite the similar level of GLP-1 secretion, incretin effect was significantly reduced in the YT2DM group (12.1±8.93% vs 70.0±4.03%, p<0.001; figure 2D). The incretin effect was inversely correlated with HbA1c in our study (r2=0.271, p<0.001).
Discussion
T2DM in the youth from a multiethnic Malaysian population, when compared with peers with normal glucose tolerance, is characterized by decreased insulin sensitivity and relative impairment in BC. In the fasting state, insulin sensitivity (QUICKI) and BC (HOMA-%B) were markedly lower in YT2DM, reflecting hepatic insulin resistance23 and impaired β-cell activity, respectively. Majority of our participants (88% of YT2DM and 100% controls) had Tanner stage IV and V. The effect of puberty on the difference observed in insulin sensitivity is therefore minimal. Decreased insulin sensitivity and BC are also observed in studies among Korean, Taiwanese and Indian youth with T2DM.24–26
Obesity is considered one of the major triggers for YT2DM, with inadequate insulin secretion to compensate for the rising insulin resistance driven by obesity and puberty.3 The Asian YT2DM in our study have lower mean BMI than the African-American and Caucasian adolescents with T2DM reported in previous studies8 ,9 ,27 ,28 but similar insulin sensitivity (OGIS).8 About 50% of the Taiwanese youth with T2DM had BMI<27 kg/m2 and insulin sensitivity were similar in the obese and non-obese YT2DM.25
In our study, the reduction in BC derived during OGTT (BCOG) in YT2DM was more pronounced than the reduction in insulin sensitivity (OGIS), suggesting that β-cell dysfunction plays a more important role in reducing glucose tolerance. There was also impaired ability of the β-cell to adjust for the prevailing insulin resistance, as evidenced by reduced DI. These observations were consistent with previous studies which demonstrated greater impairment in BC relative to insulin sensitivity in youth with T2DM.25 ,26 ,29
Our result adds to the scarce literature in youth with T2DM by providing novel information on the incretin effect and GLP-1 concentrations during the OGTT. We demonstrated that YT2DM have similar GLP-1 concentration in response to the oral glucose compared with control subjects with normal glucose tolerance. This is consistent with findings from two meta-analyses in adults with T2DM30 ,31 despite earlier contrasting reports in smaller studies.32 ,33 The ADDITION-PRO study, based on a population of screen-detected diabetes also demonstrated reduced GLP-1, especially late GLP-1 responses at 120 min, during an OGTT in screen-detected T2DM.34 We did not capture GLP-1 level at 120 min. However, studies showed that GLP-1 level generally peak at 30 min and reach a plateau by 90 min after oral glucose challenge.10 ,24 ,35 It may be safe to assume that GLP-1 level at 90 min is similar to that at 120 min. The discrepancy may reflect the different population studied since GLP-1 secretion has been shown to be affected by diabetes duration, severity of diabetes, age, sex and BMI.34 Our YT2DM were younger, with short duration of diabetes but significant degree of hyperglycemia. The majority of our YT2DM were on metformin which has been demonstrated to increase GLP-1 secretion.36 The ‘good’ level of GLP-1 secretion may also be due to the residual effect of metformin even though our subjects had their medications stopped for a minimum of 5 days prior to the OGTT. Korean children and adolescents with T2DM who were treatment naive were also found to have preserved intact GLP-1 secretion when assessed during OGTT.24
Despite the similar GLP-1 secretion, the incretin effect was reduced by more than 80% in our YT2DM compared with controls. Lesser degree of reduction in incretin effect has also been observed in two other studies among non-Asian youth with T2DM.10 ,37 However, the incretin effect was derived differently from all three studies making direct comparison inaccurate. The greater reduction in incretin effect in our study may be due to the poorer glycemic control among our subjects since hyperglycemia has been proposed to downregulate GLP-1 receptor expression on β-cells and cause ‘GLP-1 resistance’.34 We also found a significant inverse correlation between HbA1c and incretin effect. The lack of compensatory mechanisms, as shown by the DI may be partly ascribed to the impaired incretin effect, observed without reduction in GLP-1. Further clinical studies in YT2DM are needed to establish if incretin-based therapy can benefit glycemic control in YT2DM. The possibility of ‘GLP-1 resistance’ could also have important implications for the design of new therapies based on modulations of the GLP-1 pathways.
Conclusions
The current study adds to the scarce literature in adolescents with T2DM of Asian descent. In this multiethnic Asian cohort, pathophysiology of YT2DM is characterized by marked impaired BC in the presence of insulin resistance. Incretin effect is impaired in adolescents with T2DM compared with controls, possibly without reduction in GLP-1, similar to that seen in adult T2DM. This understanding can help guide the choice of therapeutic modalities and is relevant to all physicians in our increasingly globalized world.
Acknowledgments
The authors thank the nurses of the clinical research center for expert nursing assistance, and Infokinetics for research assistance and administrative support. Last but not least, the authors express their sincere thanks to the participating subjects and their family. This study has been presented for General Poster Session and Moderated Poster Discussion at the American Diabetes Association's 76th Scientific Sessions, June 10–14, 2016, in New Orleans, Louisiana. The abstract has been published in the Scientific Sessions Abstract Book, as the June 2016 supplement to the Journal Diabetes. Part of this study has also been presented at the Young Investigator Award at the Diabetes Asia Conference, October 6–9, 2016 in Kuala Lumpur, Malaysia.
References
Footnotes
This study has been presented at (1) General Poster Session and Moderated Poster Discussion at the American Diabetes Association's 76th Scientific Sessions, June 10–14, 2016, in New Orleans, Louisiana, and (2) Young Investigator Award at the Diabetes Asia Conference, October 6–9, 2016 in Kuala Lumpur, Malaysia.
Contributors TPY conceptualized and designed the study, obtained funding and drafted the initial manuscript. GP and AT performed the modeling analyses of the OGTT, IVGTT and the incretin effect, helped in the interpretation of the results and critically reviewed and edited the manuscript. CPH maintained the database, performed statistical analyses, and critically reviewed and edited the manuscript. SLL, FHST, CVT, JYHH, FMZ collected data in each center and reviewed the manuscript. JJH and WNWM performed the laboratory measurements and reviewed and edited the manuscript. All authors approved the final version for submission. TPY is the guarantor of this work and, as such, had full access to all the data in the study and takes responsibility for the integrity of the data and the accuracy of the data analysis.
Funding This work was supported by research funding from the Ministry of Health Malaysia (NMRR-12-1042-13254), the Malaysian Endocrine and Metabolic Society (MEMS) and Novartis Malaysia Sdn Bhd.
Competing interests None declared.
Ethics approval Malaysian Medical Research and Ethics Committee.
Provenance and peer review Not commissioned; externally peer reviewed.
Data sharing statement All data are included in this manuscript. Raw data are hosted at Penang Medical College, and available for sharing on request.