Article Text

Abstract
Objective To evaluate the ability of contrast sensitivity (CS) to discriminate loss of visual function in diabetic subjects with no clinical signs of retinopathy relative to that of normal subjects.
Research design and methods In this prospective cross-sectional study, we measured CS in 46 diabetic subjects with a mean age of 48±6 years, a best-corrected visual acuity of 20/20 and no signs of diabetic retinopathy. The CS in these subjects was compared with CS measurements in 46 normal control subjects at four spatial frequencies (3, 6, 12, 18 cycles per degree) under moderate (500 lux) and dim (less than 2 lux) background light conditions.
Results CS was approximately 0.16 log units lower in patients with diabetes relative to controls both in moderate and in dim background light conditions. Logistic regression classification and receiver operating characteristic curve analysis indicated that CS analysis using two light conditions was more accurate (0.78) overall compared with CS analysis using only a single illumination condition (accuracy values were 0.67 and 0.70 in moderate and dim light conditions, respectively).
Conclusions Our results showed that patients with diabetes without clinical signs of retinopathy exhibit a uniform loss in CS at all spatial frequencies tested. Measuring the loss in CS at two spatial frequencies (3 and 6 cycles per degree) and two light conditions (moderate and dim) is sufficiently robust to classify diabetic subjects with no retinopathy versus control subjects.
- diabetes
- diabetic retinopathy
- contrast sensitivity
This is an Open Access article distributed in accordance with the Creative Commons Attribution Non Commercial (CC BY-NC 4.0) license, which permits others to distribute, remix, adapt, build upon this work non-commercially, and license their derivative works on different terms, provided the original work is properly cited and the use is non-commercial. See: http://creativecommons.org/licenses/by-nc/4.0/
Statistics from Altmetric.com
Significance of the study
What is already known about this subject?
Patients with diabetic retinopathy experience a decline in contrast sensitivity which is aggravated with the progression of retinopathy. It is not clearly known whether a decline in contrast sensitivity may occur prior to the onset of any clinical signs of retinopathy and what the characteristics of these possible changes are.
Previous published studies showed that diabetes decreases contrast sensitivity preferentially in low spatial frequencies, while other studies indicate that the losses are largely present in mid-range or high frequencies.
What are the new findings?
In this prospective cross-sectional study, contrast sensitivity measured in patients with diabetes with no diabetic retinopathy under moderate and dim background light conditions showed a uniform loss at four spatial frequencies in comparison with normal subjects.
Contrast sensitivity analysis using two light conditions was more accurate (0.78) overall compared with contrast sensitivity analysis using only a single illumination condition (accuracy values were 0.67 and 0.70 in moderate and dim background light conditions, respectively).
How might these results change the focus of research or clinical practice?
Evaluation of contrast sensitivity in patients with diabetes with no retinopathy may detect early changes at the preclinical stage. Measuring the loss in contrast sensitivity at two spatial frequencies (3 and 6 cycles per degree) and two light conditions (moderate and dim) is sufficiently robust to classify diabetic subjects with no retinopathy versus control subjects.
Introduction
Diabetic retinopathy (DR) is associated with abnormalities of the vascular and neural retina that lead to loss of vision.1 Patients with diabetes experience visual dysfunction including a gradual reduction in contrast sensitivity (CS) that negatively impacts on the quality of their lives.2 CS provides the ability to detect differences in luminance and distinguish details, edges or borders of images.3 Consequently, many routine visual tasks such as reading, driving and face recognition are highly dependent on CS.4 Diabetic subjects experience a decline in CS that progresses with the severity of retinopathy, although a substantial portion can experience a decline in CS prior to the onset of any clinical signs of retinopathy.5–7 These early losses in CS in diabetic subjects have even been observed in the presence of excellent Snellen visual acuity,8–11 suggesting that losses in CS can be indicative of early visual dysfunction.
The loss in CS observed in diabetic subjects is significant.12 However, it remains controversial if diabetes leads to a general loss in CS or if this loss is limited to particular features of the visual image. Determination of the deficits in spatial contrast vision in diabetes is important because it can suggest candidate retinal and/or visual pathways altered by the disease process. A number of studies propose that diabetes decreases CS preferentially in low spatial frequencies, while other studies indicate that the losses are largely present in mid-range or high frequencies.5 10 13–18 Such disagreement may arise from methodological differences, limitations in the statistical power of the studies performed and/or non-specific effects of diabetes. Altogether, these results suggest that the nature of the deficits in spatial contrast vision during early diabetes has not been well established, and it is not firmly established whether tests of spatial contrast with sinusoidal gratings can be used to detect visual impairment in patients with diabetes with no clinical retinopathy.
Here, we report the results of spatial CS assessment in patients with diabetes with no clinical signs of retinopathy. We tested the CS to sinusoidal gratings at four different spatial frequencies (3, 6, 12 and 18 cycles per degree) and investigated the potential effects of age, sex, blood lipid levels, diabetes duration and its control on the measured outcomes. Logistic regression classification models and receiver operating characteristic (ROC) curve analysis were used to assess the ability of CS to classify diabetic versus control groups in dim and moderate illumination conditions.
Research design and methods
Participant selection
This prospective, comparative, cross-sectional study included 46 patients with diabetes ranging from 28 to 55 (mean: 48±6) years of age, 44 (95.7%) with type 2 diabetes and two (4.3%) with type 1 diabetes. All patients had a best-corrected visual acuity (BCVA) of 20/20 and no clinical signs of DR in funduscopy. Subjects with corneal pathology, lens opacity, history of glaucoma, amblyopia, history of cataract or corneal refractive surgery, refractive errors of more than 3 diopters or any retinal disease were excluded from the study. Cases were compared with 46 normal healthy volunteers with no history of diabetes who served as controls matched by age and sex. The study was conducted in accordance with the Declaration of Helsinki and was approved by the Ethics Committee of the Ophthalmic Research Center affiliated to Shahid Beheshti University of Medical Sciences, Tehran, Iran. Informed consent was obtained from all participants.
Ocular and systemic examinations
All subjects underwent comprehensive ophthalmic examination including BCVA assessment, slit-lamp examination, intraocular pressure measurement and funduscopy. Fundus examination was performed with indirect ophthalmoscopy through a fully dilated pupil. Stereoscopic biomicroscopy by 78 diopter indirect lens (Volk Optical, Mentor, Ohio, USA) was used for meticulous macular evaluation. BCVA was determined with a Snellen chart. Two days after ophthalmic examination, CS was measured by an optometrist (AR). Blood samples were collected to check for fasting blood sugar, glycosylated hemoglobin (HbA1c), serum cholesterol (high-density lipoprotein, low-density lipoprotein) and triglyceride levels. Systemic blood pressure and known duration of diabetes were also noted.
Contrast sensitivity test
CS to four spatial frequencies (3, 6, 12 and 18 cycles per degree) was determined using a backlit CSV-1000 CS chart (Vector Vision, Dayton, Ohio, USA). The chart was divided into four sections, each designed to test contrast in response to a specific spatial frequency. Each section included 17 circular patches with a diameter of 1.5 inches. Within a section, the test patches were arranged in two rows with eight columns. The first circular patch from the left side had the highest contrast and the contrast continued to decrease through the right-sided ones. The levels of contrast in each row decreased from left to right in a logarithmic rate in steps of 0.17 log units for contrast levels 1–3 and 0.15 units for contrast levels 3–8. The two patches in each column were randomly assigned as grating or blank. The chart was backlit at a constant luminance of 85 cd/m2.
The testing procedure was explained to all individuals prior to the start of testing. Tests were performed monocularly with the BCVA. The test chart was located at a fixed distance; 2.5 m (8 feet) from the subjects. Subjects were asked by the examiner whether they could distinguish the grating from the blank patches in every row, shifting from the patch with highest contrast to the lowest one, until they were unable to recognize the grating from the blank. The contrast level of the last corrected response was considered as the CS threshold and the logarithmic transformed results were plotted against the four spatial frequencies to determine the contrast sensitivity function (CSF) for each subject.
Contrast sensitivities were measured at two different lighting conditions: (1) room lights on (approximately 500 lux incident at the position of the subject's eye), and (2) room lights off (illumination levels less than 2 lux and originating largely from the backlit panel of the instrument). For tests in the latter lighting condition, the subjects were allowed to adapt to the dark for 25 min prior to testing. Illumination levels were determined with a Sekonic light meter (i-346 Illuminometer; Sekonic). Pupil diameters were measured in dim lights using a Colvard pupillometer (Oasis Medical, Glendora, California, USA).
Statistical analysis
To describe the data, frequency (percent), mean±standard deviation (SD), median and range were used. To evaluate differences between the two groups at baseline, we used a Student's t-test or Mann-Whitney U test and a χ2 test. The generalized estimating equation (GEE) was used to evaluate the difference considering the correlation between observations.19 p Value less than 0.05 was considered as statistically significant. Statistical analysis was performed using SPSS software (V.17.0; SPSS, Chicago, Illinois, USA). Logistic models and ROC curves were also applied to evaluate the sensitivity and specificity of CS measurements to discriminate diabetic from control subjects. The sensitivity data were initially used in individual logistic regression analysis to assess discriminative power in an idealized ‘best-fit’ approach.
This best fitting was accomplished by adjustment of the partial regression coefficients (a, bi) for each sensitivity measure until an optimal solution was obtained using the maximum likelihood criterion. Since a prediction is made for each subject, the results of this analysis are then used to produce a 2×2 classification table from which we determined the sensitivity or true positive rate (ie, fraction of diabetic subjects who were correctly predicted to fall in this class based on the model) and the specificity or true negative rate (ie, the fraction of control subjects who were correctly predicted to be controls). The cut-off points for the classification were set by default to be p=0.5 (halfway between the diagnostic category coding of 0 and 1). By varying the cut-off point across the full range of cut-off values and recalculating the sensitivity and specificity at each point, it was then possible to construct an ROC plot which provided an unbiased assessment of the overall model performance. Calculations were performed with Microsoft Office Excel using the Real Statistics add-in software. The relative informativeness of each classification model was determined by comparison of their Akaike information criteria (AIC) values.20
Results
The CS of diabetic and control subjects was tested. Each group consisted of 12 men and 34 women; the two groups were matched for age (48±6 (range: 28–55) and 46±6 (range: 35–55) years in cases and controls, respectively) (table 1). Mean known duration of diabetes in the case group was 82.23±67.8 (6–312) months. In diabetic subjects, the mean fasting blood sugar level was 161±57 (70-323) mg/dL and the mean of HbA1c was 7.32%±1.35% (5.0–10.6). The mean systolic and diastolic blood pressures were 126±18 (100-180) and 81±9 (65–110) mm Hg, respectively. The results of laboratory tests and blood pressure evaluation were summarized in table 2.
Demographic characteristics of the case and control groups
Laboratory test results and blood pressure in patients with diabetes
Spatial CSF in moderate light condition
Figure 1 shows the CSF of control and diabetic subjects determined as described in the Methods section. The CSF had the characteristic band-pass shape expected for subjects exposed to photopic lights:21 CS peaked at 6 cycles per degree and decreased gradually with higher and lower spatial frequencies. CS values matched closely with those of another study reported previously that also used the CSV-1000 CS chart18 .The shape of the CSF of diabetic subjects was similar to that of control subjects; however, the CSF in diabetic subjects was shifted downward by approximately 0.16 log units (44%) relative to that of control subjects, indicating a uniform loss in sensitivity at all spatial frequencies. Application of GEE analysis (to account for within-subject correlations19) indicated statistically significant differences in CS at all spatial frequencies between diabetic and control subjects (p value <0.001) except at 3 cycles per degree (figure 1 and table 3). Nine to 19% of the diabetic subjects had CS values that differed by 2SD or more relative to the distribution of normal control subjects. There were no significant correlations between HbA1c and CSF across all spatial frequencies (3 cycles per degree, r=0.143, p=0.177; 6 cycles per degree, r=0.141, p=0.181; 12 cycles per degree, r=0.102, p=0.336; 18 cycles per degree, r=0.161, p=0.128) under moderate light condition.
Contrast sensitivity (log unit) at all spatial frequencies under moderate and dim light conditions
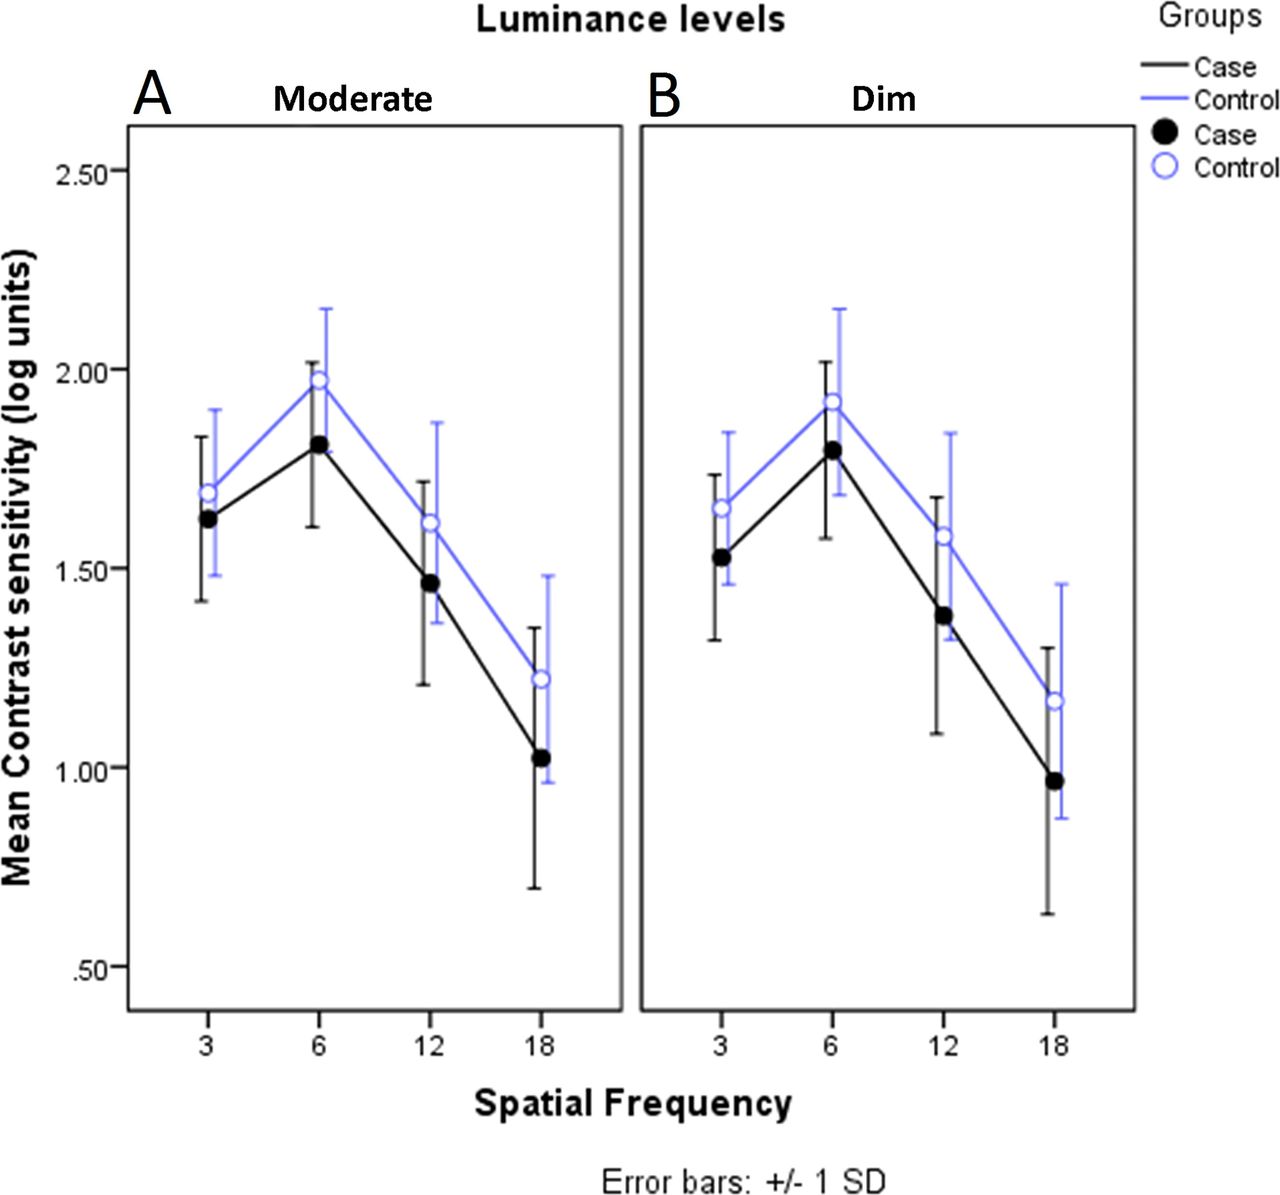
Mean contrast sensitivity at different spatial frequencies in moderate (A) and dim (B) light conditions in case and control groups (full and empty symbols, respectively). Error bars represent standard deviation (SD).
Spatial CSF in dim light condition
CS measurements were also performed in a dimly lit environment to reduce potential glare effects which may arise from a brightly lit environment. Subjects were dark-adapted approximately 25 min prior to the test to maximize visual sensitivity in diabetic subjects. The CSF of control subjects measured in these dim conditions had the characteristic band-pass shape and matched closely the CSF measured in moderate lights. The CSFs of diabetic patients were significantly desensitized at all spatial frequencies tested, including the responses to low frequency gratings (3 cycles per degree) (figure 1 and Table 3). The average reduction in CS of patients with diabetes relative to control subjects across all frequencies was approximately 0.16 log units, which is very similar in magnitude to the reduction observed when the same diabetic subjects were tested in a moderately lit room. The proportion of subjects with diabetes with CS values that differed by 2SD or more relative to the distribution of normal control subjects ranged from 9% to 21%, depending on the spatial frequency of the test.
No correlations were observed between CSF and HbA1c across all spatial frequencies (3 cycles per degree, r=0.099, p=0.35; 6 cycles per degree, r=0.075, p=0.481; 12 cycles per degree, r=0.133, p=0.208; 18 cycles per degree, r=0.087, p=0.410) under dim light condition.
The interaction term within GEE analysis showed that the trends’ difference of CS by age in case and control groups was only statistically significant at 3 cycles per degree under moderately lit conditions (p=0.025). In addition, there was no correlation between the known duration of diabetes and CS loss in diabetic subjects at any of the spatial frequencies tested. To control for the unusually slow rate dark adaptation which is observed in some patients with diabetes,22 CS measurements were repeated after 40 min of dark adaptation in six cases and found no significant difference (p=0.161) in CS compared with that measured from the same patients after only 25 min of dark adaptation.
Sensitivity and discrimination
Logistic regression classification and ROC analysis were applied to model CS and to determine the ability of different CS measurement sets to correctly distinguish diabetic versus control subjects.12 The input variables for the model were the contrast sensitivities that measured (1) from the right and left eyes, (2) the spatial frequency of the stimulus grating (3, 6, 12 and 18 cycles per degree) and (3) the illumination level (dim versus moderate) in each eye. Partial regression coefficients of the respective models are listed in table 4. We applied the AIC to evaluate relative contributions of different input variables to the informativeness of each model.20
Partial regression coefficients for the indicated experimental conditions
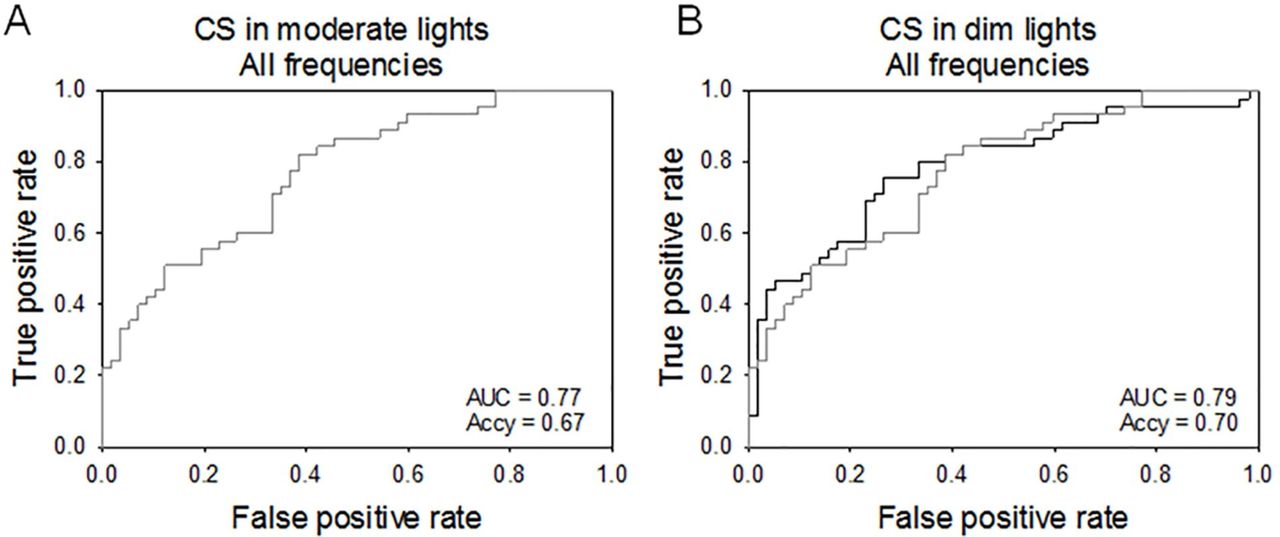
At first, we evaluated a model that included measurements of CS in both eyes and all four spatial frequencies under moderate illumination conditions (figure 2A) and compared it with a model that evaluated CS in dim conditions (figure 2B). The accuracy of the models estimated by determining the area under the ROC curve (AUC) was 0.77 and 0.79 for moderate and dim conditions, respectively (not significantly different, p>0.765). ROC curves were used to establish an overall estimate of the classification accuracy across a range of probability cut-off values set at 0.5 for the logistic regression approach, which is halfway between the diagnostic categories of 0 and 1. These values are different than the empirical accuracy of the model (ACCY) which can be defined as the fraction of true positive and true negative cases correctly classified compared with the total number of cases examined. We found ACCY values of 0.67 and 0.70 for moderate and dim light conditions, respectively.

Receiver operating characteristic (ROC) curves for discriminating diabetic subjects without retinopathy from control subjects using a logistic model that integrated responses to all four spatial frequencies tested (3, 6, 12 and 18 cycles per degree). (A) ROC when contrast sensitivity (CS) was measured in moderate lights. (B) ROC when CS was measured in dim lights (black trace) compared with CS measured in moderate lights (gray trace). AUC, area under the curve; Accy, accuracy.
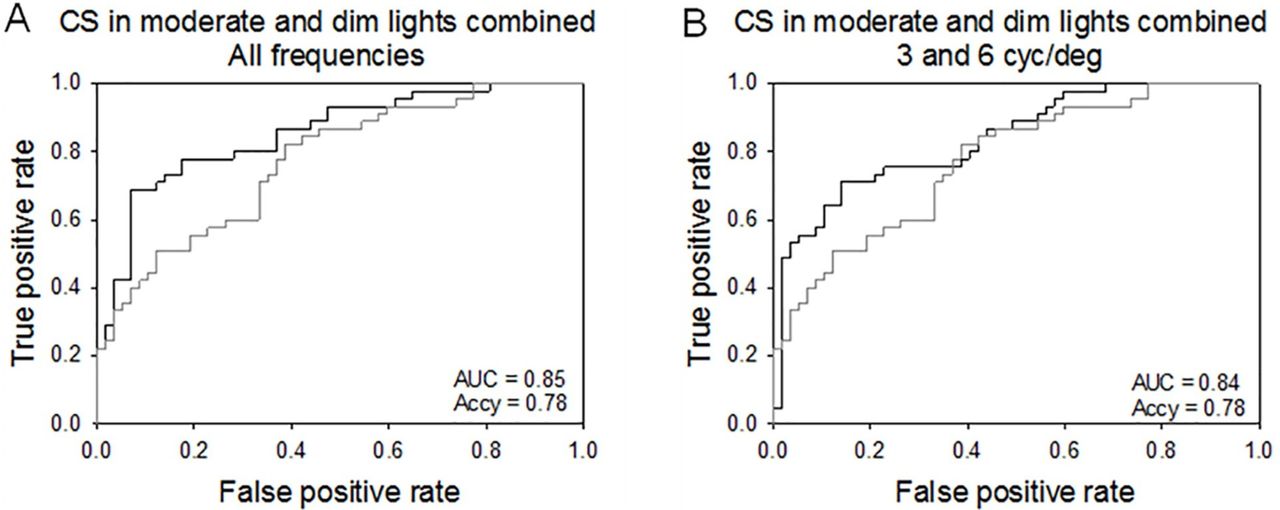
Next, we evaluated a model that included CS measures acquired in both moderate and dim background conditions (figure 3A). This model had an AUC value of 0.85 and an ACCY of 0.78. These values represent an approximately 10% improvement over the accuracy estimated for the first two models and reached the range of what is considered to be good predictive accuracy for a model. Notably, however, the total AUC value for the combined measure ROC curve was not statistically different compared with the ROC AUC values achieved using moderate alone (z=1.276, p>0.202) or dim alone (z=0.977, p>0.328). Although accurate, the model requires extensive CS data collection, from the two eyes, at four different spatial frequencies and two different illumination conditions. Therefore, we next investigated whether the number of input variables could be decreased without detriment to the overall accuracy of the model. We found that a ‘reduced’ model which included CS tests of only two frequencies, 3 and 6 cycles per degree in dim and moderate lights, resulted in an ROC with AUC value of 0.84 and ACCY of 0.78, consistent with the values obtained with the full model and in line with good predictive ability (figure 3B). The AIC for the ‘reduced’ model was 117.3 versus 128.8 for the full model, resulting in a 116-fold increase in relative information content, which is consistent with the notion that CS measured in response to a subset of spatial frequencies presented in dim and moderate backgrounds can be effectively used to classify diabetes in subjects without clinical retinopathy.

Receiver operating characteristic (ROC) curves for discriminating diabetic subjects without retinopathy from control subjects using a logistic regression model that combined contrast sensitivity (CS) values measured both in moderate and in dim lights. (A) ROC curve for a logistic model that includes CS values measured in response to all four spatial frequencies (black line) and (B) ROC curve for a model that includes CS to two spatial frequencies (3 and 6 cycles per degree). ROC for the model in photopic conditions is also indicated (gray traces, from figure 2). AUC, area under the curve; Accy, accuracy; cyc/deg, cycles per degree.
Conclusions
This prospective comparative study demonstrated that CS is impaired in diabetic subjects at an early stage, before any clinical signs of retinopathy were detected. These results are in general agreement with prior reports indicating that diabetic subjects with no clinical signs of DR can experience reductions in CS.9 12 13 23–29 However, our study indicates that the loss in CS depends on the illumination conditions and spatial frequency of the stimulus grating; CS was impaired in response to all spatial frequencies above 3 cycles per degree (the lowest spatial frequency tested in this study) in moderate background light condition, while CS was reduced over the entire spatial frequency range when tested in dim background condition.
In the clinic, CS is routinely determined using letters charts or sine-wave grating images with changing contrast. Letter charts, such as the Pelli-Robson chart provide a familiar and objective test procedure.30 Tests based on the identification of sine-wave gratings presented at different spatial frequencies and contrasts such as Vector Vision's CSV1000 or Vistech's VCTS CS tests are used to evaluate the CSF of the subject. This function has a well-defined band-pass shape in photopic light: CS peaks at intermediate frequencies (approximately 6 cycles per degree) and declines monotonically in response to higher and lower frequencies.21 The CSF is a product of optical and neural factors.31 32 Neurally, the CSF is shaped by the presence of multiple channels in vision, each selective to a different band of spatial frequencies33 and each band likely related to the receptive field properties of specific retinal ganglion cells.34 Histopathological and morphometric studies in humans as well as rat and mouse-induced models of diabetes determined that experimentally induced diabetes causes ganglion cell and inner retinal dysfunction,22 35–38 suggesting potential deficits in the processing of specific spatial frequencies. From a clinical perspective, the shape of the CSF is altered by selective deficits which may be associated with optical aberrations or with visual neuropathologies.39 40 Our study shows that the diabetic subjects with no retinopathy experience an almost uniform loss in CS across the spatial frequency range. These results indicate that diabetes does not selectively impair sensitivity of specific visual (frequency) pathways; rather, diabetes appears to reduce visual sensitivity by acting globally in the retina or central pathways, affecting all frequency pathways equally.
CSF did not change significantly in moderate or in dim background illuminations suggesting that glare produced by the background lights do not selectively diminish CS at moderate spatial frequency in diabetic subjects.40 These results are not entirely unexpected given that subjects with corneal pathology, lens opacity and history of cataract or corneal refractive surgery were excluded from the study. We also found that CS did not change with the duration of dark adaptation period prior to the measurements. This result suggests that the lower CS in diabetic versus control subjects cannot be explained simply in terms of the slower dark adaptation process and consequent extended desensitization period observed in diabetic subjects.22
Diabetes induced a uniform 0.16 log (44%) decline in CS at all frequencies tested. Although not clinically significant, the loss in CS at each frequency is statistically significant; but it is not sufficiently robust to independently discriminate diabetic from non-diabetic subjects. However, we found that a logistic model that combines CS measured at two different background illumination levels, moderate and dim, can be applied to accurately discriminate diabetic subjects without retinopathy from control subjects. The accuracy of our discrimination tests as determined by the AUC values in the ROC curves (0.85) was slightly lower than that reported earlier by Dhamdhere et al12 (0.88) using Smith-Kettlewell Institute Low Luminance (SKILL) scores to discriminate patients with diabetes without clinical retinopathy from control subjects. Interestingly, the two approaches combined the assessment of contrast vision in two different background conditions. The SKILL scores used cards with white or gray backgrounds to test CS,41 whereas our studies combined CS to gratings in dim and moderate background lights to obtain the highest accuracy. Together, these results indicate that (1) CS must be assessed at two different background conditions to discriminate an early diabetic phenotype, and (2) early diabetes differentially impairs the ability of the visual system to detect contrast at different light levels. While the effects of diabetes on photopic CS have been studied extensively, we know relatively little about its impact on mesopic and scotopic sensitivities.40 41 Future studies of scotopic and mesopic CS in diabetic subjects are needed to identify the dysfunctional neural mechanisms and improve diagnostic and treatment strategies.
There are some limitations in our study. Due to the limited number of subjects with type 1 diabetes, the association between the type of diabetes and CSF could not be evaluated. In addition, recent studies have shown reduced macular pigment optical density (MPOD) correlates with CS in normal and diabetic subjects.42–45 Measurement of MPOD may have shed mechanistic insights to the present study. Another limitation of the current study is that, although none of the subjects in our study exhibited any signs of DR, we did not perform spectral domain optical coherence tomography for detection of subclinical diabetic macular edema (DME).11
In summary, this study revealed CS reduction at all spatial frequencies in patients with diabetes with no DR. Evaluation of the loss in CS at two frequencies of 3 and 6 cycles per degree under moderated and dim light conditions can accurately differentiate patients with diabetes with no DR from normal subjects.
References
Footnotes
Contributors SS: Conceptualization, methodology, formal analysis, writing—original draft preparation, writing—review and editing. AR: conceptualization, methodology, data gathering, writing—original draft preparation—review and editing. AR: methodology, data gathering—writing. HS: methodology, writing—original draft preparation, writing—review and editing. MAA: resources, methodology, writing—original draft preparation. MM: resources, writing—original draft preparation. MY: formal analysis, writing—original draft preparation. MH: conceptualization, methodology, writing—original draft preparation. FAM: formal analysis, writing—original draft preparation. ES: conceptualization, methodology, formal analysis, writing—original draft preparation, writing—review and editing. HA: conceptualization, methodology, resources, formal analysis, writing—original draft preparation, writing—review and editing.
Funding ES was funded in part by the Lions of Central New York and by an unrestricted grant from Research to Prevent Blindness to the Department of Ophthalmology at SUNY Upstate Medical University.
Competing interests None declared.
Patient consent Obtained.
Ethics approval The study was approved by the Ethics Committee of the Ophthalmic Research Center affiliated to Shahid Beheshti University of Medical Sciences, Tehran, Iran.
Provenance and peer review Not commissioned; externally peer reviewed.
Data sharing statement All data can be shared in SPSS software.