Article Text

Abstract
Objective Prevalence of type 2 diabetes varies by region and ancestry. However, most guidelines for the prevention of diabetes mellitus (DM) are based on European or non-Hispanic white populations. Two ethnic minority populations—Mexican Americans (MAs) in Texas, USA, and South Indians (SIs) in Tamil Nadu, India—have an increasing prevalence of DM. We aimed to understand the metabolic correlates of DM in these populations to improve risk stratification and DM prevention.
Research design and methods The Cameron County Hispanic Cohort (CCHC; n=3023) served as the MA sample, and the Population Study of Urban, Rural, and Semi-Urban Regions for the Detection of Endovascular Disease (PURSE; n=8080) served as the SI sample. Using design-based methods, we calculated the prevalence of DM and metabolic comorbidities in each cohort. We determined the association of DM with metabolic phenotypes to evaluate the relative contributions of obesity and metabolic health to the prevalence of DM.
Results In the CCHC (overall DM prevalence 26.2%), good metabolic health was associated with lower prevalence of DM, across age groups, regardless of obesity. In PURSE (overall prevalence 27.6%), probability of DM was not strongly associated with metabolic phenotypes, although DM prevalence was high in older age groups irrespective of metabolic health.
Conclusion Our study provides robust, population-based data to estimate the prevalence of DM and its associations with metabolic health. Our results demonstrate differences in metabolic phenotypes in DM, which should inform DM prevention guidelines in non-European populations.
- Type 2 Diabetes
- Asian
- Mexican Americans
- Population-based Studies
This is an Open Access article distributed in accordance with the Creative Commons Attribution Non Commercial (CC BY-NC 4.0) license, which permits others to distribute, remix, adapt, build upon this work non-commercially, and license their derivative works on different terms, provided the original work is properly cited and the use is non-commercial. See: http://creativecommons.org/licenses/by-nc/4.0/
Statistics from Altmetric.com
Significance of this study
What is already known about this subject?
Global guidelines for the prevention and screening of diabetes mellitus (DM) are inadequate for non-European ancestry groups, and population-based data for specific ancestry groups populations are lacking.
What are the new findings?
Among Mexican Americans, good metabolic health regardless of obesity is associated with a low prevalence of DM; in South Indians, DM is highly prevalent even among those with otherwise good metabolic health and absence of obesity.
How might these results change the focus of research or clinical practice?
Our results will guide future longitudinal studies to clearly define the high-risk phenotype for DM among non-white populations.
Introduction
The prevalence of type 2 diabetes globally ranges from <5% in sub-Saharan Africa to >25% in the Western Pacific.1 Population-based studies have revealed particular geographic regions and ethnic groups with especially high burdens of diabetes mellitus (DM). Two of these studies, the Cameron County Hispanic Cohort (CCHC)—a population-based cohort of Mexican Americans (MAs) in the South Texas/Mexico border region—and the Population Study of Urban, Rural, and Semi-Urban Regions for the Detection of Endovascular Disease (PURSE)—a population-based study of the population of Chennai, Tamil Nadu, India—have high burdens of DM, but clinical correlates of DM in these populations have not been thoroughly characterized. The burden of disease in each cohort, otherwise of different ethnic and cultural backgrounds, may provide insight into diabetes risk stratification and the underlying metabolic drivers of diabetes in distinct populations.
The CCHC has produced results refining our understanding of DM in MAs. It has been shown that approximately half of the MA participants with DM had never been diagnosed,2 and that metabolic health has a stronger association with DM than obesity.3 The mean body mass index (BMI) in this cohort is approximately 31.5 kg/m2 with a prevalence of obesity (BMI ≥30) >50%.4 Likewise, the PURSE cohort has amassed a large sample of South Indian (SI) participants. The burden of diabetes in SIs is increasing,5 with an undefined burden of obesity. Moreover, other research has shown that genetic risk factors for DM discovered in white Caucasian populations do not correspond uniformly to MA and Asian groups,6 7 indicating that careful genotypic and phenotypic study of DM in diverse populations is needed.
Our two population-based cohorts of distinct ancestral composition provide excellent context to examine these differences. In this study, we sought to describe and compare the burden of DM in the CCHC and PURSE cohorts and evaluate its association with metabolic phenotypes.
Research design and methods
The CCHC and PURSE cohorts each sampled their populations with two-stage cluster sampling methodologies. In the CCHC (sampled from Brownsville, Harlingen, and Laredo, Texas), socioeconomic quartiles defined by the US Census served as the sampling strata, and US Census blocks served as sampling units, with all members (ages 18 and older) of households in selected blocks invited to participate. In PURSE (sampled from Chennai, Tamil Nadu), the target population was stratified by urbanicity (urban, semiurban, or rural). In the urban setting, the primary sampling unit was that of urban administrative units (‘divisions’). We selected 9 of 155 divisions, and in the second stage, the required number of clusters (streets) was selected by simple random sampling. In the semiurban region, the primary sampling unit was that of the village-level administrative units (‘town panchayats’). We selected 9 of 37 town panchayats and the required number of clusters (‘wards’) was selected by simple random sampling. In rural regions, the primary sampling unit was that of rural administrative areas (‘blocks’). We selected 5 of 27 blocks and required number of clusters (village panchayats) by simple random sampling. If the selected cluster was small, the immediate neighboring area of the selected cluster was included until the target sample size was achieved. The analyses take into account the complex sampling designs of each study, and all estimates are adjusted for the probability of selection by age and sex. Participants in each cohort are extensively phenotyped, including sociodemographic and health history questionnaires as well as clinical exams. Detailed methods for the CCHC and PURSE have been detailed elsewhere.8 9
Clinical definitions
DM was defined according to the American Diabetes Association 2010 Diagnostic Guidelines: HbA1c>6.5%, fasting glucose >120 mg/dL, currently taking diabetes medication, or diagnosed with DM by a physician. Hypertension was defined as systolic blood pressure >135 mm Hg, diastolic blood pressure >90 mm Hg, or taking antihypertensive medication. Elevated triglycerides were defined as fasting triglycerides>150 mg/dL; elevated LDL cholesterol >160 mg/dL; reduced HDL cholesterol <40 mg/dL (men) or <50 mg/dL (women).10 Elevated liver function tests (LFTs) were determined by aspartate aminotransferase (AST) or alanine aminotransferase (ALT) levels>40 mg/dL. Elevated insulin resistance is defined as levels greater than the 75th percentile in each cohort.
We excluded participants who (1) were diagnosed with DM prior to age 18, indicating probable type- 1 diabetes (n=5), (2) were missing crucial analysis variable at the time of analysis, and (3) who had clinical variables outside of reasonable ranges (total excluded=331). The CCHC is an ongoing cohort with continuing recruitment; therefore, certain laboratory measures were not assayed at the time of analysis and were excluded. PURSE, on the other hand, has closed recruitment and has complete data for all relevant variables. The analytic sample sizes were 3023 for the CCHC and 8080 for PURSE.
WHO officially recommends a cut-off of BMI≥30 for risk stratification for various chronic diseases, including DM. Several authors have argued that the BMI threshold for DM risk in South Asian (SA) populations should be lowered substantially, to between 19 and 24.7 9 11–14 However, many of these conclusions are based on migrant SA residents (in the UK and elsewhere), and no consensus has emerged for a high-risk cut-off, nor have any new guidelines formally adopted by WHO. For this study, we follow the consensus statement of >100 Indian medical professionals,15 which corresponds to the clinical consensus of the PURSE cohort research team in Chennai, BMI≥25.0. For all analysis, we have defined obesity as BMI≥30.0 in the CCHC and BMI≥25.0 in PURSE. For diabetes and blood lipids analyses, we incorporate medication data, where available. Elevated waist circumference was defined as >102 cm for men and >88 cm for women in the CCHC; and >90 cm for men and >80 cm for women in the PURSE cohort. For other clinical and epidemiological criteria, identical definitions have been used in each cohort.
Statistical methods
To produce valid estimates from the complex survey data, analyses were conducted separately in the CCHC and PURSE. Interpretation of significance of estimates takes into account the larger sample size of the PURSE cohort (ie, an identical effect size in each cohort may be significant in PURSE and non-significant in the CCHC, solely due to sample size). Analyses in the CCHC take into account the possible clustering effect of sampled individuals from the same census block or household; analyses in PURSE take into account the possible clustering effect of individuals from the same village. We calculated overall estimates of clinical and sociodemographic measures in each cohort, then compared participants with DM (for all clinical definitions, refer to online supplementary table 1) to those with no DM in each cohort using survey-based, weighted analysis. First, we estimated mean and SD for continuous variables,16 and proportions for categorical variables, for each DM group. Survey-based linear regression was used to calculate design-adjusted t-test results to compare mean values of continuous variables in the DM versus no DM groups; differences of least-square means in the DM versus no DM group with 95% CIs are presented. The Rao-Scott χ2 test was used to assess differences in proportions of categorical variables in diabetes groups; ORs with 95% CIs are presented.
Supplemental material
In order to describe the relationship of obesity and overall metabolic health to DM, we stratified the cohorts into four ‘metabolic phenotypes’, based on obesity and metabolic health criteria. Slightly modified from previous work,3 17 the phenotypes were defined according to the presence or absence of obesity and the presence or absence of four components of cardiometabolic health18: elevated systolic or diastolic blood pressure or use of antihypertensive medication, hypertriglyceridemia, reduced high-density lipoprotein levels, or insulin resistance. Metabolically healthy participants were defined as having less than two of the four cardiometabolic health abnormalities. Using these definitions, we stratified the CCHC and PURSE populations into four phenotypes: metabolically healthy, non-obese (MHNO); metabolically healthy, obese (MHO); metabolically unhealthy, non-obese (MUHNO); and metabolically unhealthy, obese (MUHO). We calculated and plotted the predicted probability of diabetes at each age for each of the four metabolic phenotypes using estimates from logistic regression; overall age-adjusted ORs for each metabolic phenotype are presented with MHNO as the reference group. Finally, the independent associations of DM with each individual component of obesity and metabolic health (obesity, hypertension, hypertriglyceridemia, reduced HDL, insulin resistance) were examined in each cohort, stratified by sex. The estimates for each component are adjusted for all other components, as well as age. We obtained ORs for the association and assessed significance using the Rao-Scott χ2 test at the 5% significance level.
Sensitivity analysis
Because it was suspected that the urban population in the PURSE cohort would have a significantly higher burden of chronic disease than the non-urban population,5 analysis was repeated excluding these participants (n=2121). An indicator variable for urban versus non-urban participants was used to determine domain-specific estimates in survey-based analysis.
Additionally, we sought to determine whether differences in age distribution between the cohorts would significantly impact the prevalence estimates. To evaluate this possibility, we directly age-standardized the prevalence estimates in PURSE using the CCHC population as the reference. We then compared these standardized estimates to those originally obtained.
Finally, for the definitions of our four metabolic health groups, we substituted waist circumference cut-offs for BMI cut-offs in the definition of obesity. In this new cut-off, elevated waist circumference is defined as >102 cm in men and >88 cm in women in the CCHC; and >90 cm in men and >80 cm in women in PURSE.15 Using these cut-offs, we re-evaluated the predicted probability of DM at each age group for each metabolic health group to determine whether results were substantially different than when using BMI cut-offs.
SAS V.9.4 Software for Windows was used for all analyses, and figures were developed using the matplotlib package for Python.19
Results
Overall cohort characteristics and associations with DM
The overall prevalence of DM was 26.2% in the CCHC and 27.6% in PURSE. When excluding urban participants in PURSE, the prevalence of DM was 27.4%. The mean age in the CCHC was 47.3 (range 18–93) years and in PURSE 43.8 (range 20–76) years. In figure 1, we present the proportions of male and female participants in each cohort with DM (black), impaired fasting glucose (IFG; hatches), and normal glucose metabolism (white). The prevalence of DM in men in both cohorts is >30%; in both cases, this is higher than the prevalence in women. Additionally, we note that the CCHC men have the smallest proportion of ‘healthy’ participants with no indications of IFG or DM, while women in the PURSE cohort have the highest proportion of ‘healthy’ participants. Overall, a greater proportion of participants in the CCHC have IFG compared with PURSE.
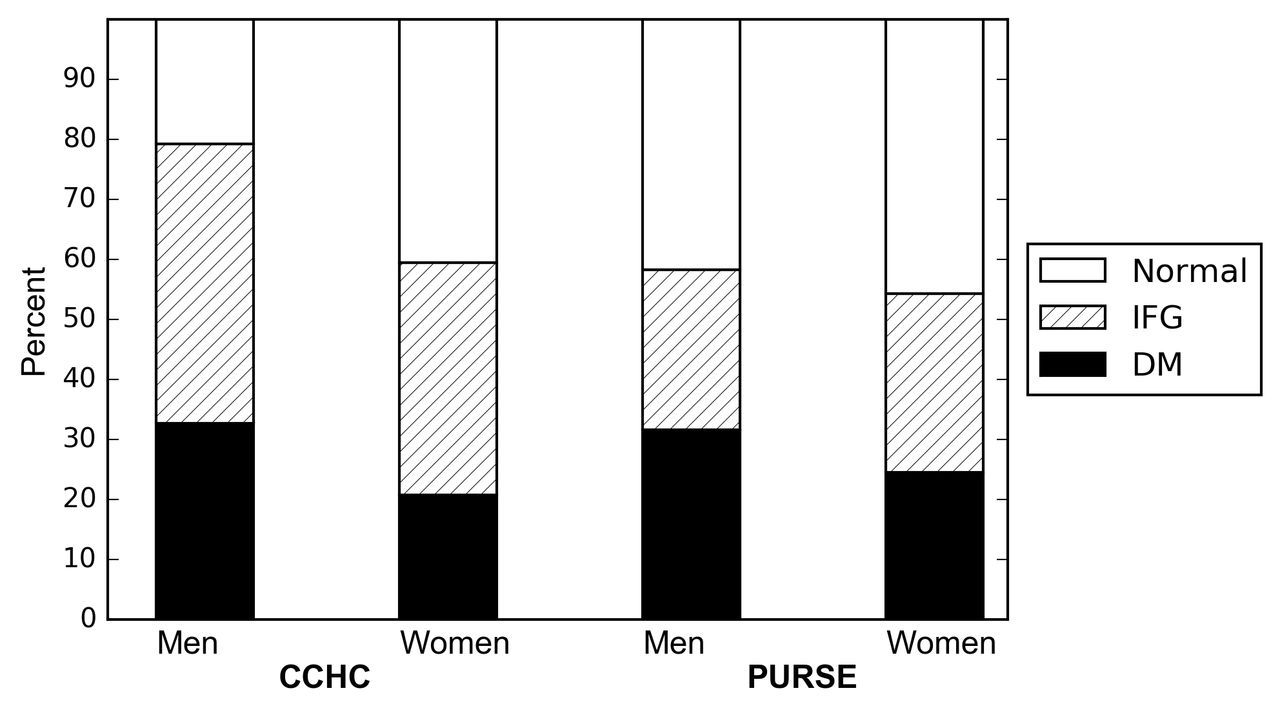
Proportion of participants with type 2 diabetes (diabetes categories are defined according to the American Diabetes Association 2010 Diagnostic Guidelines), impaired fasting glucose (IFG), and normal glucose metabolism, by sex: Cameron County Hispanic Cohort (CCHC) and Population Study of Urban, Rural, and Semi-Urban Regions for the Detection of Endovascular Disease (PURSE) cohorts. DM, diabetes mellitus.
Table 1 presents the characteristics of each cohort overall and stratified by DM status. In the CCHC, the overall prevalence of obesity was 54.1% and had a strong overall association with DM (OR 3.5, 95% CI 1.8 to 6.7). In PURSE, the overall prevalence of obesity was 46.4%, and the association with DM was weaker (OR 1.9, 95% CI 1.7 to 2.1). When examining associations of DM with continuous values for BMI and waist circumference, the associations are much stronger in the CCHC compared with PURSE (BMI difference=4.5 kg/m2 in the CCHC vs 1.7 kg/m2 in PURSE).
Demographic and clinical characteristics of the Cameron County Hispanic Cohort (CCHC) and Population Study of Urban, Rural, and Semi-Urban Regions for the Detection of Endovascular Disease (PURSE) cohorts, stratified by diabetes mellitus (DM) status according to the American Diabetes Association 2010 Diagnostic Guidelines
Measures of glucose control—mean fasting blood glucose and HbA1c—overall and by diabetes status were similar in the CCHC and PURSE. In contrast, direct measures of insulin (14.5 mg/dL (SD 12.3) in the CCHC versus 8.5 mg/dL (SD 7.3) in PURSE) and insulin resistance estimated by the homeostasis model of insulin resistance (HOMA-IR; 4.0 (SD 4.0) in the CCHC vs 2.3 (SD 2.2) in PURSE), appeared to be higher and more variable in the CCHC compared with PURSE. We examined continuous values of total cholesterol, high-density lipoprotein (HDL), calculated low-density lipoprotein (LDL), and triglycerides, as well as dichotomizations of each variable. Interestingly, the mean total cholesterol levels in the CCHC were significantly lower in the DM group (172.3 mg/dL) compared with the no DM group (189.8 mg/dL, difference −17.5, 95% CI −31.5 to −3.5). The opposite association was seen in PURSE, with significantly higher levels of total cholesterol in the DM group (186.3 mg/dL) than in the no DM group (174.1 mg/dL; difference 12.2, 95% CI 9.7 to 14.6). Mean triglyceride levels were higher in DM versus no DM in both cohorts, but the association appeared to be much stronger in PURSE (difference 45.5 mg/dL, 95% CI 38.0 to 53.0) compared with the CCHC (difference 20.2 mg/dL, 95% CI 9.1 to 49.5). A much greater proportion of participants had reduced HDL in PURSE (69.6%) than in the CCHC (38.2%).
Predicted probability of DM by metabolic health phenotype
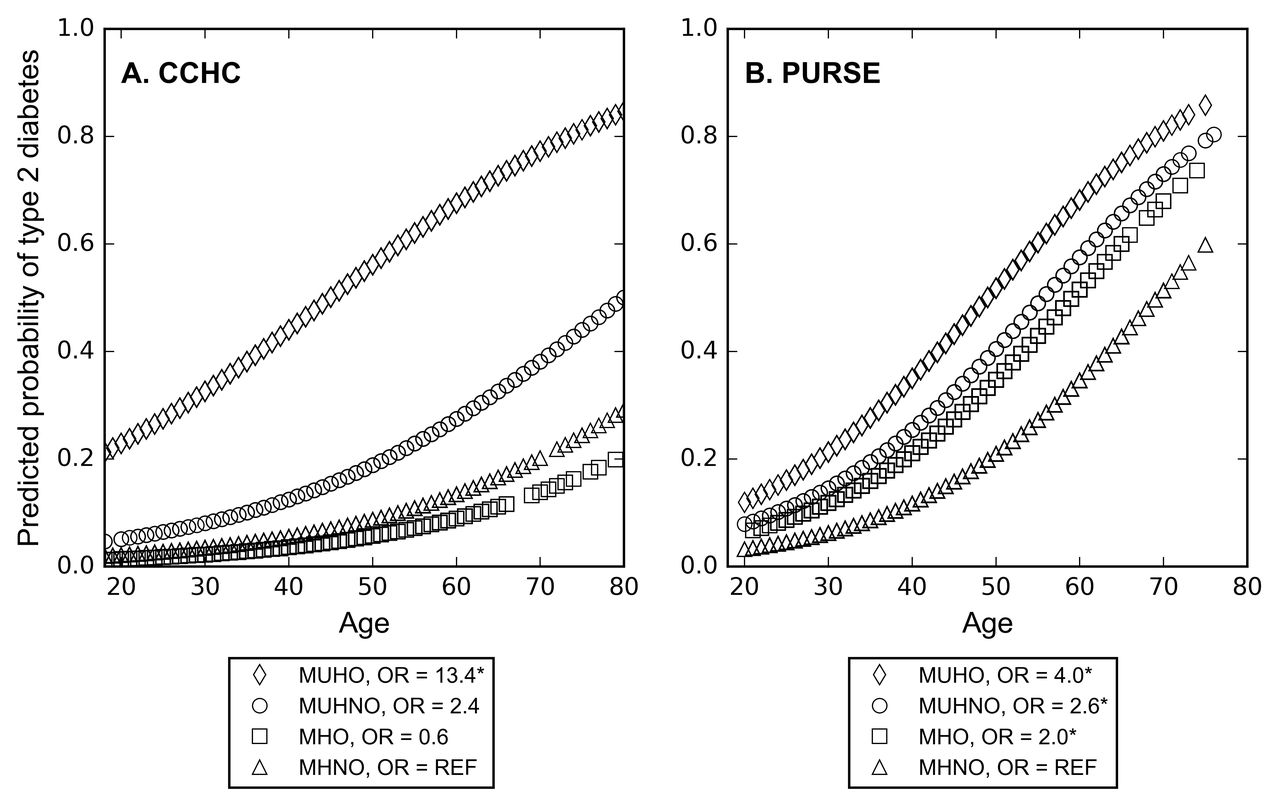
In figure 2, we present the predicted probability of DM in the four metabolic phenotypes, at each age, for the CCHC and PURSE cohorts. The estimates of predicted probability were generated using logistic regression of DM on the metabolic phenotypes and age; overall ORs for the four levels of the metabolic phenotypes (referent=MHNO) are presented in the legend. In both cohorts, the MHNO group has the lowest predicted probability of DM at most ages. In the CCHC, we observe that the MUHO participants have a much higher predicted probability of DM compared with the other groups, a pattern not as clearly seen in PURSE. Both of the metabolically healthy groups (MHO, MHNO) have low predicted probabilities of DM across all ages in the CCHC. PURSE, in contrast, shows striking increases of predicted probabilities of DM at older age, irrespective of the metabolic health group. We then calculated the actual prevalence of DM for each metabolic phenotype, by age quartile, and determined that the DM probability estimates obtained in logistic regression were reasonable (online supplemental figure 1). We also used waist circumference cut-offs instead of BMI cut-offs to calculate predicted probability by age in order to evaluate sensitivity of predictions to adiposity measures. The plots based on waist circumference are very similar in PURSE (online supplemental figure 2). In the CCHC, MUHNO participants have a clearly intermediate probability of DM (between the MUHO and the metabolically healthy participants).
Supplemental material
Supplemental material

![[bmjdrc-2017-000436-SP3.jpg]](https://drc.bmj.com/content/bmjdrc/6/1/e000436/DC3/embed/inline-supplementary-material-3.jpg?download=true)
Predicted probability of type 2 diabetes by age and four metabolic phenotypes, from logistic regression: Cameron County Hispanic Cohort (CCHC) and Population Study of Urban, Rural, and Semi-Urban Regions for the Detection of Endovascular Disease (PURSE) cohorts. *Statistically significant (P<0.05) OR obtained from design-based logistic regression, adjusting for age, with MHNO as reference.DM, diabetes mellitus; OR, ORs for DM versus no DM; MHO, metabolically healthy, obese; MHNO, metabolically healthy, non-obese; MUHNO, metabolically unhealthy, non-obese; MUHO, metabolically unhealthy, obese.
Table 2 breaks the four metabolic phenotypes into their definitional components (obesity, hypertension, hypertriglyceridemia, reduced HDL, and insulin resistance) in each cohort, stratified by sex. The ORs indicate independent associations of each metabolic characteristic with DM, adjusting for age and all other metabolic health characteristics. In the CCHC, it is apparent that the independent association between obesity and DM is strong, and modified by sex (ORmen 5.1, 95% CI 1.3 to 20.9; ORwomen 1.7, 95% CI 0.7 to 4.3), where the association is non-significant in female participants. A similar pattern of sex-modified association is seen in the CCHC for hypertriglyceridemia and reduced HDL. An association with insulin resistance is present in all participants, as expected, although it is strongest in PURSE females (OR 5.0, 95% CI 3.8 to 6.9). In PURSE, the association between obesity and DM is weaker overall, with no apparent sex interaction (ORmen 1.4, 95% CI 1.1 to 1.7; ORwomen 1.4, 95% CI 1.1 to 1.8). Other associations in PURSE are between hypertension and DM in women, but not men (ORmen 1.0, 95% CI 0.7 to 1.4; ORwomen 1.6, 95% CI 1.4 to 1.9), and between hypertriglyceridemia and DM (ORmen 1.7, 95% CI 1.5 to 2.0; ORwomen 1.9, 95% CI 1.6 to 2.3). Additionally, for both sexes in PURSE, there was no detectable association between abnormal HDL and DM, in contrast to the strong association seen in CCHC men (OR 3.4, 95% CI 1.3 to 8.8).
Prevalence of diabetes mellitus (DM) with and without cardiometabolic comorbidities by sex, Cameron County Hispanic Cohort (CCHC) and Population Study of Urban, Rural, and Semi-Urban Regions for the Detection of Endovascular Disease (PURSE) cohorts
Conclusions
We have presented a phenotypic comparison of two ethnically distinct populations with high burden of DM. Previous research and reviews of DM control strategies have shown that cultural influences are a crucial part of preventing DM and its complications.20 21 The prevalence of DM is increasing in both MA2 and SI5 populations, so the challenge now is to understand the phenotypic correlates of DM risk and to improve risk stratification in non-European populations. These differences are important because it is widely understood that ancestral genetic predisposition plays a non-trivial and varying role in the pathogenesis of DM.6 22 For instance, it has been shown that Amerindian ancestry in MAs has a significant positive correlation with HOMA-IR measures of insulin resistance,23 which was reflected in the present study.
The motivation for this study was the opportunity to study two population-based studies from distinct ethnic backgrounds with comparable burdens of DM in order to improve our understanding of diabetes risk profiles and risk stratification. The first important finding was the differing proportions of DM, IFG and normal glucose metabolism profiles (figure 1), in which we show that MA men had the highest proportion with diabetes or IFG. This corroborates recent research in the CCHC that has shown substantial metabolic health abnormalities in MA men, across age groups.24 It is also important to note that a larger proportion of CCHC participants had IFG and are thus at elevated risk of converting to DM. In addition, we showed that fasting insulin levels were markedly higher in the CCHC than in PURSE; previous research has shown that SAs tend to have higher fasting insulin than other ethnic groups (most research comparing to European Caucasian groups).5 Insulin levels are associated with central adiposity, and we have shown that, among participants with good metabolic health, central obesity is modestly associated with DM in PURSE (OR 2.0) while no association was detected in the CCHC (OR 1.0) (online supplemental figure 1). Indeed, previous research has revealed that insulin resistance in the SA groups is more sensitive to changes in central adiposity relative to black and white groups.5 25
We found an 8% difference in obesity prevalence in the cohorts overall (54.1% in the CCHC vs 46.4% in PURSE), based on our ethnicity-specific cut-offs. The classic understanding of the SI population has been that a high burden of DM exists against a low prevalence of obesity,26 but we have shown that there is in fact a high prevalence of obesity, and this previous misconception was due to an insensitive BMI cut-off. Prevalence of obesity was high (44.5%) even in the non-urban population of PURSE, suggesting that urbanization is only one component of the epidemiological transition in SI populations.5
The predicted probabilities of DM (figure 2 and online supplemental figure S1) suggest differences in the anthropometric and metabolic correlates of DM between cohorts. Most strikingly, metabolically healthy participants in PURSE have high predicted probabilities of DM at older ages. This was not the case in the CCHC, where metabolically healthy participants have a low predicted probability of DM, even at older ages. There are likely other predictors, besides obesity and metabolic health,27 which allow for better risk stratification in the PURSE population.
Overall, we observed a stronger independent association between DM and obesity in the CCHC compared with PURSE after controlling for metabolic health and age, particularly among men (table 2). Our results are bolstered by the evidence that both categorical and continuous parameterizations of BMI were more strongly associated with DM in the CCHC compared with PURSE, suggesting that the differing associations between obesity and DM are robust to different cut-offs. Research in the CCHC3 and elsewhere28 29 has suggested that metabolic health, regardless of obesity, is the primary component of DM risk; other authors have suggested that obesity is the primary driver in some populations.30 We have shown that metabolically healthy participants in the CCHC have similar probabilities of DM (figure 1, online supplemental figure S1), regardless of obesity. Therefore, our results are consistent with previous research,3 28 but we add that obesity among metabolically unhealthy participants is associated with vastly increased probability of DM, while obesity among metabolically healthy participants may have little effect on DM (figure 2).
Our finding that total and LDL cholesterol levels in the CCHC are lower in participants without DM compared with those with DM, in contrast to PURSE, was unexpected. We hypothesized that this may be due to qualitative confounding of lipid-controlling medication, which may be associated both with DM and with cholesterol levels (due to dual diagnosis and treatment). However, the difference was similar after controlling for lipid-controlling medication use in logistic regression (online supplemental table 2). In fact, the direction of the association was robust after transforming the cholesterol variables and adjusting for medication, insurance status, sex, and age.
Supplemental material
It is likely that some cases of DM are due to latent autoimmune diabetes in adults (LADA), which is the third most common cause of DM after type 2 and type 1.31 We do not presently have data on glutamic acid decarboxylase autoantibodies or C-peptide levels, which are necessary to distinguish LADA from type 2 diabetes, in either cohort. However, research in a Western Indian population showed that LADA makes up approximately 5% of the overall diabetes population,32 and preliminary data in the CCHC suggest that 2.2% of a sample of participants with pre-diabetes have characteristics of LADA (unpublished data). The inability to distinguish LADA introduces phenotypic heterogeneity and likely attenuates the associations between obesity/metabolic variables and DM.
Other limitations of this early work include differing study design and data collection methods in the two cohorts. We did not explicitly test for differences in the values of variables in the CCHC compared with PURSE due to the differing cluster sampling designs in each. However, the differences we observed were striking, and the magnitude of differences between the cohorts were large. Additionally, we interpret all of the biological variables with caution because the tests were conducted in different labs using slightly different methods. Further, differences in the age structure of the two cohorts may affect comparison of prevalence. However, after directly age-standardizing prevalence estimates in the PURSE cohort, with CCHC as the standard population (results not shown), we found an age-adjusted, design-based prevalence of DM in PURSE of 27.7%, nearly identical to the crude estimate (27.6%). Therefore, we conclude that differences in age structure do not sufficiently explain our results. Finally, these are cross-sectional data and do not allow us to make inferences about disease risk or establish causality.
Most published guidelines and genetic risk profiles for DM arise from white populations, and there is a need for further study in other ancestral groups. Our analysis provides evidence of a high burden of DM in both MA and SI populations—especially among men—and distinct metabolic profiles. The cross-sectional, population-based cohort designs allow for a valid estimate of prevalence in the respective populations, which is not possible with an opportunistic sample or case–control analysis. Importantly, we have shown that, in contrast to previous literature, the population prevalence of obesity using appropriate BMI cut-offs in urban and non-urban SIs is quite high. We have shown that the characteristics and possibly the metabolic drivers of DM vary substantially between two populations, which has broad implications for future prevention research and practice. Additional strengths of this study include the large sample sizes in both cohorts and the similar time periods of data collection. We believe that these results suggest important underlying genetic differences that differentially predispose DM in MA and SA populations with or without obesity and metabolic dysfunction. Future studies examining the nutritional epidemiology of the two populations, as well as ethnicity-specific genetic association studies for DM, are crucial to deepening our understanding of the prevention and screening of DM in diverse groups.
Acknowledgments
For the CCHC study, the authors thank Rocío Uribe and her team, who recruited and documented the participants. They also thank Israel Hernández for data management, Marcela Morris and other laboratory staff for their contributions, and Christina Villarreal and Norma Pérez-Olazarán for administrative support. They thank the Valley Baptist Medical Center in Brownsville for housing the Clinical Research Unit of the CCHC. Finally, they thank their participants, who made this research possible. For the PURSE study, the authors thank the entire study team and collaborators, as well as the many participants and their families.
References
Footnotes
Contributors GPW compiled and analyzed data, and drafted the manuscript. MHR contributed statistical expertise and edited the manuscript. SPF-H is the principal investigator of the CCHC, and contributed expertise and editing to the manuscript. JBMcC provided clinical expertise and edited the manuscript. ML contributed to the discussion and revised the manuscript. ACC contributed expertise and edited the manuscript. ST is the principal investigator of the PURSE-HIS cohort. MT conceived the study and contributed expertise to the manuscript.
Funding The CCHC was supported by the Center for Clinical and Translational Sciences, which is funded by National Institutes of Health Clinical and Translational Award no. UL1 TR000371 from the National Center for Advancing Translational Sciences. Gordon Watt was supported by a the Predoctoral Fellowship, University of Texas School of Public Health Cancer Education and Career Development Program - National Cancer Institute/NIH Grant R25 CA057712. The PURSE-HIS study was supported by a grant from the Drugs and Pharmaceutical Research Program under Technology Development and Transfer Division, Department of Science and Technology, Government of India, project no. VI-D&P/151/06-07/TDT, and by Sri Ramachandra University.
Disclaimer The content is solely the responsibility of the authors and does not necessarily represent the official views of the National Center for Advancing Translational Sciences, National Cancer Institute, National Institutes of Health, or the Government of India.
Competing interests None declared.
Patient consent Not required.
Ethics approval The CCHC has been approved by the Committee for the Protection of Human Subjects at the University of Texas Health Science Center at Houston, and PURSE has been approved by the Institutional Ethics Committee of Sri Ramachandra University.
Provenance and peer review Not commissioned; externally peer reviewed.
Data sharing statement Analytic data sets for the CCHC and PURSE are available upon request from the principal investigators of the respective cohorts (CCHC, SPF-H; PURSE, MT). SAS code for data management and analysis are available from the corresponding author (SPF-H).