Article Text

Abstract
Objective Obstructive sleep apnea (OSA) is common among adults with diabetes. However, little is known about the impact of OSA treatment on DNA methylation levels. The purpose of this study is to explore changes in DNA methylation levels among adults with these conditions enrolled in a randomized controlled trial.
Research design and methods Participants were randomized to continuous positive airway pressure (CPAP) treatment or sham-CPAP placebo for 12 weeks. All participants received diabetes education and counseling. At baseline and 12 weeks, white blood cell DNA methylation levels for five candidate genes (ANGPTL4, DAPK3, KAT5, PER1, and TNFAIP3) and hemoglobin A1C (A1C) levels were obtained from blood. The Pittsburgh Sleep Quality Index (PSQI) and the Epworth Sleepiness Scale (ESS) assessed sleep quality and daytime sleepiness, respectively. T-tests examined within-subject changes from baseline to 12 weeks. Regression analyses explored associations between DNA methylation changes and baseline variables, minutes of therapeutic CPAP use, and changes in A1C levels, PSQI scores, and ESS scores.
Results Participants (n=10) were 70% female, 80% white, and 61.7±7.9 years old. Among all participants from baseline and 12 weeks, TNFAIP3 and PER1 DNA methylation levels decreased. At baseline, PER1 methylation levels were significantly higher in males and sex-based difference in methylation level changes was observed from baseline to 12 weeks. Changes in DNA methylation levels were not associated with minutes of therapeutic CPAP use or changes in A1C, PSQI scores, and ESS scores.
Conclusions While DNA methylation level changes were observed in the study, the causal mechanism is unclear and additional work is needed. Although the methylation changes were small, the long-term effects are unknown.
- obstructive sleep apnea syndrome
- type 2 diabetes
- adult
- intervention
This is an open access article distributed in accordance with the Creative Commons Attribution Non Commercial (CC BY-NC 4.0) license, which permits others to distribute, remix, adapt, build upon this work non-commercially, and license their derivative works on different terms, provided the original work is properly cited, appropriate credit is given, any changes made indicated, and the use is non-commercial. See: http://creativecommons.org/licenses/by-nc/4.0/.
Statistics from Altmetric.com
Significance of this study
What is already known about this subject?
There is a significant relationship between type 2 diabetes mellitus (T2DM) and obstructive sleep apnea (OSA); however, the exact mechanisms behind this phenomenon are unknown.
Recent studies have looked into the genetics of OSA to understand the precise mechanisms of the disorder and the relationships between gene methylation/expression and OSA/T2DM.
What are the new findings?
In this pilot study, participants experienced decreased TNFAIP3 and PER1 methylation which are genes related to inflammation reduction and circadian rhythms/metabolic homeostasis, respectively.
Males had increased methylation of PER1, indicating a possible reduction in this gene’s activity, while females experienced decreased methylation of this gene.
How might these results change the focus of research or clinical practice?
Despite a small sample size, the observed large effect sizes in PER1 and TNFAIP3 methylation changes and differences in PER1 methylation changes by sex may guide the objectives and design of future studies.
Future larger studies should explore the causal mechanisms for methylation changes, relationships between baseline methylation levels and clinical outcomes, and the long-term implications of methylation changes.
Introduction
Obstructive sleep apnea (OSA) is a disorder characterized by upper airway obstruction while sleeping, resulting in intermittent apneas and hypopneas.1 Manifestations of OSA include recurrent hypoxia, decreased intrathoracic pressure, and sleep fragmentation.1–3 OSA is characterized by chronic intermittent hypoxia leading to oxygen saturation as low as 50%.2 3 Airway obstruction leads to hypercapnia and chemogenic activation of the autonomic nervous system, resulting in sleep fragmentation.1–3 In addition, OSA leads to (1) increased oxidative stress and the presence of reactive oxygen species, (2) inflammation due to the activation of nuclear factor kappa B (NF-kB) and tumor necrosis factor alpha (TNF-α), and (3) sympathetic nervous system stimulation through changes in neurotransmitter levels.2 For adults aged 30–70, 13% of males and 6% of females have moderate to severe OSA.1
Continuous positive airway pressure (CPAP) is a treatment for OSA that decreases the frequencies of apnea and hypopnea while sleeping. Positive airway pressure is used to keep the airway open, decreasing the severity of the signs and symptoms of OSA.2 3 This leads to lower levels of NF-kB, TNF-α, triglycerides, total cholesterol, and sympathetic activation, and has been shown to have positive effects on glucose metabolism.1 3 4
OSA is closely associated with obesity, cardiovascular disease, and markers of metabolic syndrome including hyperglycemia, hypertension, dyslipidemia, inflammation, and obesity.1 5 There is a significant relationship between type 2 diabetes mellitus (T2DM) and OSA, as OSA is three to six times as prevalent in those with T2DM.6–8 However, the particular mechanisms behind this phenomenon are unknown.2 Obesity is a comorbidity for both conditions, although not the only link. Sympathetic nervous system activity related to OSA is associated with islet cell dysfunction, insulin resistance, glycogenolysis, and gluconeogenesis, all hallmarks of T2DM.2–4 Chronic intermittent hypoxia is associated with markers of T2DM, demonstrated by the insulin resistance and beta cell dysfunction displayed by healthy participants after 6 hours of intermittent hypoxia.1 In addition, insulin and improvements in glucose metabolism are related to increased oxygen saturation during sleep.1 4
Recent studies have looked at the genetics of OSA in order to understand the precise mechanisms of the disorder and the relationships between gene methylation/expression and OSA/T2DM.2 9–11 DNA methylation impacts gene expression by altering its transcription. DNA methylation and expression are not synonymous, yet changes in DNA methylation can lead to changes in gene expression.12 Candidate genes shown to be associated with OSA and T2DM include angiopoietin-like 4 (ANGPTL4), death-associated protein kinase 3 (DAPK3), K(lysine) acetyltransferase 5 (KAT5), period 1 (PER1), and tumor necrosis factor alpha-induced protein 3 (TNFAIP3).9–11 These genes influence apoptosis, cell cycles, sleep, inflammation, and metabolism.9–11
Given the complex nature of OSA, T2DM, and the genetic mechanisms involved in these conditions, the purpose of this pilot study was to explore the effects of CPAP and diabetes education on gene methylation and other measures related to these disorders. The primary aim of the study was to explore changes in white blood cell DNA methylation levels between baseline and 12 weeks in selected candidate genes and to calculate effect sizes for future studies. Secondary aims included exploring associations between methylation changes and (1) baseline variables (ie, sex, apnea-hypopnea index (AHI), body mass index (BMI)), (2) dose of therapeutic CPAP, (3) changes in glycemic control (A1C levels), (4) changes in sleep quality (Pittsburgh Sleep Quality Index (PSQI) scores), and (5) changes in daytime sleepiness (Epworth Sleepiness Scale, ESS).
Materials and methods
Design and sample
This was a pilot descriptive, within-subjects, repeated measures observational study. Participants were recruited from the Diabetes Sleep Treatment Trial (DSTT; principle investigator (PI): ERC, R01DK096028; NCT01901055). The purpose of the DSTT was to determine if participants with coexisting OSA and T2DM who received CPAP and diabetes education had better self-management and glycemic control compared with participants in the control group who received sham-CPAP (non-therapeutic) and diabetes education.13 The diabetes education in the DSTT consisted of two individualized sessions and three follow-up phone calls with a diabetes educator, who was blinded to treatment group assignment.
Inclusion criteria for the DSTT consisted of being age 18 years or older, willing to be randomized to CPAP or sham-CPAP treatment, presence of T2DM with suboptimal glucose control (A1C≥6.5%), OSA with an AHI≥10, and CPAP naive. Exclusion criteria from the parent study included (1) A1C>11%; (2) sleep duration <4 hours per night; (3) changes in diabetes oral meds or greater than 10% change in insulin during the last 3 months; (4) person residing in the household with CPAP treatment; (5) acute medical or surgical conditions or hospitalization ≤3 months, (6) employed in safety sensitive job (ie, truck driver or airline pilot); (7) regular use of hypnotic or alerting; (8) ‘at risk’ or ‘heavy’ alcohol consumption; or (9) pregnancy. The full set of exclusion criteria has previously been published.13 Exclusion criteria were determined to maintain subject safety and study integrity.
Study procedures
Participants enrolled in the DSTT were explained the purpose of this ancillary study by a member of the DSTT research team. If interested, he or she provided his or her contact information with permission to be contacted by the PI of this ancillary study. Several days prior to the scheduled history and physical portion of the DSTT, the PI called the potential participant and explained the purpose of the study. If the potential participant was interested, the PI met the individual at the pre-CPAP/sham-CPAP titration history and physical evaluation. Written informed consent was obtained to use the data obtained from the parent study and blood samples were drawn. Approximately 12 weeks later at a follow-up assessment for the DSTT, additional blood samples were obtained. At both intervals, samples were drawn between the late morning and early afternoon, with collection times ranging from approximately 09:30 to 14:15. At follow-up, each participant’s blood sample was collected within approximately 1 hour of his or her baseline collection time. For example, a baseline blood sample was obtained at 11:45 and 12 weeks later the follow-up sample was obtained at 11:00. All samples were stored in a −80° freezer until processing.
Measures
OSA severity
AHI was measured in a home sleep study via the ApneaLink Pro device (ResMed, San Diego, California, USA). This device measures airflow from a nasal cannula connected to a pressure transducer and has a finger oximeter to measure oxygen desaturations. OSA severity is classified as ‘mild’ (AHI=5–14 events/hour), ‘moderate’ (AHI=15–29 events/hour), or ‘severe’ (AHI≥30 events/hour).14 Previous studies have confirmed the sensitivity (82.1% for an AHI≥10), specificity (83.9% for an AHI≥10), and reliability (Pearson correlation r=0.89) for the ApneaLink Pro compared with full laboratory polysomnography tests.15 16 AHI was collected as part of the inclusion criteria for the DSTT.
Sleep quality
The PSQI assessed participants’ sleep patterns, quality and duration. The PSQI global score comprised seven components: subjective sleep quality, sleep latency, sleep duration, habitual sleep efficiency, sleep disturbances, use of sleeping medication, and daytime dysfunction. Higher scores indicate poorer sleep quality. Scores of 5 or greater indicate poor sleep quality and have a diagnostic sensitivity of 89.6% and specificity of 86.5%. The PSQI has a Cronbach’s alpha of 0.83 and global scores have Pearson correlations r=0.85.17
Sleepiness
The ESS assessed participants’ subjective daytime sleepiness. This questionnaire requires participants to use a Likert scale to rank their chances of dozing or sleeping during eight daytime activities. Participants assign one of four scores to each situation: 0=would never doze, 1=slight chance of dozing, 2=moderate chance of dozing, and 3=high chance of dozing.18 Total scores, the sum of the eight item scores, range from 0 and 24 with total scores greater than 10 indicating excessive daytime sleepiness. Total scores 17 or greater indicate pathological sleepiness.19 The ESS has a Cronbach’s alpha between 0.73 and 0.86.19 The ESS is the recommended tool for assessing sleepiness in persons with OSA based on the Scottish Intercollegiate Guidelines Network.18
Clinical variables
Height and weight were measured and BMI (kg/m2) was calculated at baseline. A1C levels were collected at baseline and 12 weeks. A1C levels were analyzed by the University of Pittsburgh Medical Center’s Clinical Chemistry Laboratory.
Minutes of therapeutic CPAP use
EncoreAnywhere (Philips, Amsterdam, The Netherlands) is a secure, remote system that was used to assess CPAP wear time among the individuals randomized to the treatment group. CPAP ‘dose’ was reported as the average number of minutes of therapeutic (active CPAP) per night; persons on sham-CPAP were considered to have ‘0’ min of treatment.
Methylation levels
Gene methylation data were collected using the EpiTect Methyl II PCR Array System (SABiosciences/Qiagen) on DNA extracted from white blood cells. This system uses methylation-sensitive and methylation-dependent enzymes and PCR to determine levels of methylation by quantitative PCR.20 The specific CpG islands and corresponding catalog numbers examined were: (1) ANGPTL4 CpG island 106986, catalog number EPHS106986-1A; (2) DAPK3 CpG islands 106887 and 106888, catalog numbers EPHS106887-1A and EPHS106888-1A, respectively; (3) KAT5 CpG island 102491, catalog number EPHS102491-1A; (4) TNFAIP3 CpG island 112782, catalog number EPHS112782-1A; and (5) PER1 CpG islands 105730 and 105731, catalog numbers EPHS105730-1A and EPHS105731-1A, respectively. Methylation-sensitive (catalog number EPHS115450-1A) and methylation-dependent (catalog EPHS115451-1A) control assays were performed on a subset of eight samples. ABI PRISM 7000 Sequence Detection System (Applied Biosystems, Foster City, CA) was used to generate the PCR data which were analyzed using the EpiTect Methyl II PCR Array System. The ΔCt-based calculations from the raw threshold cycle (Ct) to determine the DNA methylation status of the specific CpG islands were performed automatically using an Excel template provided by the system. The DNA was extracted from white blood cells, so the methylation changes represent those reflected in the composite of white blood cells. Therefore, the methylation changes represent blood-based biomarkers, and not necessarily mechanisms.
Data analysis
SPSS V.24 (IBM) was used for the analyses. Descriptive statistics, mean (M) and SD or the total number and percentage, were calculated. The degree of significance was set at p<0.05 (two sided). Given the exploratory nature of the study, the p value was not adjusted for multiple comparisons. Paired t-tests were used to explore changes in gene methylation, A1C levels, and PSQI scores from baseline to 12 weeks. To assist with interpretation of the methylation level changes, percent change values from baseline to 12 weeks were calculated. Regression analyses were used to explore associations between methylation changes and (1) baseline variables (sex, AHI, BMI), (2) mean minutes of therapeutic CPAP per night, (3) glycemic control (change in A1C levels), (4) changes in sleep quality (PSQI scores), and (5) daytime sleepiness (change in ESS). Baseline AHI, BMI, mean minutes of therapeutic CPAP, and A1C levels were treated as continuous variables. Effect sizes were used to show differences from baseline to postintervention and were calculated by subtracting the mean baseline scores from the mean scores at 12 weeks, and then dividing the difference by the pooled SD.21 The relative magnitude of change was based on Cohen’s definitions of a small (0.2), moderate (0.5), and large (>0.8) effect size.22
Results
Demographics and baseline characteristics
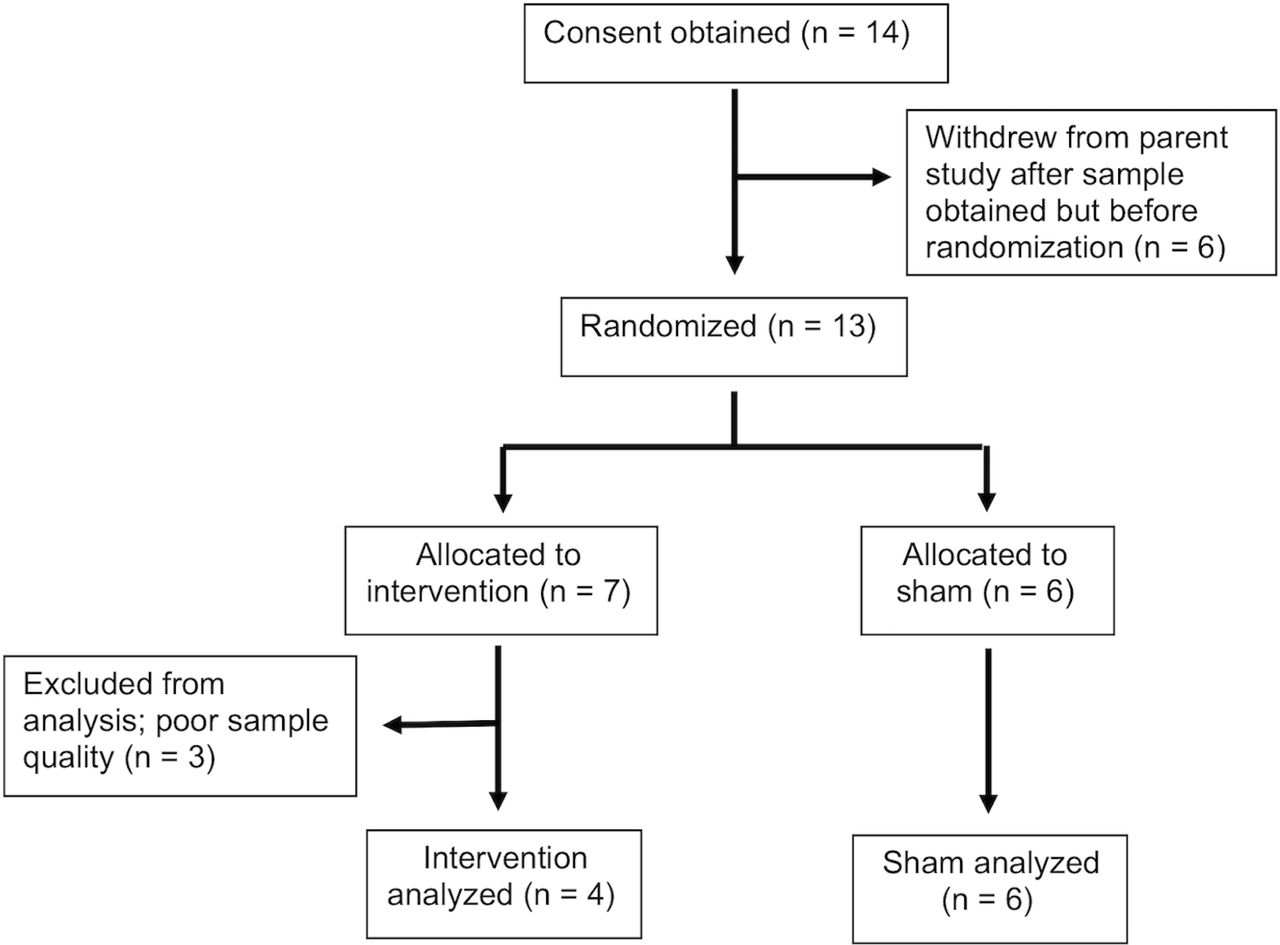
Informed consent was obtained from 14 individuals. One individual withdrew from the parent study after the baseline sample was obtained. Follow-up methylation levels for three participants could not be determined due to poor sample quality. Therefore, 10 individuals had blood samples for the methylation analyses at both time points. Four participants were in the intervention group and six were in the control group (figure 1). The sample (see table 1) consisted of mostly middle-aged (M=61.7, SD=7.9 years) females (70%, n=7). The majority of participants were white (80%, n=8), married or partnered (70%, n=7), and retired (80%, n=8) with moderate sleep apnea (AHI M=20.9, SD=12.4) and a mean BMI indicative of class 2 obesity (BMI M=35.1, SD=7.8). Mean ESS scores were 8.8 (SD=4.8) with three individuals with scores >10. For the individuals in the intervention group, the mean minutes of therapeutic CPAP was M=316.8, SD=50.5 min per night, range 224–355.

Consolidated Standards of Reporting Trials (CONSORT) diagram.
Participant characteristics (n=10)
DNA methylation level changes
Among all participants, there were statistically significant changes in TNFAIP3 and PER1 CpG island 105731 methylation between baseline and 12 weeks (M=0.00103, SD=0.00034 vs M=0.00059, SD=0.00030; p=0.006 and M=0.00152, SD=0.00010 vs M=0.00065, SD=0.00030; p=0.017, respectively). This represents a decrease in methylation of 42.7% for TNFAIP3 and a decrease of 57.2% for PER1 CpG island 105731. The effect sizes were large, 1.25 for TNFAIP3 and 1.00 for PER1 CpG island 105731.
In terms of TNFAIP3 methylation, all participants showed decreased gene methylation except for one individual who had modest increased methylation (figure 2A). Although the sample was small, all three males and six females experienced lower levels of gene methylation at 12 weeks compared with baseline. In addition, all but one participant experienced hypomethylation of PER1 CpG island 105731 (figure 2B). One male participant had a very slight increase in methylation while another individual had a sharp decline in methylation of PER1 CpG island 105731.

CpG islands with statistically significant changes in DNA methylation levels. (A) Plot differences for participants’ TNFAIP3 CpG island 112782 methylation at baseline and 12 weeks. (B) Plot differences for participants’ PER1 CpG island 105731 methylation at baseline and 12 weeks. (C) Plot differences for participants’ PER1 CpG island 105730 methylation at baseline and 12 weeks. Participant line colors are consistent across plots. Female participants noted with solid lines; male participants noted with dashed lines.
There were no statistically significant between-group differences in white blood cell methylation levels at 12 weeks, nor were there statistically significant changes in the methylation levels of ANGPTL4, DAPK3 or KAT5 from baseline to 12 weeks (figure 3A–D).
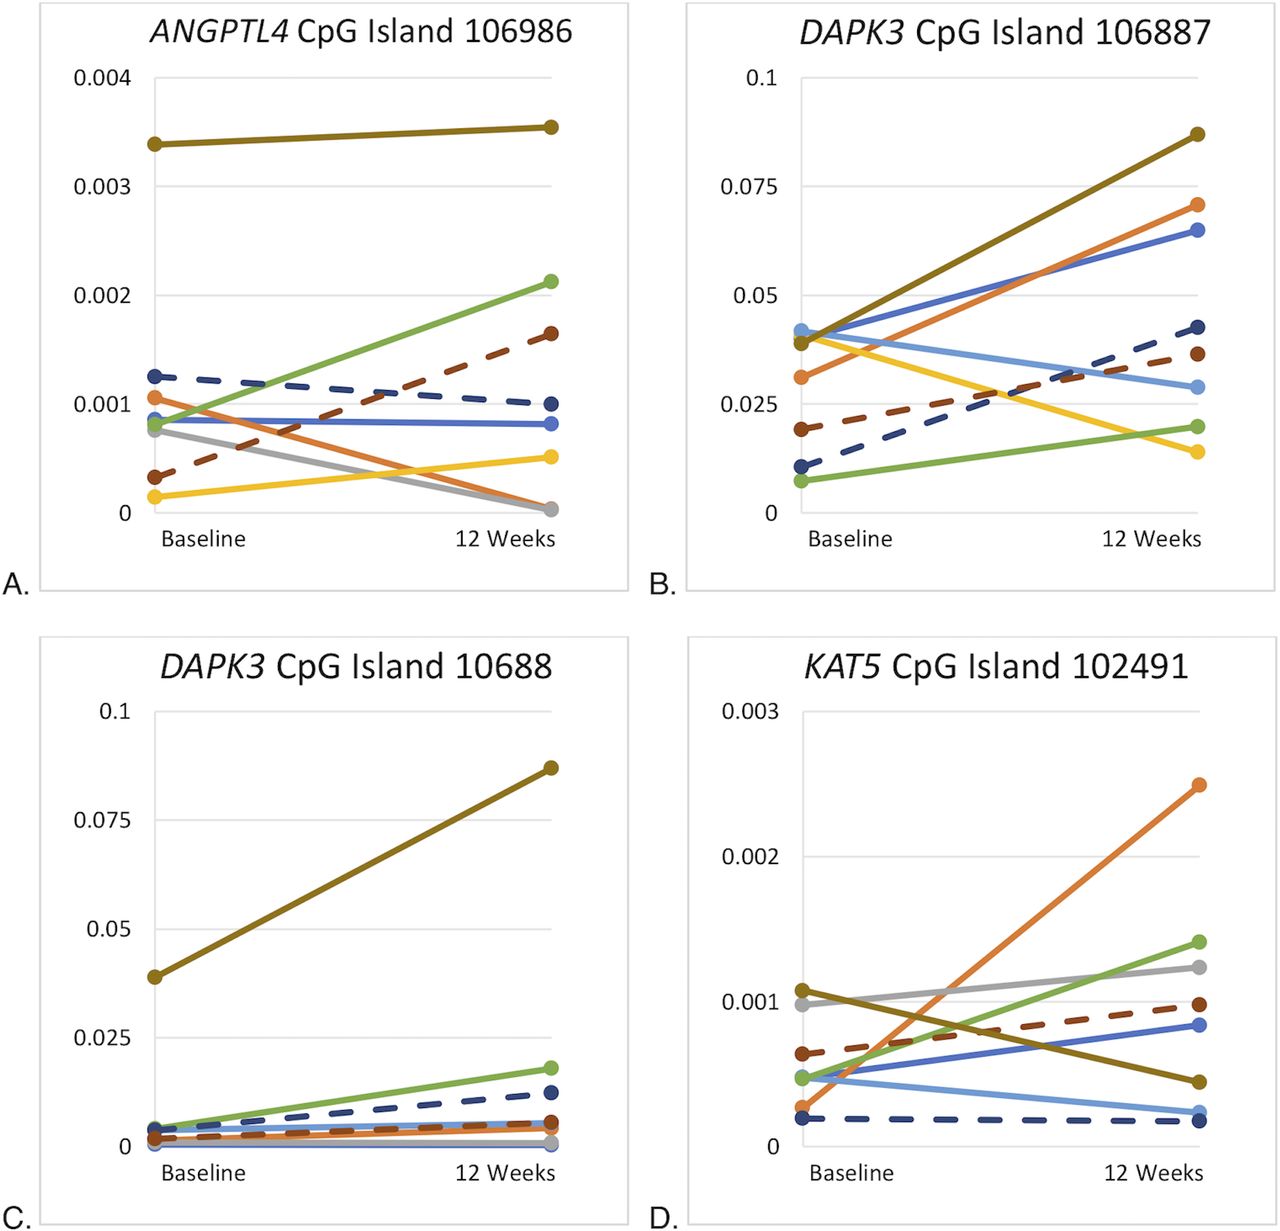
CpG islands without statistically significant changes in DNA methylation levels. (A) Plot differences for participants’ ANGPTL4 CpG island 106986 methylation at baseline and 12 weeks. (B) Plot differences for participants’ DAPK3 CpG island 106887 methylation at baseline and 12 weeks. (C) Plot differences for participants’ DAPK3 CpG island 106887 methylation at baseline and 12 weeks. (D) Plot differences for participants’ KAT5 CpG island 102491 methylation at baseline and 12 weeks. Participant line colors are consistent across plots. Female participants noted with solid lines; male participants noted with dashed lines.
DNA methylation changes and baseline variables
There was a statistically significant difference in PER1 CpG island 105730 methylation at baseline by sex (M=0.004174, SD=0.001386 for males vs M=0.009291, SD=0.003271 for females, p=0.035) and statistically significant changes based on sex (p=0.001) from baseline to 12 weeks (figure 2C). Males had a mean increase in methylation of M=77.4%, SD=4.3% whereas females had a mean decrease in methylation of M=7.1%, SD=41.0% (figure 4). AHI and BMI at baseline were not associated with statistically significant differences in DNA methylation levels from baseline to 12 weeks.

Percent change in PER1 CpG island 105730 methylation based on sex.
Minutes of therapeutic CPAP use and DNA methylation changes
Minutes of therapeutic CPAP use was not significantly associated with white blood cell methylation level changes for any of our selected candidate genes.
Changes in A1C levels, PSQI scores, ESS scores, and DNA methylation changes
Among all participants, a small effect size of 0.21 was seen for decreased A1C levels (M=7.63%, SD=0.88% at baseline to M=7.52%, SD=0.77% at 12 weeks), though no statistically significant differences in A1C levels were observed at 12 weeks, either by treatment group or among all participants. Additionally, there was a statistically significant decrease in PSQI scores between baseline and 12 weeks (from M=11.9, SD=3.5 to M=10.2, SD=3.3; p=0.007) with a moderate effect size of 0.77. However, no statistically significant differences in PSQI scores were observed by treatment group at 12 weeks. Overall, mean ESS scores did not change from baseline to 12 weeks, either by treatment group or among participates (from M=8.8, SD=4.8 at baseline to M=8.9, SD=5.0 at 12 weeks).
No statistically significant associations between changes in the white blood cell DNA methylation levels of the selected candidate genes and changes in A1C levels, or PSQI scores were identified. Since there were no changes in ESS scores overall, we examined changes in DNA methylation in the individuals with an improved ESS score (n=4) compared with those with worse or no change in ESS score (n=6). No differences in changes in methylation levels were identified.
Discussion
In this pilot study, both the intervention and control groups received diabetes education. Although the sample size was small, participants experienced decreased TNFAIP3 and PER1 CpG island 105731 methylation as well as lower PSQI scores at 12 weeks compared with baseline. Therefore, the provided diabetes education and subsequent behavioral changes may have altered participants’ behaviors and thus influenced methylation levels. However, more research is needed with larger samples to explore this line of reasoning.
TNFAIP3 plays a vital role in reducing inflammation.23 It is expressed in response to TNF-α, and results in decreased TNF-α-induced apoptosis as well as decreased NF-kB activation.23 TNF-α and NF-kB are both proinflammatory.5 24 25 The NF-kB pathway leads to increased activity of cytokines, chemokines, and adhesion molecules.24 25 TNF-α is a cytokine released by adipose tissue that leads to activation of neutrophils and the NF-kB pathway as well, producing an even greater increase in inflammation.5 24 25 TNF-α has been connected to obesity and insulin resistance.5 24 Inflammation is another abnormality associated with metabolic syndrome.5 24 Sleep fragmentation caused by OSA leads to sleep deprivation, which has been shown to increase inflammation.5
PER1 is critical to circadian rhythm generation and the regulation of metabolic homeostasis and sleep.5 26 However, circadian rhythm dysfunction leads to sleep disorders and markers of metabolic syndrome, including hyperglycemia, hypertension, dyslipidemia, inflammation, and obesity.5 27 These abnormalities are associated with diabetes mellitus and cardiovascular disease. Sleep disorders, including OSA, also negatively impact metabolism and circadian rhythms, decreasing the metabolism of glucose and lipids and increasing feelings of hunger.5 27 This has been shown in studies demonstrating the relationships between poor sleep and T2DM and obesity, as well as studies in night shift workers.5 27 OSA treatment has demonstrated secondary benefits in improving glucose metabolism.5
In this pilot study, males had increased white blood cell methylation of PER1 CpG island 105730 from baseline to 12 weeks, indicating a possible reduction in this gene’s activity. Conversely, females experienced decreased methylation of this gene. Sex differences have been reported in DNA methylation related to metabolic functioning and diabetes. In males, hypermethylation of PER1 in adipose tissue occurred after acute sleep deprivation.27 Also, in pancreatic islet cells, males have higher methylation of CpG sites on the X chromosome.28 One suggested explanation for this phenomenon is higher female methylation of genes that activate NF-kB, and as a result TNF-α and other inflammatory cytokines.28 In males, statistically significant changes in TNFAIP3 methylation were evident between acute sleep deprivation and normal sleep periods.29 Additional research may further explore methylation differences between male and female participants.
A mean decrease in PSQI scores was observed among all participants from baseline to 12 weeks. While this does suggest improved sleep quality, participant scores at 12 weeks remained greater than 5, indicating overall poor sleep quality. Additional studies have demonstrated decreases in PSQI subscales in patients with T2DM after non-pharmacological interventions like cognitive therapy, sleep hygiene education, behavioral therapy and stress management.30 The diabetes education provided in this study may have contributed to improved sleep quality or less diabetes-related distress. Data from previous studies found higher PSQI scores were associated with control problems with diet and emotional eating, lower self-care and diet adherence, lower diabetes quality of life, and greater numbers of comorbidities and complications.31 32
Although there were no statistically significant changes in white blood cell DNA methylation of ANGPTL4, KAT5, and DAPK3, there were also no statistically significant changes in A1C. Candidate genes were selected based on their relevance to T2DM and OSA. Therefore, the lack of change in glycemic control could have influenced the lack of DNA methylation change in the other candidate genes. Research has shown increased DNA methylation of DAPK3 in human skeletal muscle after exposure to insulin, as well as decreased DNA methylation of this gene after exposure to glucose.33 In this case, it is reasonable that no change in glycemic control was accompanied by no change in candidate gene DNA methylation.
The lack of changes in DNA methylation of candidate genes might have impacted the lack of change in T2DM glycemic control as well. In other words, the inverse relationship than that above may clarify the lack of statistical significance in DNA methylation changes. For example, inactivation of ANGPTL4 is associated with improved glucose regulation and lower risk of T2DM.34 Therefore, it is understandable that no change in candidate gene DNA methylation was accompanied by no change in A1C. These inter-related conditions may be points of interest for future research.
This study had several limitations. First, there was a small, fairly homogenous sample composed of mostly females. Second, no sample size calculation was done and therefore a type 2 error is possible. As a result, it may not be possible to rule out changes in the other candidate genes examined. Third, sleep quality was analyzed using a validated but subjective tool. Fourth, the study did not include any objective measurements of inflammation. Lastly, because the DNA was extracted from white blood cells, methylation changes represented only biomarkers, not well-described mechanisms. As a result of these limitations, the results of this study should be interpreted cautiously. Further analyses with larger sample sizes are needed to support its findings.
Nonetheless, PER1 and TNFAIP3 are involved in the pathway of disease for diabetes, cardiovascular disease, and metabolic syndrome. As a result, they are potential targets for future interventions. It is estimated that 25%–40% of people between the ages of 25 and 64 have metabolic syndrome, demonstrating the scope of these findings.5 In addition, most comparison studies have focused on young, healthy, adult males.27 29 Participants in this study represent a new population of middle-aged adults with multiple comorbidities, which may affect epigenetic changes concerning sleep disorders and metabolic conditions.
Moreover, genetics and precision medicine are growing fields in the prevention, detection, and treatment of diseases including diabetes and metabolic conditions. Pharmacological and lifestyle interventions should consider an individual’s biomarkers in order to optimize care.35 This is the first study to explore the impact of CPAP treatment and diabetes education on white blood cell methylation level. Our work has generated effect sizes on the impact of such treatment which may contribute to the development of future studies.
In conclusion, while white blood cell methylation changes were observed in this preliminary study, the causal mechanism remains unclear. The diabetes education provided to all participants may have contributed to the hypomethylation of PER1 and TNFAIP3 and improved PSQI scores that occurred during this intervention. These results indicate potential improvements in metabolic and inflammatory regulation, as well as better sleep quality. However, changes in PER1 methylation differed among males and females. Larger studies should be conducted to identify the causal mechanisms for the methylation changes, to examine if baseline methylation levels can be used to predict outcomes, and explore the long-term stability and effects of methylation changes.
References
Footnotes
Contributors EGB made substantial contributions to the analysis and interpretation of data for the work, and drafted the work. ERC, YPC, and CCI made substantial contributions to the conception and design of the work, the acquisition, analysis, and interpretation of data for the work, and revised the work critically for important intellectual content. EGB, ERC, YPC, and CCI gave final approval of the version to be published, and agreed to be accountable for all aspects of the work in ensuring that questions related to the accuracy or integrity of any part of the work are appropriately investigated and resolved.
Funding This work was supported by the National Institute of Diabetes and Digestive and Kidney Disease (grant number R01DK096028), the National Institutes of Health (grant number UL1TR001857), and the University of Pittsburgh School of Nursing Genomics of Patient Outcomes HUB grant.
Competing interests None declared.
Patient consent for publication Not required.
Ethics approval The study was approved by the University of Pittsburgh’s Human Research Protection Office.
Provenance and peer review Not commissioned; externally peer reviewed.
Data availability statement Data are available upon reasonable request.