Article Text

Abstract
Objective We reported previously that empagliflozin—a sodium-glucose cotransporter (SGLT) 2 inhibitor—exhibited preventive effects against obesity. However, it was difficult to extrapolate these results to human subjects. Here, we performed a therapeutic study, which is more relevant to clinical situations in humans, to investigate antiobesity effects of empagliflozin and illustrate the mechanism underlying empagliflozin-mediated enhanced fat browning in obese mice.
Research design and methods After 8 weeks on a high-fat diet (HFD), C57BL/6J mice exhibited obesity, accompanied by insulin resistance and low-grade chronic inflammation. Cohorts of obese mice were continued on the HFD for an additional 8-week treatment period with or without empagliflozin.
Results Treatment with empagliflozin for 8 weeks markedly increased glucose excretion in urine, and suppressed HFD-induced weight gain, insulin resistance and hepatic steatosis. Notably, empagliflozin enhanced oxygen consumption and carbon dioxide production, leading to increased energy expenditure. Consistently, the level of uncoupling protein 1 expression was increased in both brown and white (WAT) adipose tissues of empagliflozin-treated mice. Furthermore, empagliflozin decreased plasma levels of interleukin (IL)-6 and monocyte chemoattractant protein-1, but increased plasma levels of IL-33 and adiponectin in obese mice. Finally, we found that empagliflozin reduced M1-polarized macrophage accumulation, while inducing the anti-inflammatory M2 phenotype of macrophages in the WAT and liver, thereby attenuating obesity-related chronic inflammation.
Conclusions Treatment with empagliflozin attenuated weight gain by increasing energy expenditure and adipose tissue browning, and alleviated obesity-associated inflammation and insulin resistance by alternative macrophage activation in the WAT and liver of obese mice.
- Obesity
- Brown Fat
- Energy Expenditure
- Sodium Glucose Cotransporter
This is an open access article distributed in accordance with the Creative Commons Attribution Non Commercial (CC BY-NC 4.0) license, which permits others to distribute, remix, adapt, build upon this work non-commercially, and license their derivative works on different terms, provided the original work is properly cited, appropriate credit is given, any changes made indicated, and the use is non-commercial. See: http://creativecommons.org/licenses/by-nc/4.0/.
Statistics from Altmetric.com
Significance of this study
What is already known about this subject?
The sodium-glucose cotransporter (SGLT) 2 inhibitor increases urinary glucose excretion, thereby reducing hyperglycemia and body weight.
Empagliflozin-mediated SGLT2 inhibition preventively suppresses the progression obesity and insulin resistance via attenuating inflammation in high-fat diet-fed mice.
What are the new findings?
Treatment of obese mice with empagliflozin reverses adiposity and controls whole-body energy homeostasis by enhancing energy expenditure and thermogenesis.
Inhibition of SGLT2 by empagliflozin enhances fat utilization and browning and attenuates obesity-induced inflammation and insulin resistance via M2 or alternative macrophage activation.
How might these results change the focus of research or clinical practice?
The SGLT2 inhibitor may be a therapeutic option for obesity, insulin resistance and non-alcoholic fatty liver disease by calorie loss and through enhanced energy expenditure and alternative macrophage activation.
Introduction
Obesity has emerged as a major health crisis due to its association with metabolic risk factors, such as diabetes, non-alcoholic steatohepatitis (NASH) and cardiovascular diseases.1 Obesity is closely associated with low-level chronic inflammation, which is characterized by increased cytokine and chemokine production and activation of inflammatory pathways.2–4 Excessive fat accumulation activates the innate immune system, with the subsequent recruitment of immune cells such as macrophages and T cells into metabolic tissues, leading to the development of insulin resistance.5–7 However, treatment options that target energy metabolism and chronic inflammation in obesity remain limited.
Sodium-glucose cotransporter (SGLT) 2 inhibitors have been developed as a novel class of antidiabetic agents.8 These agents lower blood glucose concentration by enhancing urinary glucose excretion (UGE), thereby reducing hyperglycemia and weight with apparent pleiotropic effects.9–12 We reported previously that empagliflozin prevented weight gain, insulin resistance and chronic inflammation in lean mice fed a high-fat diet (HFD).13 However, it remains unclear whether empagliflozin can exert similar effects on established obese insulin-resistant mice due to the almost complete lack of uncoupling protein 1 (Ucp1) expression in white adipose tissue (WAT) and chronic low-grade inflammation in the WAT and liver.14 15 Therefore, the present study was performed as a therapeutic schedule to investigate the effects of empagliflozin on energy metabolism, insulin resistance and obesity-associated inflammation in diet-induced obese (DIO) mice.
Materials and methods
Animals and diets
Male C57BL/6Jslc mice aged 8 weeks (Japan SLC, Hamamatsu, Japan) were fed normal chow (NC) that provided 10% of calories from fat (CRF-1; Charles River Laboratories, Wilmington, Massachusetts, USA) or a high-fat diet (HFD) that provided 60% of calories from fat (D12492; Research Diets, New Brunswick, New Jersey, USA) for 8 weeks. The NC group was then maintained continuously on NC for the following 8 weeks, whereas the HFD-fed mice were divided into two body weight-matched groups and fed HFD with (HFD+Empa group) or without (HFD group) 0.01% (w/w) empagliflozin (Boehringer Ingelheim Pharma GmbH, Ingelheim, Germany) for the following 8 weeks (figure 1A). The mice in the HFD and HFD+Empa groups were maintained on a pair-feeding schedule throughout the experiment. All animal procedures were performed in accordance with the standards set forth in the Guidelines for the Care and Use of Laboratory Animals of Kanazawa University, Japan.

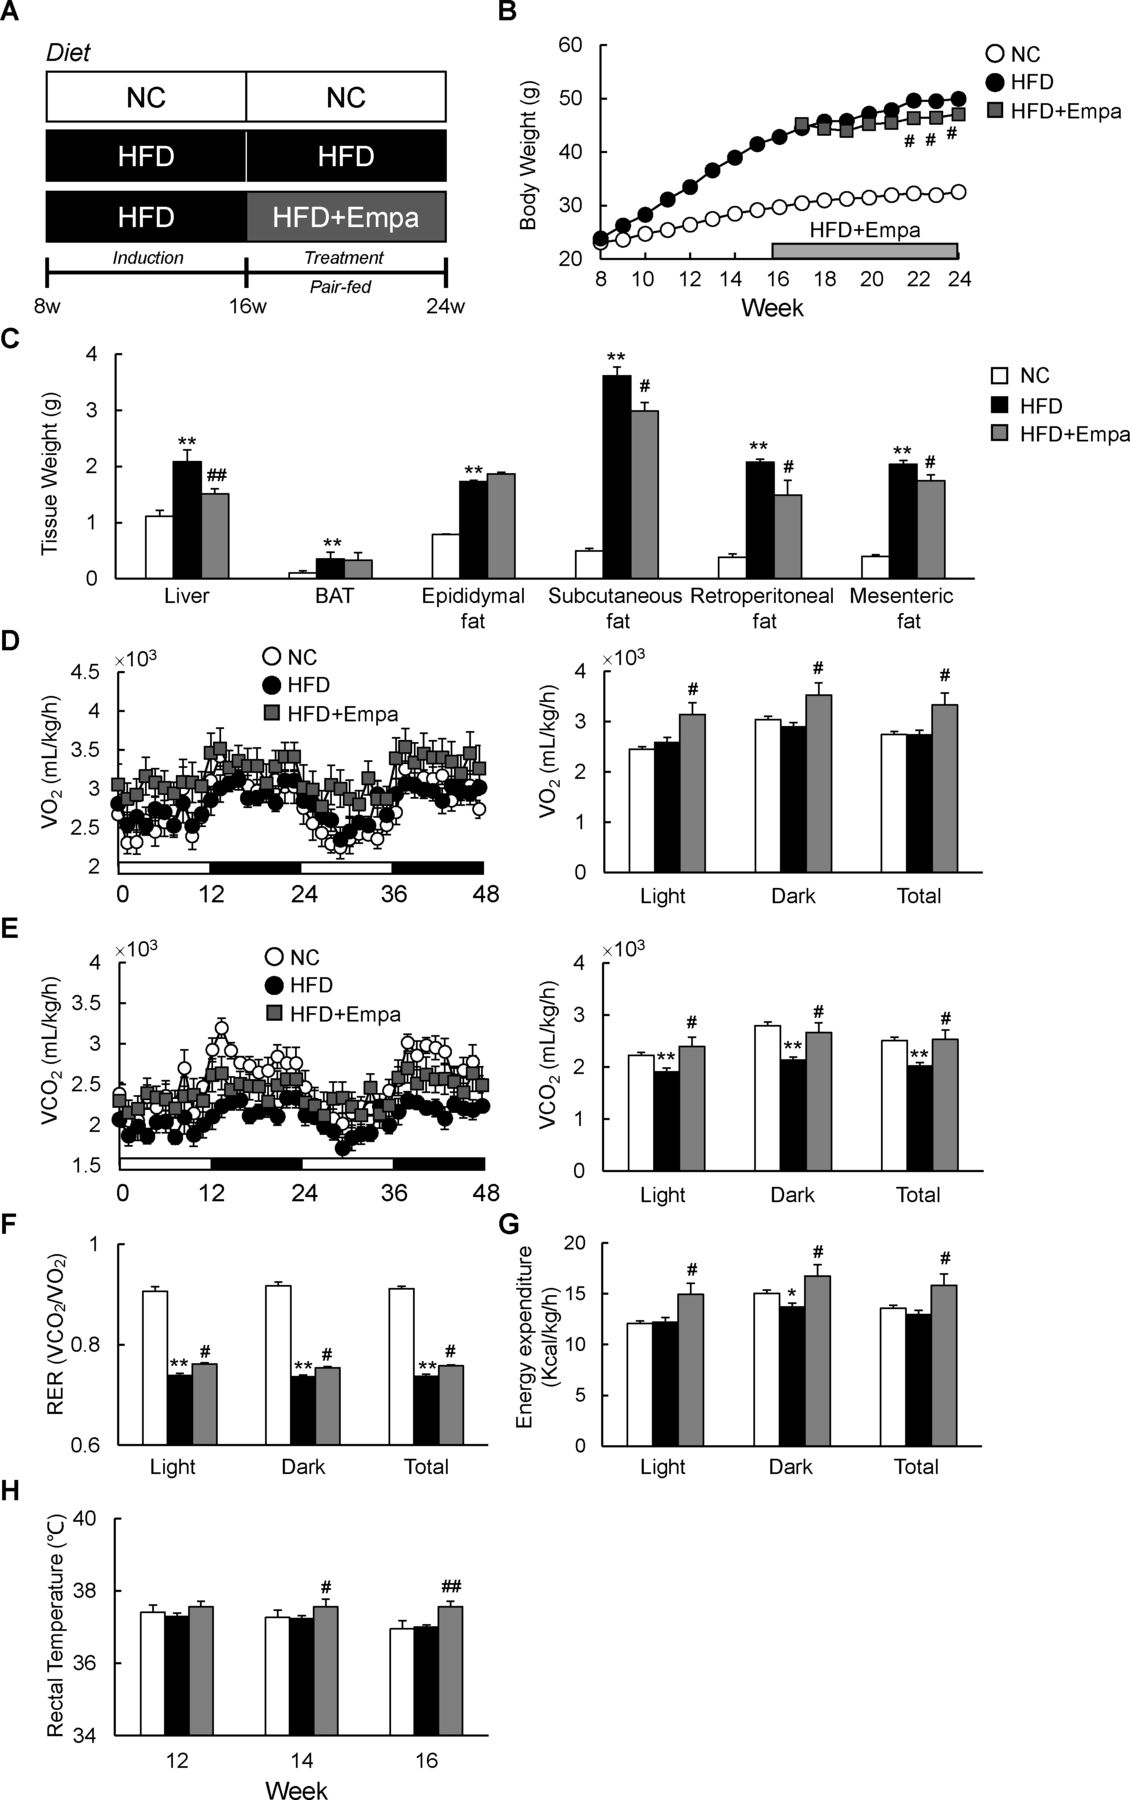
Empagliflozin (Empa) reduced weight gain and increased energy expenditure in mice fed a high-fat diet (HFD). (A) Design of study examining the therapeutic effects of Empa. (B) Body weights, (C) tissue weights, (D) oxygen consumption (VO2), (E) carbon dioxide production (VCO2), (F) respiratory exchange ratios (RERs), (G) energy expenditure and (H) rectal temperature of mice fed NC, an HFD and an HFD with Empa (HFD+Empa). Rectal temperatures were measured on three consecutive days between 09:00 and 10:00 hours using a microprobe thermometer. Data are presented as means±SEM, n=7–8. *p<0.05 and **p<0.01, respectively, for comparisons with NC-fed mice; #p<0.05 and ##p<0.01, respectively, for comparisons with HFD-fed mice. BAT, brown adipose tissue; Empa, empagliflozin; HFD, high-fat diet; NC, normal chow.
Indirect calorimetry
After 3 weeks of feeding, the mice were housed individually in indirect calorimeter chambers (Oxymax; Columbus Instruments, Columbus, Ohio, USA). Calorimetry, daily body weight and daily food intake data were collected during a 3-day acclimation period, and then during a 2-day experimental period. Oxygen consumption (VO2), carbon dioxide production (VCO2), respiratory exchange ratio (RER, VCO2/VO2) and energy expenditure were evaluated for two consecutive days. Energy expenditure was calculated as described below and normalized relative to the body mass of each mouse:
Energy expenditure=VO2×[3.815+(1.232×RER)].
Fluorescence-activated cell sorting
Cells from the liver and epididymal WAT (eWAT) were prepared as described previously.3 16 Isolated cells were incubated with Fc-Block (BD Biosciences, San Jose, California, USA), followed by incubation with fluorochrome-conjugated antibodies (online supplementary table 1). Flow cytometry was performed using a FACSAria II (BD Biosciences), and data were analyzed using FlowJo software (V.8.8.7; Tree Star, Ashland, Oregon, USA).
Supplemental material
Histological examination and immunohistochemistry
Paraffin wax-embedded eWAT, brown adipose tissue (BAT) and liver sections were stained using H&E or stained immunohistochemically for F4/80 and Ucp1 as described previously.17
Biochemical analyses and metabolic measurements
Levels of plasma triglycerides (TG), total cholesterol (TC), non-esterified fatty acids (NEFA), glucose, insulin, aspartate aminotransferase (AST), alanine aminotransferase (ALT), monocyte chemoattractant protein (MCP)-1, interleukin (IL)-6, IL-33, adiponectin, ketone bodies, glycerol, creatinine, urine 8-hydroxy-2′-deoxyguanosine (8-OHdG), thiobarbituric acid-reactive substrates (TBARS) and hepatic lipids were measured as described previously.18 All hepatic lipid levels were normalized relative to liver protein level. For insulin tolerance tests (ITTs), mice were fasted for 4 hours and injected intraperitoneally with 1 U/kg body weight human insulin (HumulinR; Eli Lilly, Indianapolis, Indiana, USA). Blood glucose values were measured before and at 30, 60, 90 and 120 min after injection. For glucose tolerance tests (GTTs), mice fasted overnight were injected intraperitoneally with 2 g/kg d-glucose solution and blood glucose was measured before and at 30, 60, 90 and 120 min after injection. Total RNA was isolated from frozen tissue using a GenElute mammalian total RNA miniprep kit (Sigma-Aldrich, St. Louis, Missouri, USA). We synthesized complementary DNA (cDNA) using a high-capacity cDNA reverse transcription kit (Applied Biosystems, Carlsbad, California, USA), and determined mRNA expression levels via quantitative real-time PCR using SYBR Green as described previously.3 The primers used for real-time PCR are listed in online supplementary table 2.
Immunoblotting
Tissues were homogenized in RIPA lysis buffer (Millipore, Billerica, Massachusetts, USA) supplemented with protease and phosphatase inhibitors (Sigma-Aldrich). The lysates were blotted with primary antibodies overnight at 4°C (online supplementary table 3), and then incubated with appropriate secondary antibodies (Cell Signaling Technology, Danvers, Massachusetts, USA). Proteins were visualized via chemiluminescence (Millipore) and imaged using a CCD camera system (GE Healthcare Japan, Tokyo, Japan). Pixel intensities of immunoreactive bands were quantified using ImageQuant TL software (ImageQuant LAS 4000; GE Healthcare).
Statistical analyses
All data are presented as means±SEM. In all analyses, p<0.05 was taken to indicate statistical significance. Differences in mean values between two groups were assessed using the two-tailed Student’s t-test. Differences in mean values among more than two groups were determined using analysis of variance (ANOVA). If results from one-way ANOVA were significant, pair-wise differences between groups were estimated using Tukey’s post hoc test. All calculations were performed using SPSS (V.22.0; IBM, Armonk, New Y, USA).
Results
Empagliflozin reduced weight gain and increased energy expenditure in HFD-fed mice
To investigate the effects of empagliflozin on systemic energy balance in obese mice, DIO mice were fed an HFD with or without empagliflozin for 8 weeks (HFD+Empa and HFD groups, respectively). The HFD+Empa mice exhibited significantly lower body mass compared with HFD mice despite comparable food intake (figure 1B and online supplementary figure S1A). Moreover, empagliflozin increased water intake, urine volume and UGE of HFD-fed mice without affecting plasma creatinine level, which is an indicator of renal function (online supplementary figure S1B–D and table 1). The lower body mass in HFD+Empa mice was largely attributable to reduced mass not of interscapular BAT, but of the liver and WAT deposits, including subcutaneous fat, retroperitoneal fat and mesenteric fat (figure 1C).
Effects of empagliflozin on metabolic parameters at 8 weeks of treatment
To assess whole-body energy expenditure, we placed the mice in indirect calorimetry cages after 3 weeks of treatment before evident changes in the body mass of HFD+Empa mice were observed. Compared with NC, the HFD did not alter VO2 or energy expenditure, but it significantly suppressed VCO2 and RER (figure 1D–G). Empagliflozin-treated mice exhibited consistently higher oxygen consumption and exhaled more CO2 than the HFD-fed mice did, leading to elevated RER and energy expenditure (figure 1D–G). These data suggest that treatment with empagliflozin enhances use of carbohydrates as well as fats under HFD conditions. Consistent with this increase in energy expenditure, empagliflozin also increased the core temperature of the HFD-fed mice (figure 1H).
Empagliflozin promoted fat browning in DIO mice
The elevated energy expenditure and body temperature of the empagliflozin-treated mice suggested an increase in adaptive thermogenesis. Indeed, compared with the HFD group, empagliflozin decreased lipid accumulation and increased Ucp1 levels in the interscapular BAT (figure 2A,B). Accordingly, the mRNA expression of brown fat-selective genes, such as Ucp1, Cidea and Prdm16, was also significantly increased in the BAT of HFD+Empa mice (figure 2C). Empagliflozin tended to increase mRNA expression of Pgc-1α (Ppargc1α) and deiodinase 2 (Dio2) in HFD-fed mice, although these increases were not statistically significant (figure 2C). Brown-like adipocytes, also known as beige cells, are present in various WAT depots and can express Ucp1, which contributes to thermogenesis.19 Compared with NC mice, HFD-fed mice exhibited significantly decreased Ucp1 levels in both the inguinal WAT (iWAT) and eWAT, which were restored by empagliflozin (figure 2D). Furthermore, the mRNA levels of brown fat-selective genes, such as Ucp1, Prdm16 and Cidea, in the iWAT also increased significantly in empagliflozin-treated mice (figure 2E).

Empagliflozin (Empa) increased uncoupling protein 1 (Ucp1) expression in both brown (BAT) and white (WAT) adipose tissues. (A) BAT sections stained using H&E. Scale bars=100 µm. (B) Immunoblots of Ucp1 in BAT. (C) Levels of thermogenesis-related gene mRNAs in the BAT. (D) Immunoblots of Ucp1 in the inguinal (iWAT) and epididymal (eWAT) WAT. (E) Levels of browning-related gene mRNAs in the iWAT. Data are presented as means±SEM, n=7–8. *P<0.05 and **p<0.01, respectively, for comparisons with normal chow (NC)-fed mice; #p<0.05 and ##p<0.01, respectively, for comparisons with high-fat diet (HFD)-fed mice.
Empagliflozin ameliorated HFD-induced insulin resistance and hepatic steatosis
The administration of empagliflozin normalized blood glucose levels in fed DIO mice (table 1). GTT and ITT data revealed that glucose intolerance and insulin resistance were ameliorated by empagliflozin (figure 3A,B), and hyperinsulinemia was suppressed in both fed and fasting states (figure 3C). Moreover, the insulin-stimulated phosphorylation of the insulin receptor β subunit (Tyr1146) and Akt (Ser473) in the eWAT, liver and muscle was enhanced in the HFD+Empa group relative to the HFD group (figure 3D).
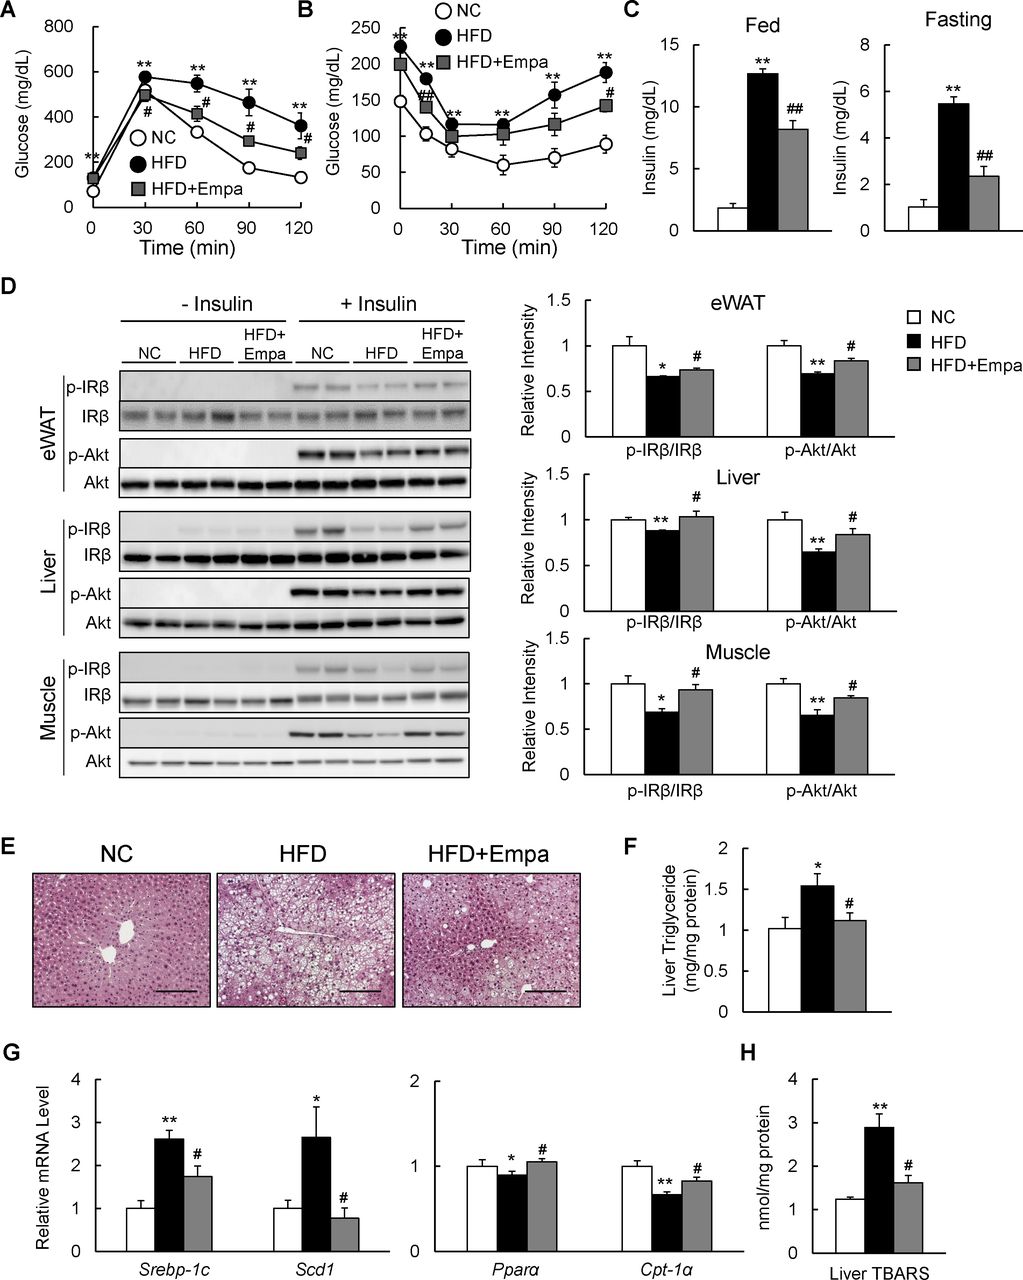
Empagliflozin (Empa) ameliorated high-fat diet (HFD)-induced hepatic steatosis and insulin resistance. Results of (A) glucose tolerance and (B) insulin tolerance tests. (C) Fed and fasting plasma insulin levels in mice fed normal chow (NC), an HFD and an HFD+Empa. (D) Immunoblots of phosphorylated Tyr1146 insulin receptor β subunit (p-IRβ), IRβ, phosphorylated Ser473 Akt (p-Akt) and Akt in the epididymal white adipose tissue (eWAT), liver and muscle of mice. (E) H&E-stained liver sections. Scale bars=100 µm. (F) Liver triglyceride levels, (G) mRNA levels of lipogenesis-regulated and fatty acid oxidation-regulated genes in the liver, and (H) liver TBARS contents in mice fed NC, an HFD and an HFD+Empa. Data are presented as means±SEM, n=7–8. *p<0.05 and **p<0.01, respectively, for comparisons with NC-fed mice; #p<0.05 and ##p<0.01, respectively, for comparisons with HFD-fed mice.
The HFD caused hepatic steatosis and inflammation, eventually leading to fatty liver disease. Administration of empagliflozin markedly attenuated the HFD-induced hepatic steatosis (figure 3E). Empagliflozin consistently reduced liver TG content and plasma levels of TG and TC in HFD-fed mice (figure 3F and table 1), and these findings were associated with the suppression of lipogenic gene expression and upregulation of mitochondrial fatty acid β-oxidation genes (figure 3G). Moreover, empagliflozin tended to upregulate liver fibroblast growth factor-21 (FGF21) protein level and markedly increased levels of plasma ketone bodies and glycerol, suggesting that lipolysis is enhanced in empagliflozin-treated mice (online supplementary figure S2A and table 1).
In addition, the lower levels of plasma ALT and AST observed in the HFD+Empa group compared with the HFD group indicated that empagliflozin alleviated HFD-induced liver damage (table 1). Furthermore, the levels of TBARS and plasma 8-OHdG were markedly suppressed by empagliflozin (figure 3H and table 1), and these findings were associated with decreased mRNA expression of the NADPH oxidase subunits and increased mRNA expression of antioxidative stress genes in the eWAT and liver of DIO mice (online supplementary figure S2B–E).
Empagliflozin attenuated inflammation in the fat and liver of DIO mice
We next investigated the effects of empagliflozin on adipose tissue inflammation. Infiltration of macrophages into hypertrophied adipose tissue and occurrence of crown-like structures that were induced by HFD were markedly reduced in HFD+Empa mice according to the results of immunostaining and mRNA expression of F4/80 (figures 4A, B and online supplementary figure S3). Levels of inflammatory cytokines and chemokines, including IL-6, IL-1β, Mcp1 and Ccr2, decreased in the eWAT of HFD+Empa mice compared with HFD-fed mice (figure 4B). These findings were associated with attenuated nuclear factor-κB p65, p38 mitogen-activated protein kinase and extracellular signal-related kinase phosphorylation in the eWAT of DIO mice (figure 4C). In addition, the decreased expression of adiponectin in DIO mice was restored by empagliflozin (figure 4D). Similarly, empagliflozin also markedly reduced the number of F4/80+ cells (figure 4E,F), and decreased gene expression levels of proinflammatory cytokines and chemokines; and inflammatory signaling in the liver (figure 4F,G). Notably, empagliflozin reduced inflammatory cytokine (IL-6) and chemokine (MCP-1) levels, whereas it increased the level of IL-33, an anti-inflammatory cytokine, in the plasma of DIO mice (figure 4H). These results indicated that treatment with empagliflozin suppressed HFD-induced inflammation.
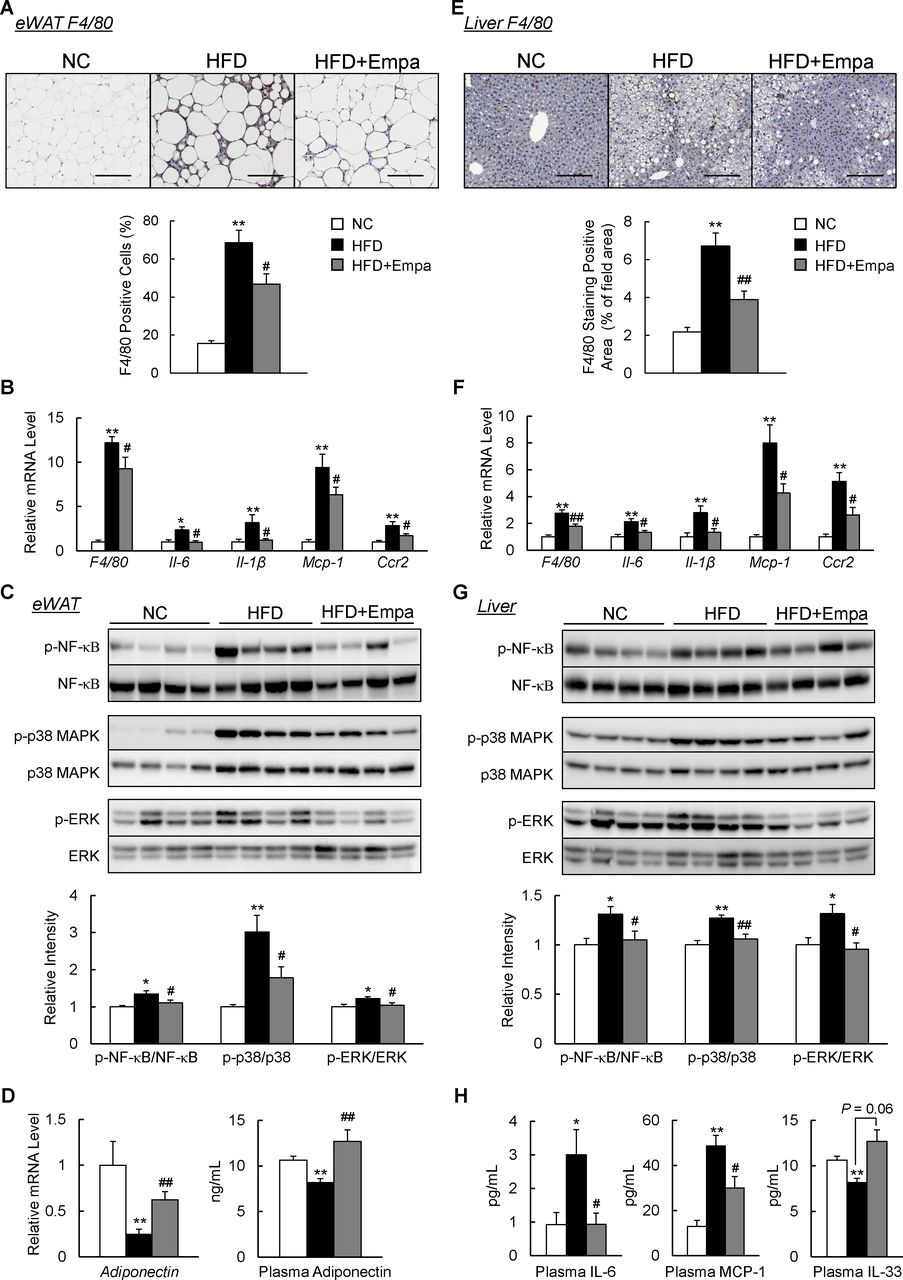
Empagliflozin (Empa) attenuated adipose tissue and liver inflammation in high-fat diet (HFD)-fed mice. (A) F4/80 immunostaining in the epididymal white adipose tissue (eWAT). Scale bars=100 µm. (B) Levels of F4/80 and inflammatory cytokines and chemokines mRNAs in the eWAT. (C) Immunoblots of phosphorylated nuclear factor-κB (p-NF-κB p65), phosphorylated p38 mitogen-activated protein kinase (p-p38 MAPK), phosphorylated extracellular signal-related kinase (p-ERK) and their total protein contents in the eWAT. (D) Levels of adiponectin mRNAs in the eWAT and adiponectin in the plasma. (E) F4/80 immunostaining in the liver. Scale bars=100 µm. (F) Levels of F4/80 and inflammatory cytokines and chemokines mRNAs in the liver. (G) Immunoblots of p-NF-κB p65, p-p38 MAPK and p-ERK, and their total protein contents in the liver. (H) Plasma interleukin (IL)-6, monocyte chemoattractant protein (MCP)-1 and IL-33 contents. Data are presented as means±SEM, n=7–8. *P<0.05 and **p<0.01, respectively, for comparisons with normal chow (NC)-fed mice; #p<0.05 and ##p<0.01, respectively, for comparisons with HFD-fed mice.
Empagliflozin caused a reciprocal decrease in M1 macrophages and increase in M2 macrophages in the eWAT and liver of mice
To further quantify the adipose tissue macrophages (ATMs) and hepatic macrophage/Kupffer cell subsets, fluorescence-activated cell sorting was performed to analyze the immune cells isolated from the mice. The rate of increase in total number of ATMs associated with HFD was markedly decreased by empagliflozin (figure 5A,C). Compared with those in NC-fed mice, ATMs in HFD-fed mice were composed of a significantly higher proportion of M1 and lower proportion of M2. Empagliflozin administration reduced the proportion of M1 but increased the proportion of M2 in HFD-fed mice, which resulted in macrophage polarization toward an anti-inflammatory phenotype (figure 5B,C). Accordingly, mRNA expression levels of the M1 marker (Cd11c) and M2 markers (Arg1, Cd206 and IL-10) were downregulated and upregulated by empagliflozin, respectively (online supplemenatry figure S4A, B). Moreover, the total number of CD3+, CD4+ and CD8+ T cells in the eWAT increased in HFD-fed mice, but this effect was significantly reduced by empagliflozin (online supplementary figure S5A,B). As in the adipose tissue, the total number of liver macrophages increased in HFD-fed mice relative to NC-fed mice (figure 5D,F). However, the empagliflozin-treated mice produced fewer M1 liver macrophages and more M2 liver macrophages than the HFD-fed mice, resulting in macrophage polarization toward an anti-inflammatory phenotype in the liver (figure 5E,F). Similarly, empagliflozin decreased Cd11c expression, increased M2 marker levels and reduced CD3+ and CD8+ T cell numbers in the livers of DIO mice (online supplementary figures S4C,D and S5C,D). These results suggested that empagliflozin caused a shift to an M2-dominant macrophage phenotype and reduces T cell accumulation in the liver and WAT, thus attenuating obesity-induced insulin resistance and inflammation.

Empagliflozin (Empa) promoted dominance of M2 over M1 macrophages in the epididymal white adipose tissue (eWAT) and liver. (A) Representative plots of total macrophages in the eWAT. (B) Occurrence frequencies of M1-type and M2-type macrophages in the eWAT. (C) Quantification of total macrophages, percentages of M1-type and M2-type macrophages and M1/M2 macrophage ratios in the eWAT. (D) Representative plot of total macrophages in liver. (E) Occurrence frequencies of M1-type and M2-type macrophages in the liver. (F) Quantification of total macrophages, percentages of M1-type and M2-type macrophages, and M1/M2 macrophage ratios in the liver. Data are presented as means±SEM, n=7–8. *P<0.05 and **p<0.01, respectively, for comparisons with normal chow (NC)-fed mice; #p<0.05 and ##p<0.01, respectively, for comparisons with high-fat diet (HFD)-fed mice. ATM, adipose tissue macrophage.
Discussion
The results of the present study revealed that inhibition of SGLT2 by empagliflozin prevented the progression of obesity. Empagliflozin mitigated HFD-induced weight gain and adiposity by enhancing energy expenditure. In addition, administration of empagliflozin attenuated oxidative stress, inflammation and insulin resistance, at least in part through the reduction of macrophage accumulation and activation of M2 macrophages in both the WAT and liver. In addition, consistent with the increased energy expenditure in empagliflozin-treated mice, Ucp1 expression in both the BAT and WAT was restored, indicating that fat browning was promoted by empagliflozin even in mice with established obesity.
Our previous study showed that empagliflozin prevented the development of obesity.13 Here, we demonstrated that empagliflozin also has therapeutic effects on obesity. Therapeutic studies will aid in the translation of experimental results regarding the antiobesity effects of SGLT2 inhibitors to clinical settings. As expected, empagliflozin induced urinary excretion of a large amount of glucose, with subsequent reductions in insulin levels in obese mice. A growing body of evidence has demonstrated that SGLT2 inhibitors reduce body mass and fat mass via calorie loss due to glycosuria, and by increasing fat oxidation. Like empagliflozin, canagliflozin, tofogliflozin and ipragliflozin also activated lipolysis, and thus promoted higher fat utilization, in obese animal models.20–23 As we13 and others20 have reported, FGF21 appears to mediate, at least in part, SGLT2 inhibitor-induced activation of lipolysis in adipose tissue.
Inhibition of SGLT2 improves pancreatic β-cell dysfunction in obese mice, resulting in the amelioration of glucose tolerance and insulin sensitivity, and leading ultimately to an increase in carbohydrate consumption to provide ATP.24 25 In addition, inhibition of SGLT2 promoted catabolic pathways such as fatty acid oxidation by phosphorylation of AMP-activated protein kinase α and acetyl-CoA carboxylase in skeletal muscle, thus alleviating energy homeostasis.13 26 Moreover, in clinical trials, a small increase in plasma low-density lipoprotein cholesterol (LDL-C) has been reported with SGLT2 inhibitors.27 Empagliflozin increases the plasma LDL-C level concomitantly with higher free fatty acids (FFAs) and total ketone body levels, suggesting that SGLT2 inhibition induces ketogenesis and increased lipid oxidation to compensate for the carbohydrate shortage.28
In the present study, empagliflozin-treated mice consumed more oxygen and produced greater amounts of carbon dioxide, leading to increased energy expenditure. Treatment with SGLT2 inhibitors decreases consumption of energy from glucose, while compensatorily increasing consumption of energy from fat.23 As a result, total energy expenditure is increased, as seen in our study and others,13 29 or remains unchanged.20 22 23 The discordance in the impact of SGLT2 inhibitors on energy expenditure among published reports may be due to differences in experimental conditions, such as the dose of inhibitor, body mass of animals (lean or obese) and timing of energy expenditure measurements.
It is important to note that treatment with empagliflozin increased whole-body energy expenditure, which was associated with increased Ucp1 levels in the BAT, iWAT and eWAT. Further studies are needed to elucidate the mechanism by which SGLT2 inhibitors, including empagliflozin, promote fat browning as a secondary effect. Recent studies have demonstrated that M2-polarized macrophages promote the browning of adipose tissue through increased type 2 cytokine production when mice are placed in a cold environment,30–32 or are under calorie-restricted conditions.33 The cytokines derived from M2 macrophages, including catecholamines, stimulate signaling of the β3-adrenergic receptor, thereby activating the thermogenic programme. In addition to type 2 cytokines, adiponectin also activates thermogenesis via direct actions on adipocytes and/or promotion of in situ proliferation of M2 macrophages.34 In fact, inhibition of SGLT2 through peroxisome proliferator-activated receptor δ activation increased the expression of adiponectin in patients with diabetes and obese mice.35 In the present study, empagliflozin promoted alternative macrophage activation in the WAT and increased plasma adiponectin levels, which may contribute to adipose tissue browning.
The results of the present study indicated that treatment with empagliflozin improved systemic glucose tolerance and insulin sensitivity of HFD-fed mice. In fact, there is emerging evidence that macrophages are a major source of proinflammatory cytokines, which can function in a paracrine manner and potentially in an endocrine manner to decrease insulin sensitivity.36 37 Thus, strategies to restrain M1 polarization and/or drive alternative M2 activation of macrophages have the potential to protect against exacerbated inflammation and insulin resistance.38 It is noteworthy that we used highly specific gating strategies to determine pure populations of total macrophages, and M1 and M2 macrophages within both fat and the liver. Flow cytometry analysis clearly demonstrated a decrease in M1 macrophages that is reciprocal to an increase in M2 macrophages in empagliflozin-treated DIO mice. Moreover, T cells are critical regulators of macrophage polarization, and some studies have demonstrated that the infiltration of Th1 and CD8+ T cells precedes M1-polarized macrophage recruitment and contributes to insulin resistance in response to obesity.39 40 Therefore, treatment with empagliflozin suppressed the recruitment of T cells and M1 activation of macrophages to alleviate obesity and progression of insulin resistance.
In conclusion, we showed that the inhibition of SGLT2 by empagliflozin reduced obesity and controlled whole-body energy homeostasis by enhancing sugar and fat use, and fat browning. In addition, empagliflozin treatment attenuated obesity-induced inflammation and insulin resistance via alternative macrophage activation. Thus, the present study further confirmed the potential clinical utility of empagliflozin for the treatment of obesity and related metabolic disorders, such as insulin resistance, type 2 diabetes and NASH.
Acknowledgments
The authors would like to thank M Nakayama and K Hara (Kanazawa University, Kanazawa, Japan) for technical assistance and animal care and Textcheck for help in the preparation of the manuscript.
References
Footnotes
Contributors LX collected data and wrote the manuscript. NN, GC, MN and YS collected data. SK contributed to discussions and edited the manuscript. TO contributed to discussions, and reviewed and edited the manuscript. TO is the guarantor of this work, and as such had full access to all data used in the study and takes responsibility for the integrity of the data and accuracy of the data analysis.
Funding This work was supported by a Grant-in-Aid for Scientific Research (B) (25282017) and for Challenging Exploratory Research (15K12698) from the Ministry of Education, Culture, Sports, Science and Technology of Japan and the Japan Diabetes Foundation (TO).
Competing interests TO received research support from Boehringer Ingelheim Pharma GmbH & Co. KG. There are no other potential conflicts of interest relevant to this article.
Patient consent for publication Not required.
Provenance and peer review Not commissioned; externally peer reviewed.
Data availability statement All data relevant to the study are included in the article or uploaded as supplementary information.