Article Text

Abstract
Objective Here we looked for possible mechanisms regulating the progression of type 1 diabetes mellitus (T1DM). In this disease, autoaggressive T cells (T conventional cells, Tconvs) not properly controlled by T regulatory cells (Tregs) destroy pancreatic islets.
Research design and methods We compared the T-cell compartment of patients with newly diagnosed T1DM (NDT1DM) with long-duration T1DM (LDT1DM) ones. The third group consisted of patients with LDT1DM treated previously with polyclonal Tregs (LDT1DM with Tregs). We have also looked if the differences might be dependent on the antigen specificity of Tregs expanded for clinical use and autologous sentinel Tconvs.
Results Patients with LDT1DM were characterized by T-cell immunosenescence-like changes and expansion of similar vβ/T-cell receptor (TCR) clones in Tconvs and Tregs. The treatment with Tregs was associated with some inhibition of these effects. Patients with LDT1DM possessed an increased percentage of various proinsulin-specific T cells but not GAD65-specific ones. The percentages of all antigen-specific subsets were higher in the expansion cultures than in the peripheral blood. The proliferation was more intense in proinsulin-specific Tconvs than in specific Tregs but the levels of some proinsulin-specific Tregs were exceptionally high at baseline and remained higher in the expanded clinical product than the levels of respective Tconvs in sentinel cultures.
Conclusions T1DM is associated with immunosenescence-like changes and reduced diversity of T-cell clones. Preferential expansion of the same TCR families in both Tconvs and Tregs suggests a common trigger/autoantigen responsible. Interestingly, the therapy with polyclonal Tregs was associated with some inhibition of these effects. Proinsulin-specific Tregs appeared to be dominant in the immune responses in patients with T1DM and probably associated with better control over respective autoimmune Tconvs.
Trial registration number EudraCT 2014-004319-35.
- immunopathology of type 1 diabetes
- immune pathogenesis type 1 diabetes
- immune predictors type 1
- immune regulation
This is an open access article distributed in accordance with the Creative Commons Attribution Non Commercial (CC BY-NC 4.0) license, which permits others to distribute, remix, adapt, build upon this work non-commercially, and license their derivative works on different terms, provided the original work is properly cited, appropriate credit is given, any changes made indicated, and the use is non-commercial. See: http://creativecommons.org/licenses/by-nc/4.0/.
Statistics from Altmetric.com
- immunopathology of type 1 diabetes
- immune pathogenesis type 1 diabetes
- immune predictors type 1
- immune regulation
Significance of this study
What is already known about this subject?
Type 1 diabetes is an autoimmune disease.
The progression of this disease is dependent on the balance between autoreactive T conventional cells (Tconvs) and T regulatory cells (Tregs).
What are the new findings?
The families of clones of Tconvs and Tregs with similar specificity expand with the progression of type 1 diabetes, which suggests a common trigger/autoantigen responsible.
When activated, proinsulin-specific Tregs proliferate to higher numbers than respective Tconvs, which may be a mechanism regulating autoaggressive Tconvs in type 1 diabetes.
Proinsulin-specific Tregs are preferentially expanded in polyclonal Tregs during manufacturing of this product for autologous therapy of type 1 diabetes.
Therapy with polyclonal Tregs inhibits clonal expansions and immunosenescence-like changes during the progression of type 1 diabetes.
How might these results change the focus of research or clinical practice?
Any antigen-specific therapy in type 1 diabetes (peptide/specific cells therapy/antigen-encoding gene therapy/and so on) should take into account that the antigen drives expansion of both Tregs and Tconvs and the final outcome of the therapy may depend on the dynamics of the proliferation and the balance between these two subsets.
Introduction
Type 1 diabetes mellitus (T1DM) remains a mysterious autoimmune disease in which early phase is still a matter of debate. While immune markers are required to diagnose the disease, the primary trigger is disputable.1–3 The clinical manifestation usually occurs when only minority of the islets are alive, which makes it difficult to find the primary reason of T1DM.3–6 A vast array of autoantigens was found to elicit aberrant immune responses.4 In fact, this may suggest that when autoreactive T cells or autoantibodies are present, the disease is at a very late stage, islet damage occurred at a high level and released autoantigens sensitized already many lymphocyte clones. While this epitope spread gives many autoimmune responses, it can be hypothesized that at least some of them are dominant over the others, which we aimed to assess in this study. The other driving force in the disease progression might be an immaturity of the immune system as suggested by mainly the pediatric population in whom T1DM occurs. Immune regulatory mechanisms are immature and inefficient in children.7 Hence, autoantigen and the balance between different regulatory and effector compartments might be important in the initiation and progression of T1DM. Finally, as a merging point, the important is if the same autoantigens are responsible for the activation of the entire immune system or there are unique epitopes that activate either T conventional cells (Tconvs) or T regulatory cells (Tregs).
Although the process inevitably kills the islets, the dynamics of the disease can be modified. Many experimental studies as well as clinical trials including our work with the administration of polyclonal Tregs to patients with T1DM proved that this T-cell subset can delay the process.8–12 From the immune point of view, adoptively transferred Tregs probably improve the regulation and slow down autoaggression towards the islets. It can be simply because of the increased proportion of these cells over autoreactive Tconvs after adoptive transfer but it could be also the influence of Tregs on other immune mechanisms. Hence, it seems to be important to follow the changes and proportions in the main subsets of T cells, both regulatory and effector/conventional ones, to decipher these mechanisms. In this context, the important is also which autoantigens drive these changes the most significantly.
Studies with humans are obviously limited mainly to the peripheral blood, which is a distant echo of the local process in the pancreas.13 On the other side, it is very fortunate for the research that patients with T1DM are very unified in terms of the genetic background, notably with human leucocyte antigen (HLA) genes involved in antigen presentation. Recruiting only those with diabetogenic haplotypes, such as DR4, reduces significantly heterogeneity of the immune responses related to HLA variability. Taking all this into account, we have decided to perform in this study a thorough analysis of the changes and subset proportions in a T-cell compartment and compare these changes between patients with newly diagnosed T1DM (NDT1DM) and long-duration T1DM (LDT1DM), the carriers of HLA-DRB1*04:01 haplotype. HLA-DRB1*04:01-positive patients with LDT1DM treated previously with polyclonal Tregs consisted of a separate group of patients in these comparisons to define the impact of the therapy on T-cell compartment in the long-term perspective. We have also performed the analysis of antigen-specific T-cell responses in this context to define which autoantigens influenced the T-cell compartment significantly and could be therefore a good target candidate in future therapies. We chose proinsulin and glutamic acid decarboxylase (GAD) peptides as they are the most common autoantigens in the literature and the reagents to detect them are the most reliable.
Materials and methods
Patients and material
The study enrolled 81 T1DM children diagnosed in compliance with the WHO criteria.14 All patients were the carriers of HLA-A*02:01 and HLA-DRB1*04:01 alleles. Other inclusion criteria were: ages 8–18 years old, the presence of GAD65, islet-cell antibodies (ICA), insulin autoantibodies (IAA) and body mass index range of 25–75 percentiles. The following exclusion criteria were applied: any cytopenia or anemia; positive test for hepatitis B virus, hepatitis C virus, HIV, Treponema pallidum or other active infections; the history of neoplasm; excessive anxiety related to the procedure and chronic disease other than T1DM requiring pharmacological treatment. Patients were divided into three groups according to the duration of T1DM and administered treatment (online supplementary table S1a,b) as NDT1DM with the disease diagnosed less than 3 months before blood donation (n=46), patients with LDT1DM with the disease lasting between 1 and 3 years and treated routinely with insulin only (n=27) and patients with LDT1DM with the disease lasting between 1 and 3 years who received in the past administration of polyclonal Tregs (LDT1DM with Tregs) (n=8) within the study TregVAC1.0 (http://www.controlled-trials.com/ISRCTN06128462). The administered dose was up to 30×106/kg body weight.
Supplemental material
Blood sample preparation
Venous blood fasting samples were collected twice during routine visits in the outpatient clinic between 08:00 and 09:00. The first sample (4 mL) was taken to find HLA-A*02:01 and HLA-DRB1*04:01 phenotypes. The second sample of 25 mL of blood was taken only from patients with the required phenotype. For 10 patients with NDT1DM prepared for the administration of Tregs within TregVAC2.0 study (see Manufacturing of polyclonal preparation of Tregs), the samples were taken during the manufacturing of the polyclonal Tregs to study ex vivo expansions of antigen-specific T cells.
Ficoll-Hypaque gradient centrifugation was used to obtain peripheral blood mononuclear cells. CD4+ and CD8+ T cells were separated using immunomagnetic kits (StemCell Technologies, Canada). The sera were centrifuged from blood samples taken without anticoagulant.
Clinical parameters
Clinical parameters, such as the levels of autoantibodies: GAD65 (IU/mL), ICA (titer), IAA (U/mL), c-peptide (ng/mL) levels, hemoglobin A1c (International Federation of Clinical Chemistry standard - IFCC (mmol/mL) and National Glycohemoglobin Standardization Program - NGSP (%)) and HLA on low and high resolution were assessed routinely at University Hospital Laboratory, Gdańsk.
Flow cytometry and tetramer stainings
Nine-color flow cytometry was performed. Data were acquired using LSR Fortessa flow cytometer and analyzed using FACS-DIVA software (BD Biosciences, USA). The following monoclonal antibodies (clones in brackets): anti-CD3 (UCHT1 and SK7), anti-CD4 (SK3), anti-CD8 (RPA-T8), anti-CD31 (WM59), anti-CD45RA (L48), and isotype controls (MOPC-21, G155-178, 27-35, G155-228) from BD Biosciences, Poland; anti-CD62L (Dreg 56) and isotype control (5.205) from eBioscience, Vienna, conjugated with the following fluorochromes: FITC, PE, Pe-TexasRed, PerCP, PerCP-Cy5.5, PE-Cy7, APC, APC-Alexa780, eFluor450 and V500 were used in the flow cytometric studies. Isotype controls and fluorescence minus one stainings were used to find cut-offs for positive signals.
The following tetramers from Proimmune Oxford, UK, were used: DRA1*01:01/DRB1*04:01-GAGSLQPLALEGSLQKRG ProT2-Tetramer-Proinsulin-73-90, DRA1*01:01/DRB1*04:01-IAFTSEHSHFSLK ProT2-Tetramer-GAD65-274-286, DRA1*01:01/DRB1*04:01-GIVEQCCTSICSLYQ ProT2-Tetramer-Proinsulin-90-104, DRA1*01:01/DRB1*04:01-NFIRMVISNPAAT ProT2-Tetramer-GAD65-555-567, A*02:01-HLVEALYLV Pentamer-Insulin-Beta-chain-10-18. Cut-off for the threshold was established using negative A*02:01-NEGATIVE-Pentamer and DRA1*01:01/DRB1*04:01-NEGATIVE ProT2-Tetramers as well as stainings from patients with unmatched HLA. Due to a very low frequency of tetramer-positive cells, at least 1×10⁶ events had been acquired in the lymphocyte gate to obtain representative numbers.
Intracellular staining of FoxP3 was performed in conjunction with surface staining using the Human FoxP3 Staining Kit (eBioscience, USA) containing anti-Foxp3 antibody (PCH101) according to the manufacturer’s instructions (online supplementary figure S1).
Phenotypes
The following phenotypes were examined in CD3+ T gate: naïve T cells (Tn) CD45RA+CD62L+, central memory T cells (Tcm) CD45RA−CD62L+ and effector memory T cells (Tem) CD45RA−CD62L− within the CD3+CD4+ and CD3+CD8+ T-cell subsets; and effector memory CD45RA (TemRA) CD3+CD8+CD45RA+CD62L− T cells. In addition, the expression of CD31 was measured in Tn gates to assess the level of recent emigrants.15 All the stainings were combined with tetramer and intracellular FoxP3 stainings to assess the levels of antigen-specific CD4+FoxP3− Tconvs, CD4+FoxP3+ Tregs and CD8+ T cells.
Flow-fluorescence in situ hybridization for telomere length
Telomeric sequences were detected in sorted CD4+ and CD8+ T cells with the flow- fluorescence in situ hybridization telomere kit (DAKO, Denmark) according to the manufacturer’s instructions (online supplementary figure S2).
Clonal vβ T-cell receptor repertoires
The repertoire of T-cell receptors (TCR) was analyzed using IOTest Β Mark TCR V Repertoire Kit (Beckman Coulter, USA) combined with naïve/memory phenotype and intracellular FoxP3 stainings according to the manufacturer’s manual (online supplementary figure S3). The technique allows for about 70% coverage of TCR of human T lymphocytes sorted into 24 families of different TCR vβ batches of clones.
Manufacturing of polyclonal preparation of Tregs
Polyclonal clinical preparations of Tregs were manufactured according to guidelines of Minimum Information about T Regulatory Cells model.10 16 Briefly, the blood cells were sorted to CD3+CD4+CD25highCD127−lin−doublet− Tregs (good manufacturing practice (GMP) antibodies, Miltenyi Biotec, Germany) with the purity of ~100% (median (min-max): 98% (97–99)) (GMP-adapted Influx, BD Biosciences, USA). In addition, autologous CD3+CD4+CD25 CD127+lin−doublet− Tconvs were sorted and used as a sentinel culture and reference for functional assays. Both subsets were subsequently cultured in GMP-grade X-VIVO20 medium (Lonza, Belgium) supplemented with 10% autologous serum, interleukin 2 (1000 U/mL, Proleukin, Chiron, USA) and clinical-grade anti-CD3/anti-CD28 beads (Miltenyi Biotec) in 1:1 ratio with cells. Tregs were cultured until the required number was achieved (median (min-max): 10 days (7–12)). On release, FoxP3 expression in Tregs preparation was assessed and amounted to above 90% (median (min-max)=93% (90–97)), cells were suppressive in interferon gamma suppression assay with autologous Tconvs and negative microbiological tests were confirmed. For the purpose of this study, the samples of expanded Tregs and Tconvs were taken for the analysis of antigen specificity with the tetramers on the day of release of the product (n=10). This procedure is a part of ongoing clinical trial TregVAC2.0. Written informed consent was taken from all the patients and their parents/legal representatives.
Statistics
Data were computed using the software Statistica V.12.0 (Statsoft, Poland). The analysis was based on two-tailed parametric analysis of variance with the least significant differences test as post hoc test to assess all two-group differences, t-tests and Pearson’s correlation as indicated by normal data distribution. P<0.05 was recognized as significant. For clarity of the main text, detailed statistics are presented in the figures and online supplementary tables only.
Results
Senescence of T-cell compartment in type 1 diabetes
There was a significant reduction in the length of telomeres in T cells in patients with T1DM. It was seen in both CD4+ and CD8+ T cells between NDT1DM and untreated LDT1DM subjects but not between NDT1DM and LDT1DM subjects treated with Tregs (figure 1). It was completed with the reduction in CD31+CD45RA+CD62L+ recent thymic emigrants, in which the percentage in both CD8+ and CD4+ T cells, including CD4+FoxP3+ Tregs, was significantly lower in LDT1DM as compared with NDT1DM subjects. Again, the difference was significant between NDT1DM and untreated LDT1DM subjects but not between NDT1DM and LDT1DM subjects treated with Tregs (figure 1).

The reduction in telomere length and recent emigrants in T cells from patients with type 1 diabetes mellitus (T1DM). The differences in the relative telomere length (RTL—upper charts) and the percentage of recent T-cell emigrants (percentage of CD31+ cells in Tn) were analyzed in both CD4+ and CD8+ T cells between newly diagnosed T1DM (NDT1DM), untreated long-duration T1DM (LDT1DM) and long-duration T1DM treated with Tregs (LDT1DM with Tregs) subjects. Due to technical issues RTL could be only measured in CD4+ and CD8+ T cells, while the percentage of recent emigrants could be measured in CD4+ Tconvs, CD4+ Tregs and CD8 T cells. Numbers of patients in the analysis: NDT1DM n=44, LDT1DM n=27, LDT1DM with Tregs n=8. Means±SD are shown. Significant differences are linked with p level written above the line (p<0.05). Statistics are found in online supplementary table S2a,b.
In addition, CD4+ Tconvs, CD4+FoxP3+ Tregs and CD8+ T cells were more differentiated with the progression of the disease. As compared with patients with NDT1DM, there was a significant shift from naïve (CD62L+CD45RA+) towards central (CD62L+CD45RA−) and effector (CD62L−CD45RA−) memory cells in CD4+ and CD8+ T cells in LDT1DM (online supplementary figure S4). As compared with untreated LDT1DM, LDT1DM subjects treated with Tregs were characterized by a lower proportion of TemRA CD8+ T cells. In contrast, CD4+ T cells in those treated with Tregs preparation contained a higher percentage of Tem Tconvs and a lower percentage of Tn Tregs (online supplementary figure S4).
The clonal repertoire in T-cell compartment in type 1 diabetes
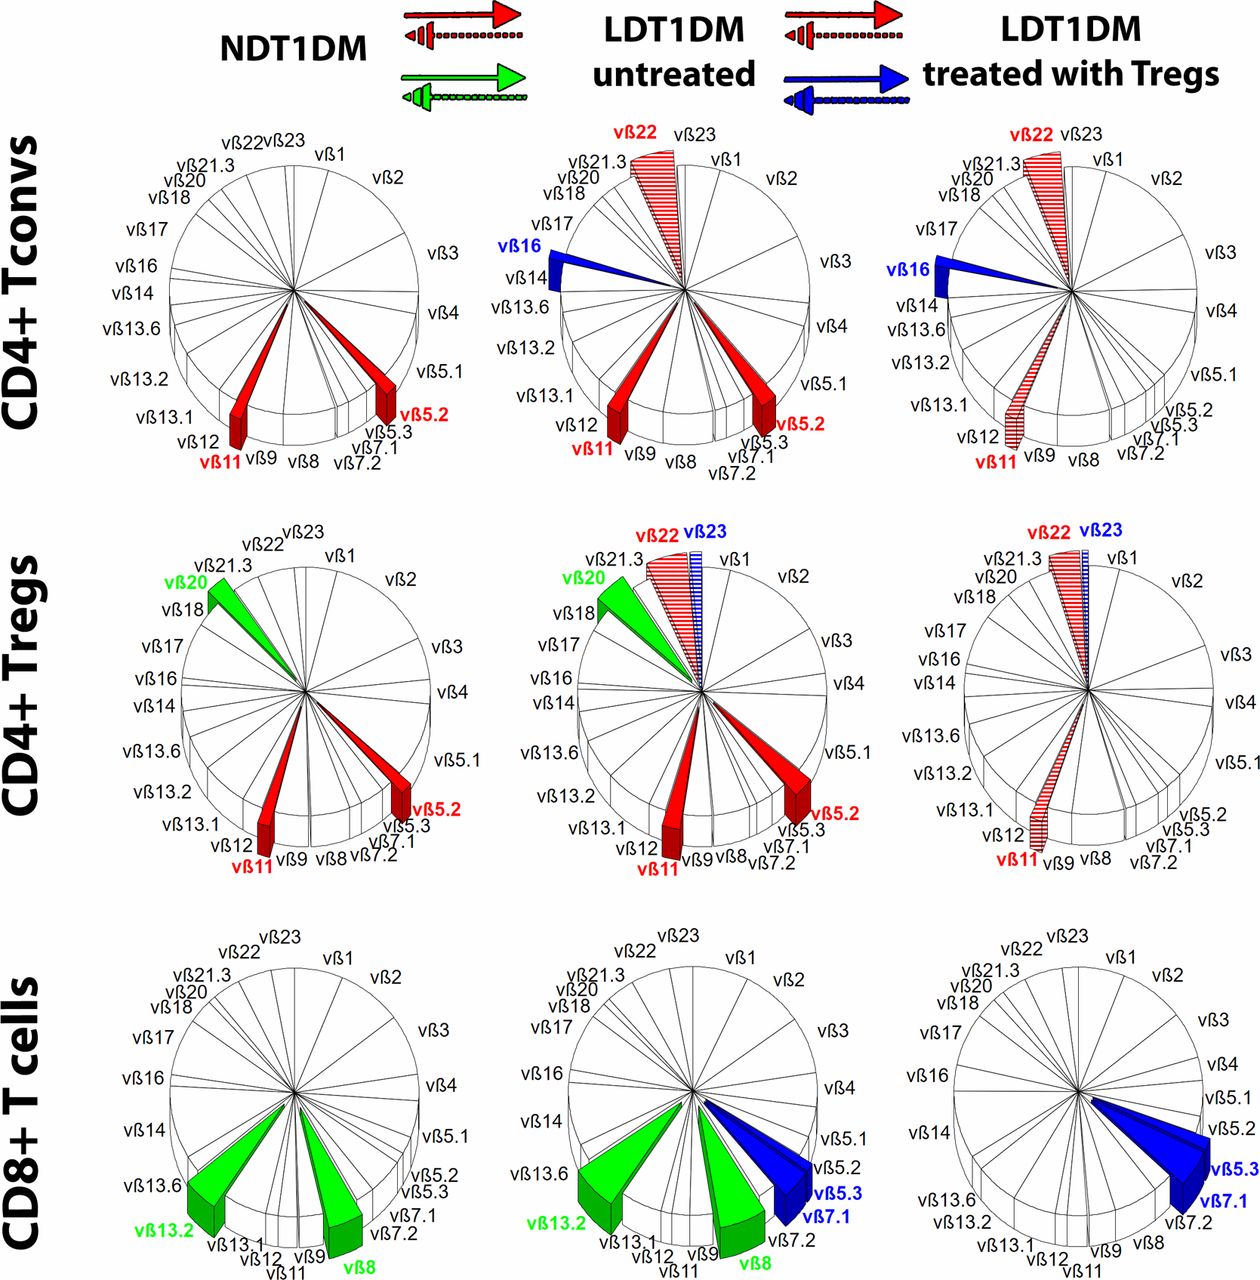
It was found that the percentage of some CD4+ TCR families changed significantly in LDT1DM as compared with NDT1DM. There was a partial overlap in the type of changing clones between CD4+ Tconvs and Tregs (clones vβ5.2, vβ11, vβ22), while some other clones were changed either in Tconv or in Treg subsets only (figure 2). As compared with NDT1DM, the percentage of vβ5.2, vβ11 TCR families increased in both Tconvs and Tregs in untreated LDT1DM. Such an increase in the percentage of these clones was not seen in LDT1DM treated with Tregs.

Differences in T-cell receptor (TCR) repertoire. The repertoire of TCR vβ families is shown in three groups of patients: NDT1DM, LDT1DM untreated and LDT1DM treated with Tregs. Mean percentages for each TCR family are shown in circle charts and the whole repertoire in each circle chart is 100%. The following lymphocytes were examined: CD4+ Tconvs, CD4+ Tregs, CD8+ T cells. The significant differences in the percentage of particular vβ family of clones were analyzed either between NDT1DM and untreated LDT1DM or between untreated LDT1DM and treated with Tregs. The overlapping vβ clones, in which percentage changed significantly in both CD4+ Tconvs and Tregs, are shown in red. The vβ clones, in which percentage changed significantly only between NDT1DM and untreated LDT1DM, are shown in green and only between LDT1DM untreated and LDT1DM treated with Tregs are shown in blue. If there was the increase in the percentage (from NDT1DM to untreated LDT1DM or from untreated LDT1DM to LDT1DM treated with Tregs), the clones are entirely covered with the color, while when the percentage decreased (from NDT1DM to untreated LDT1DM or from untreated LDT1DM to LDT1DM treated with Tregs) the clones are covered in colored stripes. The colors are given to the significant changes only (p<0.05). Numbers of patients in the analysis: NDT1DM n=38, LDT1DM n=21, LDT1DM with Tregs n=8. Statistics are found in online supplementary tables S3a,b. LDT1DM, long-duration type 1 diabetes mellitus; NDT1DM, newly diagnosed type 1 diabetes mellitus.
CD4+ T-cell compartment in LDT1DM treated with Tregs appeared to be more polyclonal than in untreated LDT1DM, especially when naïve/memory subsets were taken into account (online supplementary figure S5). The clones in which percentage was increased significantly were found mainly in untreated LDT1DM in Tcm and Tem compartments, while the percentage of these clones in patients with LDT1DM treated with Tregs was lower and similar to NDT1DM (online supplementary figure S5).
Antigen-specific T cells
Tregs and Tconvs specific for one of four different epitopes, two for proinsulin and two for GAD65, were detected in the peripheral blood. In addition, one reactivity against the proinsulin epitope was analyzed in CD8+ T cells (figure 3).

Antigen-specific T-cell responses in type 1 diabetes CD4+ T cells specific to 73–90-proinsulin (A), 90–104-proinsulin (B), GAD65-274–286 (C), GAD65-555–567 (D) and CD8+ T cells specific to 10–18-Β-chain-proinsulin (E) were analyzed. The percentages of antigen-specific CD4+FoxP3− Tconvs and CD4+FoxP3+ Tregs (top line black bar charts in A–D), their naïve/memory subsets (Tn/Tcm/Tem in the middle line pie charts in A–D) as well as the percentages of CD31+ Tn recent emigrants (bottom gray bar charts in A–D) were compared between newly diagnosed T1DM (NDT1DM), untreated long-duration T1DM (LDT1DM) and long-duration T1DM treated with Tregs (LDT1DM with Tregs). Figure 3E presents similar changes in CD8+ T cells specific to proinsulin Β-chain-10–18. Means±SD are shown in the column charts and significant differences are linked with p level written above the line (p<0.05). Pie charts show mean percentages for naïve/memory subsets and the circle sum is 100%. The colors in pie charts are given only to the subsets in which percentage changed significantly between the groups (p<0.05). Numbers of patients in the analysis: NDT1DM n=39, LDT1DM n=25, LDT1DM with Tregs n=8. Statistics are found in online supplementary tables S4a–e. T1DM, type 1 diabetes mellitus.
73-90-proinsulin
The most informative was the response to proinsulin epitope 73-90. As compared with patients with NDT1DM, the percentage of proinsulin-specific Tregs and Tconvs was higher in patients with LDT1DM (figure 3A—a black bar graph). Interestingly, the percentage of specific Tregs within all Tregs was higher when compared with the percentage of specific Tconvs in all Tconvs (NDT1DM: 0.29% (Tregs) vs 0.12% (Tconvs); LDT1DM: 0.48% (Tregs) vs 0.20% (Tconvs)).
The subsets of proinsulin epitope 73-90-specific CD4+ T cells
As compared with NDT1DM, there was a significant shift from naïve (Tn) towards central (Tcm) and effector (Tem) memory cells in proinsulin-specific Tregs and Tconvs in LDT1DM. The change was not significant only for Tem Tregs (figure 3A—a pie chart).
Recent emigrants CD31+CD45RA+CD62L+ in 73-90-proinsulin-specific CD4+ T cells
There was a significant reduction in the percentage of recent emigrants within 73-90-proinsulin-specific Tregs between NDT1DM and LDT1DM. Similar changes were found in Tconvs but they were insignificant (figure 3A—a gray bar graph).
Treatment with Treg preparation and 73-90-proinsulin-specific CD4+ T cells
The only difference was a significantly higher percentage of Treg recent emigrants in LDT1DM treated with Tregs than in untreated LDT1DM. It was preserved in LDT1DM treated with Tregs to the levels noted in NDT1DM.
90-104-proinsulin
As compared with NDT1DM, the percentage of Tregs specific for 90-104-proinsulin was higher in LDT1DM (figure 3B—a black bar graph). Like in 73-90-proinsulin responses, there was a significant shift from Tn towards Tcm and Tem subsets in patients with LDT1DM (figure 3B—pie chart). Interestingly, patients with LDT1DM treated with Tregs were found to keep the highest percentage of Tcm within both, Tconvs and Tregs. Patients with LDT1DM treated with Tregs kept also a higher percentage of recent emigrants within 90-104-proinsulin-specific Tregs than those untreated (figure 3B—a gray bar graph).
GAD65-274-286
There were no significant differences in the percentage of specific Tregs or Tconvs between patients with NDT1DM and LDT1DM (figure 3C). When the subsets were taken into account, the significant reduction in the percentage of Tn Tregs between NDT1DM and LDT1DM was found. Notably, patients with LDT1DM treated with Tregs contained also a higher percentage of Tem in both, Tconv and Treg compartments (figure 3C—pie chart). There was a significant reduction in the percentage of recent emigrants within GAD65-274-286-specific Tregs between NDT1DM and untreated LDT1DM (figure 3C—a gray bar graph).
GAD65-555-567
There were no significant differences in the total percentage of GAD65-555-567-specific Tconv or Treg between patients with NDT1DM and LDT1DM (figure 3D). When the subsets were taken into account, a significant shift from Tn towards Tcm and Tem Tconvs was found in LDT1DM as compared with NDT1DM. For Tregs, a significant decrease in the level of specific Tn Tregs was noted. There was a significant reduction in the percentage of recent emigrants within GAD65-555-567-specific Tconvs between NDT1DM and LDT1DM.
10-18-Β-chain-proinsulin (CD8+ T cells)
The percentage of proinsulin-specific CD8+ T cells was higher in patients with LDT1DM than with NDT1DM (figure 3E). Looking into the subsets, when compared with patients with NDT1DM, the reduction of Tn CD8+ T cells at the expense of the higher percentage of Tem CD8+ T cells was found in patients with LDT1DM. There was a significant reduction in the percentage of recent emigrants within Β-chain-10-18-specific CD8+ T cells between NDT1DM and LDT1DM. On the other side, LDT1DM treated with Tregs were characterized by a significantly higher percentage of recent emigrants within 10-18-β-chain-proinsulin-specific CD8+ T cells than those untreated.
Antigen-specific T cells in ex vivo expansions
The analysis of the clinical products of polyclonal Tregs, as well as autologous sentinel CD4+ Tconv expansions, revealed that the percentages of all analyzed specific subsets were higher in the expansion cultures than in the peripheral blood of the patients. In addition, the comparison of the ratios between the percentage in the expansion product and peripheral blood revealed that in three out of four analyzed specific subsets, the dynamics of proliferation in the expansion cultures were higher in specific CD4+ Tconvs than in specific Tregs (table 1).
The ratio between the percentage of specific cells (Tregs and Tconvs) in the ex vivo expansions and peripheral blood (n=10)
Nevertheless, the percentage of the examined proinsulin-specific Tregs, notably 73-90-proinsulin, in the expansion cultures of polyclonal Tregs was higher than the percentage of proinsulin-specific Tconvs in autologous sentinel expansion cultures of Tconvs (table 1 and online supplementary figure S6 and online supplementary figure S5). This could be related to the high number of 73-90-proinsulin-specific Tregs in the peripheral blood and subsequently at the beginning of expansion cultures. Such a difference between Tregs and Tconvs was not seen when the percentages of GAD65-specific subsets were compared in the cultures after expansion.
Correlations between clinical responses and antigen-specific T cells in type 1 diabetes
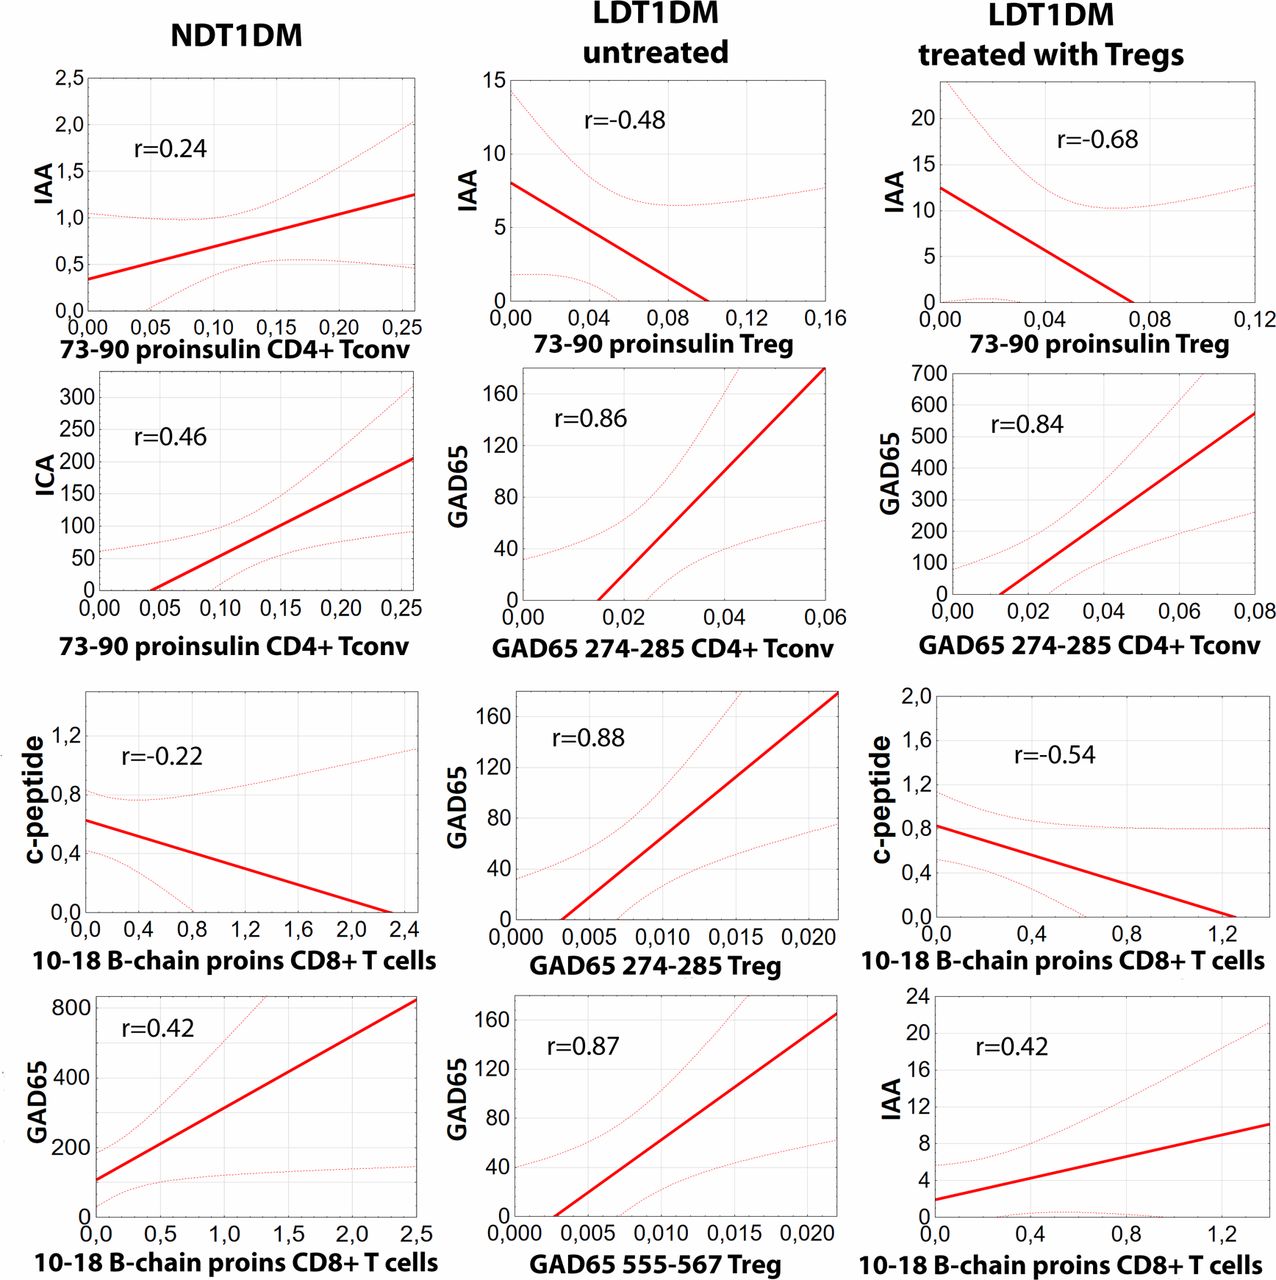
The percentages of all antigen-specific CD4+ Tconvs, CD4+ Tregs and CD8+ T cells were correlated to the levels of fasting c-peptide and the titers of three clinically relevant autoantibodies: ICA, IAA, and GAD65 in each group of the patients: NDT1DM, LDT1DM untreated and LDT1DM treated with Tregs (figure 4). Only statistically significant correlations are shown. The most coherent response was found for 73-90-proinsulin-specific T cells. There was a statistically significant positive correlation between 73-90-proinsulin-specific Tconvs and ICA and IAA titers in patients with NDT1DM. These associations disappeared in patients with LDT1DM but a significant negative correlation between 73-90-proinsulin-specific Tregs and IAA was found instead. The correlation was stronger in LDT1DM treated with Tregs than in those untreated. Some other correlations were also found proving dysregulation of the immunity.
Correlations between clinical responses and antigen-specific T cells in type 1 diabetes. Statistically significant correlations (p<0.05) between the percentages of particular antigen-specific T cells and the level of fasting c-peptide (ng/mL) or the titers of autoantibodies GAD65 (IU/mL), ICA (titer), and IAA (U/mL) are shown for patients with newly diagnosed T1DM (NDT1DM), untreated long-duration T1DM (LDT1DM) and long-duration T1DM treated with Tregs (LDT1DM with Tregs). For each correlation ‘r’ value is given in the chart. Please note that ONLY significant correlations are presented for each group of the patients. Numbers of patients in the analysis: NDT1DM n=39, LDT1DM n=25, LDT1DM with Tregs n=8. Detailed statistics with all results are found in online supplementary table S6. IAA, insulin autoantibody; ICA, islet-cell antibodies; T1DM, type 1 diabetes mellitus.
Discussion
In the current study, the immunosenescence-like changes of T cells along with the progression of T1DM were found. This was associated with the expansion of some T-cell clones, at least partially the same between Tregs and Tconvs. Proinsulin-specific Tregs, mainly to proinsulin epitope 73-90, were mostly associated with counteracting immunosenescence-like changes and relieved immune response in the disease. Interestingly, clinical preparations of polyclonal Tregs contained preferentially expanded proinsulin-specific Tregs. Patients treated with adoptive transfer of these preparations were characterized by higher diversity of vβ TCR repertoire and a higher level of recent emigrants within proinsulin-specific Tregs.
Not surprisingly, like in the majority of chronic diseases, the T-cell compartment in T1DM underwent immunosenescence-like changes.17 When newly diagnosed (NDT1DM) patients were compared with long duration (LDT1DM) ones, it could be found a shift from naïve towards more differentiated subsets of lymphocytes. Such a shift has been already reported by us previously in LDT1DM.18 Other features of such immunosenescence-like changes, such as an increased level of proinflammatory cytokines with the progression of the disease, have been also reported including our previous works.11 19 In this trial, we described additional changes, such as a reduction in the percentage of CD62L+CD45RA+CD31+ recent emigrants, shortening of T-cell telomeres and subtle expansions in several types of T-cell vβ TCR clones seen mainly in memory T-cell subsets. Although the study did not recruit healthy controls, as healthy DR4 carriers are in a high risk of developing T1DM in the future, it is reasonable to state that the shift was associated with the disease progression and not with the age only (no significant age difference between NDT1DM and LDT1DM cohorts). The finding is important because the shift towards memory subsets may be dangerous as—by definition—memory T cells are equipped with molecular hardware allowing them to respond quickly to the challenge. It is beneficial during infections but when T cells are autoaggressive it accelerates the autoimmune process including the damage of self-tissues and epitope spread.20 There are reports that memory T cells are difficult to be regulated and easily break tolerance.21–23 Specifically in T1DM, memory T cells were described as capable to traffic to the islets and kill beta cells.24 25 From this angle, the Treg treatment, if effective, should be able to reduce the continued expansion and maturation of pathogenic effectors and all other immunosenescence-like changes.
Interestingly, the treatment with ex vivo expanded Tregs in patients with LDT1DM was associated with the most significant reduction in the level of Tn Tregs, while changes in memory compartments did not reach statistical significance. This paradox is probably an artifact due to the FoxP3highCD45RA− phenotype of administered Tregs. Of note, these cells are suppressive and do not affect endogenous Tregs.11 26 On the good side, adoptive transfer with Tregs was associated with reduced levels of TemRA CD8+ T cells in LDT1DM—notorious subset aggravating autoimmune processes including T1DM.27 28 Administration of Tregs was also associated with preserved more polyclonal vβ TCR repertoire of all T-cell subsets and longer telomeres. Although the differences in the pattern of the vβ TCR repertoire were subtle, it might improve infectious responses. Indeed, we have previously reported that the general immunity of patients treated with Tregs, including postimmunization responses, is not affected and comparable to healthy children.12 The obtained results of vβ TCR cell clonality can also give some insight into the pathogenesis of T1DM. The partial overlap in the expanded clones in LDT1DM in Tconvs and Tregs, such as vβ5.2, vβ11 and vβ22, suggests that, at least to some extent, there is a common autoantigen(s) which drives both regulatory and effector arms of the immune response, as the same TCRs are engaged in both populations. It may be also important for potential antigen-specific therapeutic strategies as the intensity of response to the same epitope may differ between Tconvs and Tregs. So, the ideal therapeutic antigen would be the one with a high affinity towards Tregs only. Nature dictates that this is possible. For example, contrary to our findings in T1DM, in allergies Tconvs and Tregs recognize different epitopes.29
Looking into antigen-specific responses, proinsulin seemed to be the driving force that changes proportions of immune cells in T1DM and both Tconvs and Tregs are affected. We have found an increase in the percentage of proinsulin-specific CD4+ and CD8+ T cells associated with the progression of T1DM. The most informative was the response to the 73-90-proinsulin epitope. The percentage of 73-90-proinsulin-specific CD4+ Tregs and Tconvs was significantly higher in patients with LDT1DM as compared with NDT1DM. In both subsets a shift from Tn to Tcm and the reduction in the percentage of recent emigrants in Tregs were found. Interestingly, patients with LDT1DM treated with Tregs preserved a high percentage of recent emigrants in 73-90-proinsulin-specific Tregs. This juvenile effect is of special importance as continuous delivery of antigen-specific Tregs, like 73-90-proinsulin-specific Tregs, from thymus could attenuate the progression of autoimmune processes, such as epitope spread. The 73-90-proinsulin-specific Tregs were the only subset examined in the paper which level correlated with diminished autoantibody responses in patients with LDT1DM. These cells were also the only Tregs able to expand to a higher percentage than corresponding 73-90-proinsulin-specific Tconvs in vitro, which might explain why these Tregs could harness in vivo immune responses in T1DM. Although less significant, similar changes were found in the proinsulin 90-104-specific CD4+ T cells as well as CD8+ Tconv cells specific to 10-18-β-chain-proinsulin. The importance of proinsulin response was confirmed with the clinical markers of T1DM. When these markers were correlated with antigen-specific T cells, the most coherent response was found for 73-90-proinsulin-specific T cells. In NDT1DM, 73-90-proinsulin-specific Tconvs positively correlated with ICA and IAA explaining the early progression of the disease, while in LDT1DM 73-90-proinsulin-specific Tregs correlated negatively with IAA suggesting an attempt of counteractive action to restore the balance between specific Tconvs and Tregs. Interestingly, the correlation was stronger in LDT1DM treated with Tregs than in those untreated. It clearly suggests that different epitopes of proinsulin might be considered as peptide-based therapeutics when their action on different subsets of T cells is verified.25 30–32
Strikingly, the percentage of disease-specific T cells at the periphery was extremely low but it was changing significantly in the expansion cultures. It clearly shows that changes in situ can be much more furious than those at the peripheral blood. Different dynamics of the proliferation between Tconvs and Tregs in response to the same challenge as shown in this study in the expansion cultures confirms also the hypothesis that the same (auto)antigens may tip the balance of immune response. In the pathogenesis of the autoimmune disease, autoantigens probably activate preferentially effector phase over regulatory one as Tregs proliferate very slowly and Tconvs overgrow them. Reversing this can be a hint for effective therapy as the development and use of tolerogenic peptides with high affinity exclusively to Tregs may preferentially promote regulatory responses and therefore stop or delay the progression of the disease.
T1DM has a chronic inflammatory component which makes T cells immunosenescent and less polyclonal with its progression. The expansion of the same TCR families in both Tconvs and Tregs suggests that there is common autoantigen(s) which drive(s) the progression of the disease. It seems that proinsulin is the most important autoantigen when organ-specific T-cell responses are taken into account. Importantly, the expansion of Tregs for clinical purposes is associated with a preferential increase in the level of disease-specific Tregs, notably proinsulin-specific Tregs. The patients treated with such a product were characterized by more polyclonal repertoire of T cells, longer telomeres and preserved levels of proinsulin-specific recent emigrants within Tregs. For these reasons, future therapies should consider cellular products enriched with such antigen-specific Tregs.
Acknowledgments
We thank Mrs Anita Dobyszuk, Mrs Grażyna Gniłka, Mrs Lucyna Szumacher-Sharma and Mrs Justyna Drabik from the Medical University of Gdańsk Medical Centre for their perfect assistance in laboratory and clinical procedures.
References
Footnotes
MG and DI-G contributed equally.
Contributors MG and DIG contributed to the study design, protocol writing, cell preparation, data collection, analysis, interpretation, and writing and reviewing of the report. AWD, MT, MŻ, MH, HZ, JZD, and MZ contributed to lab assays, data collection and interpretation. AJC contributed to clinical assessment and data collection. RO, PJC, AB, AS, WM, NMT, GM, and JS contributed to data collection and interpretation and reviewed the report. AB contributed to data collection and interpretation and reviewed the report. MM was a clinical principal investigator, contributed to data collection, interpretation and reviewed the report. PT was a supervisor of the study who contributed to the study design, protocol writing, cell preparation, data collection, analysis, interpretation writing and reviewing of the report. PT is the guarantor of the study.
Funding This work was supported by the National Centre for Research and Development, Poland (grant numbers LIDER/160/L-6/14/NCBR/2015 and STRATEGMED1/233368/1/NCBR/2014).
Competing interests NMT, MM and PT are coinventors of patent related to presented content and stakeholders and advisors of POLTREG venture. The Medical University of Gdańsk received payment for the license to presented content.
Patient consent for publication Not required.
Ethics approval The studies in this report were conducted according to the protocols approved by the Ethics Committee of the Medical University of Gdańsk (no NKBBN/32/2015). Written informed consent was taken before starting the procedures from all the patients and they parents/legal representatives.
TregVAC1.0 study (http://www.controlled-trials.com/ISRCTN06128462) mentioned in the paper received approval from the Ethics Committee of the Medical University of Gdańsk no NKEBN/8/2010.
TregVAC2.0 study (EudraCT: 2014-004319-35) mentioned in the paper received approval from the Ethics Committee of the Medical University of Gdańsk NKBBN/374/2012 with amendment NKBBN/374-7/2014.
Provenance and peer review Not commissioned; externally peer reviewed.
Data availability statement All data relevant to the study are included in the article or uploaded as supplementary information. The raw data are available upon request from corresponding author upon signing confidentiality agreement.