Article Text

Abstract
Introduction Patients with the ultra-rare Wolfram syndrome (WFS) develop insulin-dependent diabetes and progressive neurodegeneration. The aim of the study was to quantify microRNAs (miRNAs) in sera from patients with WFS, correlate their expression with neurological imaging over time and compare miRNA levels with those observed in patients with type 1 diabetes mellitus (T1DM).
Research design and methods We quantified miRNA expression (Qiagen, Germany) in two groups of patients: with WFS at study entry (n=14) and after 2 years of follow-up and in 15 glycated hemoglobin-matched (p=0.72) patients with T1DM.
Results We observed dynamic changes in the expression of multiple miRNAs in patients with WFS parallel to disease progression and in comparison to the T1DM patients group. Among miRNAs that differed between baseline and follow-up WFS samples, the level of 5 increased over time (miR-375, miR-30d-5p, miR-30e-30, miR-145-5p and miR-193a-5p) and was inversely correlated with macular average thickness, while the expression of 2 (let-7g-5p and miR-22-3p) decreased and was directly correlated with neuroimaging indicators of neurodegeneration.
Conclusions Our findings show for the first time that serum miRNAs can be used as easily accessible indicators of disease progression in patients with WFS, potentially facilitating clinical trials on mitigating neurodegeneration.
- diabetes mellitus
- type 1
- biomarkers
- genetic diseases
- inborn
This is an open access article distributed in accordance with the Creative Commons Attribution Non Commercial (CC BY-NC 4.0) license, which permits others to distribute, remix, adapt, build upon this work non-commercially, and license their derivative works on different terms, provided the original work is properly cited, appropriate credit is given, any changes made indicated, and the use is non-commercial. See: http://creativecommons.org/licenses/by-nc/4.0/.
Statistics from Altmetric.com
Significance of this study
What is already known about this subject?
Wolfram syndrome (WFS) is a progressive neurodegenerative disorder with accompanying insulin-dependent diabetes as the first symptom present in patients. Based on neuroimaging studies such as optical coherence tomography (OCT) and MRI, initial clinical markers of disease progression were selected.
What are the new findings?
Our results define for the first time changes in the expression of miRNAs in patients with WFS and show that selected serum miRNAs can be used as easily accessible indicators of disease progression in patients with WFS.
How might these results change the focus of research or clinical practice?
The obtained results indicate the possibility of using selected miRNAs as disease progression markers in future clinical trials. In addition, some of the miRNAs may be potential therapeutic targets or endoplasmic reticulum (ER) stress inhibitors.
Introduction
Monogenic diabetes in children and adolescents represents approximately 8% of all cases of diabetes and may coexist with disorders of various organs.1–4 Among rare syndromic forms of monogenic diabetes diagnosed in children over 6 months of age, the most common one is Wolfram syndrome (WFS) (OMIM 222300) with a prevalence of 0.1%–0.6%, depending on the population.5–7 This syndrome is mainly caused by recessive mutations in the WFS1 gene.8 The clinical criteria for diagnosing WFS are: insulin-dependence, non-autoimmune diabetes mellitus and progressive optic atrophy. Other typical symptoms are also caused by increased endoplasmic reticulum (ER stress and include progressive deafness, diabetes insipidus, urodynamic and psychiatric disorders and neurological abnormalities.9 10 The latter are the most common cause of death in patients with WFS, typically about the age of 40 years. Currently, the only available treatment of WFS is symptomatic and the markers of disease progression are still being defined. Such markers can be identified using neuroimaging studies11 12 or, more recently, high-throughput technologies13 that enable proteomic, metabolomic and genomic profiling of clinical samples. Measuring the expression of non-coding RNAs, including miRNAs, is another innovative method with great potential to identify biomarkers of WFS progression.
MicroRNAs (miRNAs), short non-coding RNAs (~22 nucleotides) have shown to play multiple vital biologic roles in humans and other organisms. A single miRNA recognizes a large number of mRNA targets, which allows one miRNA to affect a score of different mRNA products and exert potent biological function through suppression of pathways regulating complex biologic processes. Recent studies have shown that miRNAs are present inside the cells and in blood serum.14 Their resistance to physical factors and stability of their concentrations made miRNAs a promising group of biomarkers, which was first demonstrated in some types of cancer.15 Moreover, recent bioinformatics studies have provided evidence on the potential role of selected miRNAs in the regulation of processes occurring also in beta cells and ER stress modulation.16 17 Our group has shown earlier that miRNA levels in the serum are linked to aberrant intracellular expression in different forms of monogenic diabetes and as such can be used as biomarkers in the differential diagnosis of these diseases.18 Therefore, we hypothesized that in WFS the enhanced ER stress may result in altered miRNA expression levels both intracellularly and extracellularly, urging us to evaluate their expression patterns in parallel to the progression of neurodegenerative process in WFS.
The aim of the study was to identify dynamic changes in the expression profile of miRNA in patients with WFS at two time points, to compare their levels with miRNA expression in sera of patients with type 1 diabetes mellitus (T1DM) and also in relation to the results of neurological imaging studies.
Research design and methods
Study participants
Either the patients or their parents gave their written informed consent for participation in the study. Patients were recruited in a nationwide collaborative programme of genetic screening for monogenic diabetes between 2007 and 2017 as described earlier.3 19 All patients with WFS had biallelic mutations in the WFS1 gene, which was confirmed by direct sequencing of the WFS1 gene, as described previously19 and clinical symptoms indicative of WFS.
A group of patients with T1DM matched for glycated hemoglobin (HbA1c) (last year average of at least three Diabetes Control and Complications Trial-compliant measurements) was recruited from the Department of Pediatrics, Oncology, Hematology and Diabetology of the Medical University of Lodz.
miRNA expression quantification was performed twice in patients with WFS: at baseline and at follow-up. Additionally, three patients identified as having WFS in 2018 were enrolled into the study—as they were substantially older than the remainder of the prospectively followed cohort, we grouped their samples with the WFS follow-up samples for comparative purposes.
Sera from patients with T1DM were evaluated once. The average duration of follow-up in the WFS group was planned to be between 20 and 24 months depending on the availability of patients and scheduling opportunities for neuroimaging and ophthalmological studies. At all visits of patients from both groups, 2 mL of serum was drawn during routine examinations in their medical centers.
Analysis of miRNAs
Quantitative PCR miRNome Human panels I&II (Qiagen, Hilden, Germany) were used to profile 752 miRNAs present in the human serum. miRNA expression was normalized to the mean expression of all miRNAs detectable in all samples (n=56). miRNAs detectable in at least half of patients in each of the three sets of samples (WFS baseline, WFS follow-up and T1DM) were used for the analysis (n=148). Batch effect was removed using ComBat algorithm.20
Neuroimaging studies
Expression of miRNAs in patients with WFS and their changes over time were analyzed in relation to the results of simultaneous optical coherence tomography (OCT) and MRI tests of central nervous system, which are routinely performed in these patients in order to assess the progression of the disease, as described in detail previously.12 21
The OCT examinations were performed in the Department of Ophthalmology and Vision Rehabilitation of the Medical University of Lodz, Poland, with Topcon 3D Optical Coherence Tomograph 1000 (MARK II, V.3.51, Topcon, Paramus, New Jersey, USA). We measured the following parameters: total thickness of the retinal nerve fiber layer (RNFL), superior RNFL thickness, inferior RNFL thickness, average retinal thickness, central thickness and total retinal volume using three-dimensional (3D) disc and 3D macula scans with a 6×6 mm area. Averages from measurements in both eyes were calculated and used for further analysis, as described previously.22
Brain MRI examinations were conducted on an Achieva 3.0T scanner (Philips, Cambridge, Massachusetts, USA) in axial, coronal and sagittal planes consisting of about 1000 images for each patient. We also performed a volumetric brainstem assessment using the Tumor Tracking application on the Intellispace Portal workstation (Philips). The midbrain with cerebral peduncles, pons, medulla oblongata, cerebellar peduncles and corpus of cerebral medulla were manually divided into three perpendicular axes and their volumes were automatically calculated in millimeters.
Statistical analysis of miRNA expression values between groups were compared using two-sided unpaired Student’s t-test for the comparison of WFS and patients with T1DM or using the paired t-test for the comparison of patients with WFS at baseline and follow-up. Since not all baseline samples for patients with WFS were available, as described earlier, the paired comparison was performed using the data from 11 patients with WFS with both the baseline and follow-up miRNA expression. WFS baseline versus T1DM comparison was performed using the data from 15 patients with T1DM and 11 patients with WFS and the WFS follow-up versus T1DM comparison was performed using the data from 15 patients with T1DM and 14 patients with WFS (including the 3 patients with WFS with a single blood sample due to late recruitment).
The relationships between the results of the OCT and MRI studies and miRNA levels were assessed using Pearson’s correlation test. Hierarchical clustering was performed using miRNAs differentially expressed between patients with WFS at baseline and follow-up (p<0.05), with Euclidean distance as distance measure between points and average linkage algorithm. Principal component analysis (PCA) was performed using the same miRNAs.
No missing value imputation was used for this study. Due to the low statistical power resulting from small number of patients, no multiple comparisons correction was applied and p values <0.05 were considered statistically significant.
Statistical analyses were performed with Statistica V.13.1 PL (StatSoft, Tulsa, Oklahoma, USA) and MultiExperiment Viewer (Dana-Farber Cancer Institute, Boston, Massachusetts, USA). Graphs were created using Statistica V.13.1, MultiExperiment Viewer and R V.3.6.1 with ggplot2 V.3.2.1 package.
Results
The mean age of patients with WFS at study entry was 20.4 years (25%–75%, 17.4–21.3). The T1DM group was slightly younger with a mean age of 16.8 years (25%–75%, 15.2–19.5), although the difference was not statistically significant (p=0.07). The groups did not differ in terms of sex distribution (p=0.25) and the average HbA1c level (p=0.72) (table 1).
Clinical characteristics of the patients from the study groups
The presence of autoantibodies specific for T1DM was detected only in patients with T1DM. At the time of blood collection, none of the patients had diabetic ketoacidosis, and blood glucose level for diabetic patients ranged from 76 to 152 mg/dL. All patients with either WFS or T1DM had diabetes mellitus recognized according to WHO criteria and were treated with subcutaneous intensive insulin therapy. Detailed clinical characteristics of the patients with WFS and T1DM are shown in table 1.
After removing the batch effect and normalization of miRNA expression levels, 26 miRNAs were identified as differently expressed between WFS follow-up and baseline samples. Hierarchical clustering performed using these miRNAs (figure 1A) and PCA (figure 1B) showed some separation of the groups. Among these miRNAs, 18 were detected at higher levels in follow-up than baseline WFS samples (hsa-miR-339-5p, hsa-miR-30d-5p, hsa-miR-30c-5p, hsa-miR-139-5p, hsa-miR-27b-3p, hsa-miR-574-3p, hsa-miR-23b-3p, hsa-miR-126-3p, hsa-let-7d-3p, hsa-miR-584-5p, hsa-miR-532-3p, hsa-miR-421, hsa-miR-382-5p, hsa-miR-375, hsa-miR-30e-3p, hsa-miR-193a-5p, hsa-miR-145-5p, hsa-miR-374a-5p). Conversely, eight miRNAs showed a decrease of expression in follow-up samples in comparison to baseline: hsa-let-7g-5p, hsa-miR-106a-5p, hsa-miR-15a-5p, hsa-miR-29b-3p, hsa-miR-652-3p, hsa-miR-148b-3p, hsa-miR-144-3p and hsa-miR-22-3p.
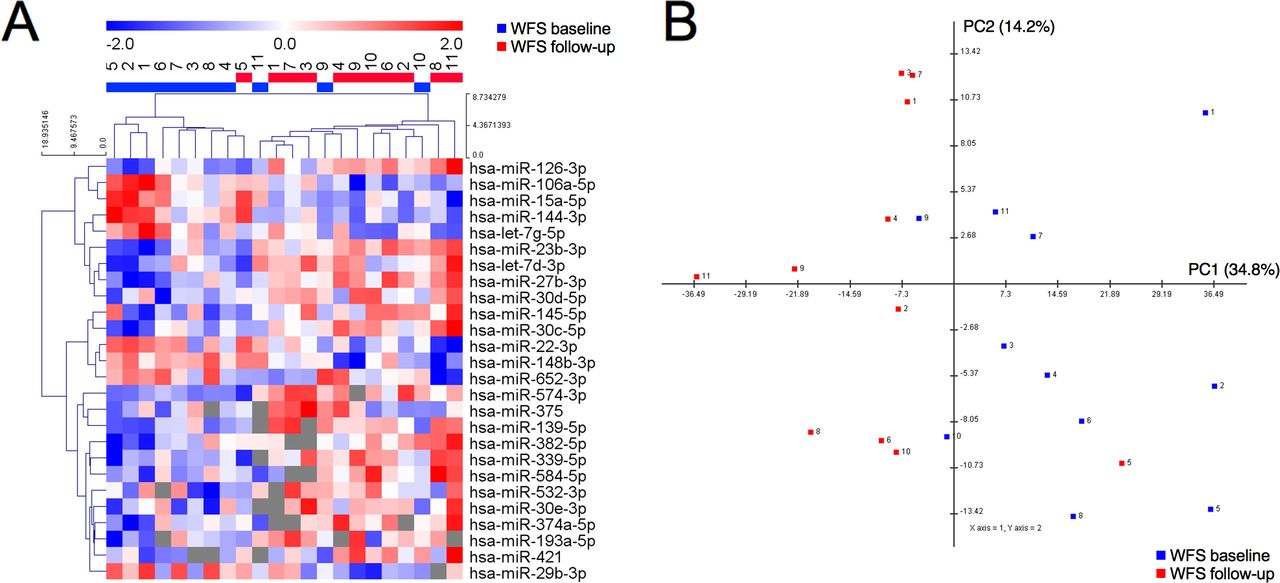
Profile of differentially expressed (at p<0.05) microRNAs (miRNAs) distinguish baseline and follow-up samples from patients with Wolfram syndrome (WFS). (A) Heatmap and hierarchical clustering of differentially expressed miRNAs. (B) Principal component analysis of patient samples based on the expression of differentially expressed miRNAs. Numbers designate samples from the same patient.
We then assessed the potential of these differentially expressed miRNAs as biomarkers of the progression of neurodegenerative process in WFS. Among variables assessed during OCT, we focused on macular average thickness (MAT) since the results of this measurement were available for the greatest number of patients and it is considered the most reliable and long-term indicator of neurodegeneration. We searched for significant correlations between the level of 26 miRNAs and the results of neuroimaging studies and the age of patients with WFS (see online supplemental tables 1 and 2).
Supplemental material
Supplemental material
Based on this analysis, we identified miR-375, miR-30d-5p, miR-193a-5p, miR-145-5p and miR-30e-3p as potential positive biomarkers of neurodegeneration. Their expression was upregulated at follow-up compared with baseline. Baseline levels of miR-375 were inversely correlated with baseline MAT values (R=−0.72, p=0.044; figure 2A) and the follow-up levels of miR-30d-5p and miR-193a-5p were inversely correlated with follow-up MAT values (R=−0.78, p=0.008 and R=−0.74, p=0.037; figure 2B,C, respectively), indicating that patients with higher levels of these miRNAs had also lower MAT. Interestingly, we observed also an inverse relation between baseline levels of miR-145-5p levels and brainstem volume (R=−0.61, p=0.046; figure 2D) and between follow-up levels of miR-30e-3p and baseline MAT (R=−0.79, p=0.012; figure 2E).
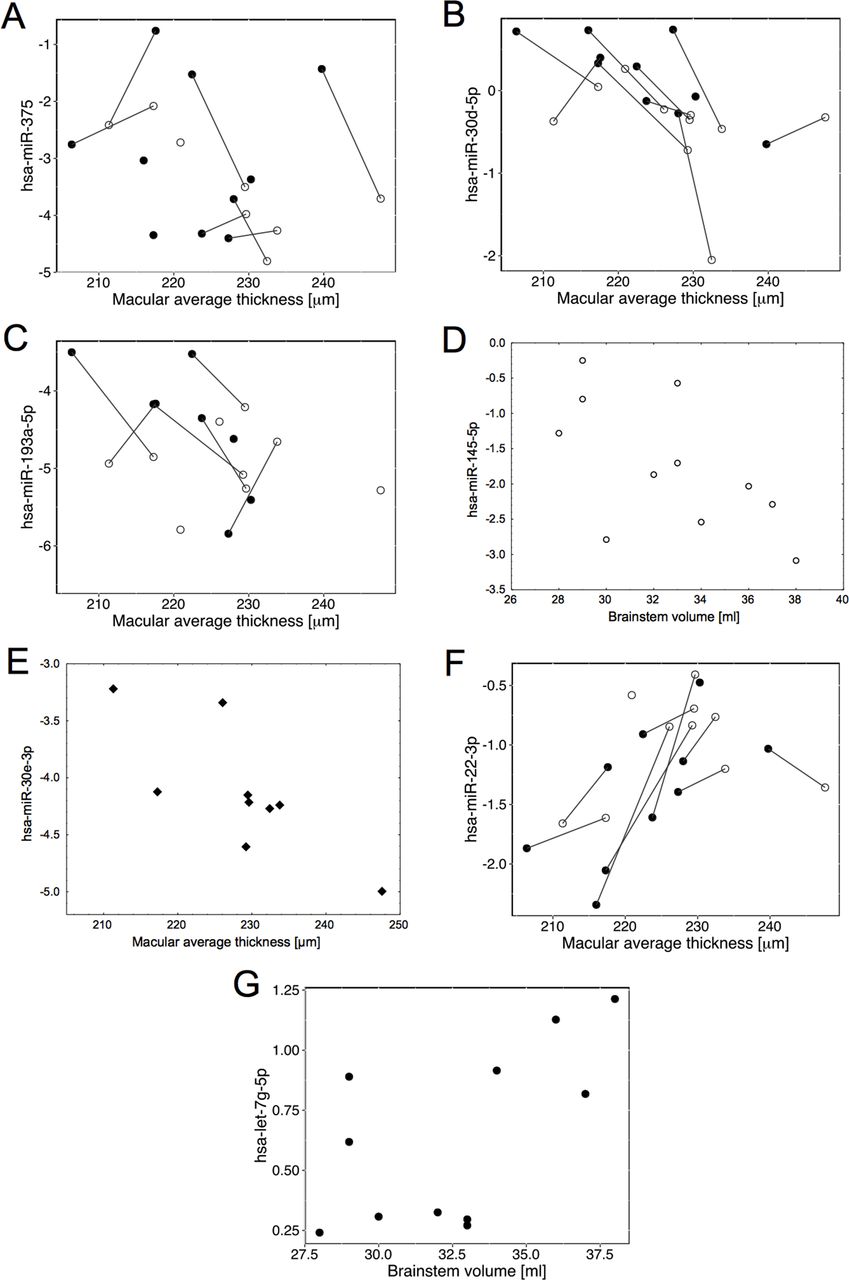
Correlations of microRNA (miRNA) levels with optical coherence tomography (OCT) or MRI parameters in patients with Wolfram syndrome (WFS): (A) miR-375 with macular average thickness (MAT), (B) miR-30d-5p with macular average thickness, (C) miR-193-5p with macular average thickness, (D) baseline miR-145-5p with brainstem volume, (E) follow-up miR-30e-3p with baseline macular average thickness, (F) miR-22-3p with macular average thickness, (G) follow-up let-7g-5p with brainstem volume. White circles represent WFS baseline measurements, black dots—WFS follow-up, rhombi—follow-up miR measurements with baseline MAT; measurements of the same patients are matched with black lines.
miR-22-3p and let-7g-5p levels were downregulated in WFS follow-up samples compared with baseline, making them potential negative biomarkers of neurodegeneration. The follow-up expression of miR-22-3p correlated significantly with follow-up MAT (R=0.65, p=0.042; figure 2F), indicating that the patients with lower MAT in follow-up had also lower miR-22-3p expression. Follow-up let-7g-5p expression was correlated with brainstem volume (R=0.61, p=0.045; figure 2G).
We then assessed whether the expression of selected miRNAs was related to the patients’ age instead of the progression of neurodegeneration. Although in patients with WFS the level of miR-375, miR-30d-5p, miR-193a-5p, miR-145-5p and miR-30e-3p increased, and level of miR-22-3p and let-7g-5p decreased along the course of the disease, no relationship of these miRNAs levels with age of patients with T1DM was evidenced (figure 3, see online supplemental tables 1 and 2). Moreover, no correlation between the level of any of the 26 miRNAs and the diabetes duration and age of patients with T1DM was found (p>0.2).

Levels of microRNAs (miRNAs) in Wolfram syndrome (WFS) and patients with type 1 diabetes mellitus (T1DM) presented in relation to age: (A) miR-375, (B) miR-30d-5p, (C) miR-193-5p, (D) miR-145-5p, (E) miR-30e-3p, (F) miR-22-3p, (G) let-7g-5p. X signs represent patients with T1DM, white circles—WFS baseline and black dots—WFS follow-up; baseline and follow-up measurements of the same patients are matched with black lines.
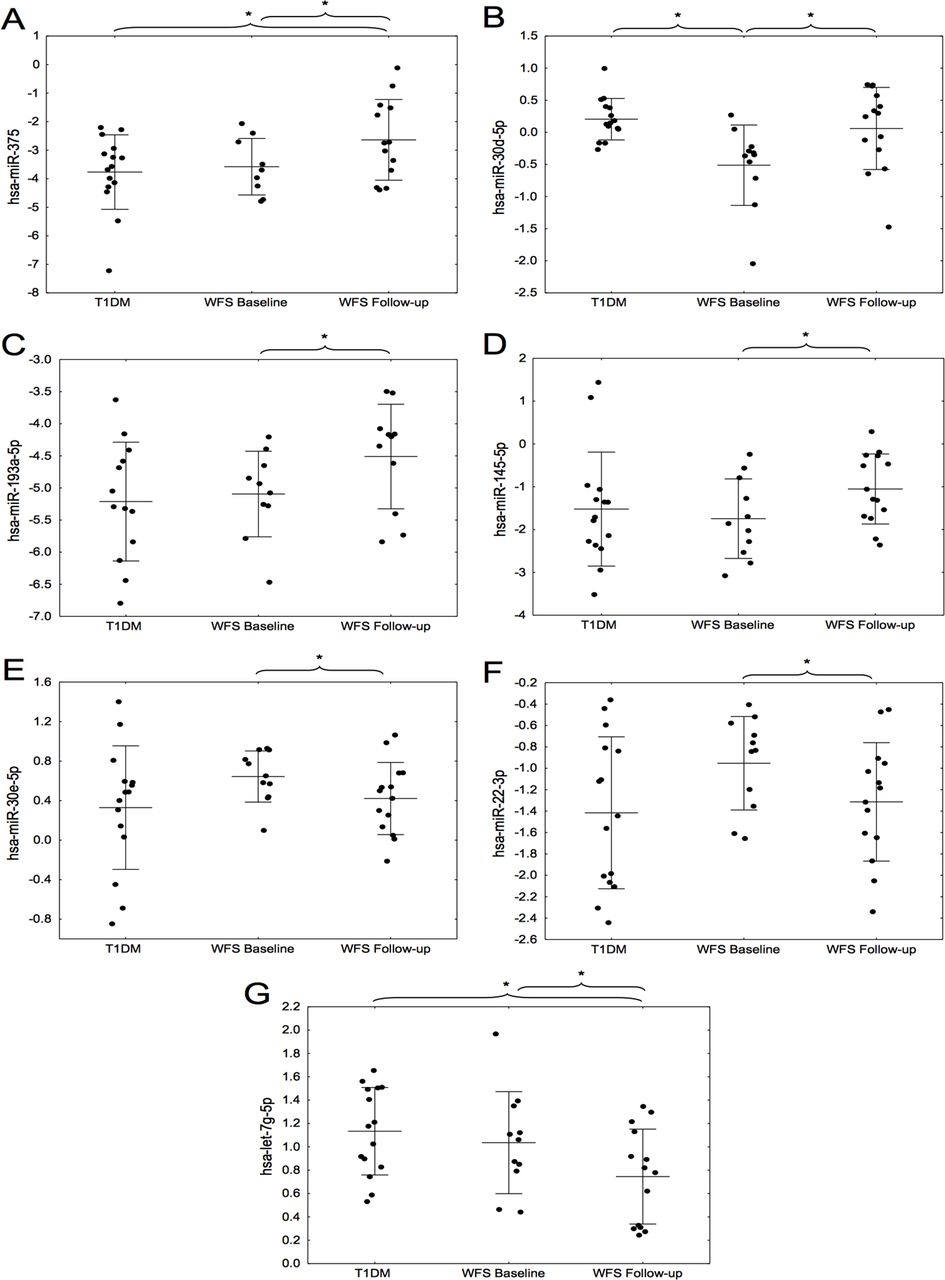
Additionally, miR-375 level appeared to be higher in WFS follow-up samples than in T1DM (p=0.037, figure 4A) and miR-30d-5p expression was lower in WFS baseline than in T1DM (p<0.001, figure 4B). No such differences could be observed for miR-193a-5p (figure 4C), miR-145-5p (figure 4D), miR-30e-3p (figure 4E) and miR-22-3p (figure 4F). Expression of let-7g-5p was lower in WFS follow-up than in T1DM (p=0.012, figure 4G).
Levels of microRNAs (miRNAs) in paired Wolfram syndrome (WFS) and type 1 diabetes mellitus (T1DM) samples: (A) miR-375, (B) miR-30d-5p, (C) miR-193-5p, (D) miR-145-5p, (E) miR-30e-3p, (F) miR-22-3p, (G) let-7g-5p. *P<0.05 in t-test for T1DM versus WFS comparisons or in paired t-test for WFS baseline versus WFS follow-up comparisons.
Discussion
This study presents the first evaluation of circulating miRNAs in sera of patients with WFS, delineating a signature that is highly divergent from one observed in patients with T1DM. In addition, we show that the miRNA expression pattern evolves over time, potentially in parallel to the degree of neurodegeneration. Our evaluation performed after an average of 2 years of follow-up allowed to select seven miRNAs: miR-375, miR-145-5p, miR-30d-5p, miR-30e-3p, miR-193a-5p, miR-22-3p and let-7g-5p, the expression of which changed in a convergent way in patients with WFS with the progression of the disease and correlated with MAT or brainstem volume—recognized markers of neurodegeneration. Five of them were upregulated and two were downregulated in sera of the patients with WFS at the follow-up evaluation.
One of the potential markers in patients with WFS showing a significant increase with neurodegeneration progress and also a significantly elevated level in comparison to patients with T1DM in our study is miR-375. It belongs to the group of highly conserved miRNAs that are expressed both in the β-cells of pancreas and the brain, where in the hippocampus it can affect the differentiation and function of dendrites.23 24 Moreover, in patients with another neurodegenerative disease—multiple sclerosis (MS)—there was also a significant correlation between the level of circulating miR-375 and the severity of brain atrophy observed in MRI study, which may be useful for monitoring the progression of this disease.25 Similarly, circulating miR-145 has been identified as one of the biomarkers of disease staging in patients with MS.26 It has also been proven on the animal model that overexpression of miR-145 leads to neuronal death and anti-miR-145-5p is typed as a potential neuroprotective therapy in several types of neurodegenerative diseases.27
Among those miRNAs that increased their expression levels over time in our study are miR-30d-5p and miR-30e-3p, belonging to the miR-30 family that plays an important role in Parkinson’s disease (PD) progression.28 Serum miR-30e-3p level was significantly elevated in patients with PD compared with healthy control.29 Moreover, some studies indicate that miR-30d may also participate in the pathophysiology of neurodevelopmental diseases, as evidenced by its elevated level in the animal model of autism spectrum disorders.30 Interestingly, the most recent research on WFS suggests, apart from the progress of neurodegeneration, the contribution of neurodevelopmental disorders to the pathological mechanism of this disease.31
Another potential WFS neurodegeneration marker—miR-193a—was also indicated by other researchers as one of the early biomarkers in PD. Its serum concentration was significantly decreased in patients with early PD compared with the control group.32 It was also recognized as an important marker differentiating patients with various degrees of severity in another neurodegenerative disease—amyotrophic lateral sclerosis.33
One of the promising markers of progression in WFS, the level of which decreased over time in our research, is miR-22-3p. The authors of another study proposed the use of low miR-22-3p level in CSF as a diagnostic marker for patients with early stage of PD.34 Moreover, in the study by Hemond et al,35 it was one of the three strongest miRNAs differentiating MRI phenotypes related to the severity of brain atrophy in patients with MS. Some literature reports on miR-22 also emphasize its role in pathogenesis of Huntington’s disease (HD). Interestingly, these data indicate that miR-22 overexpression has shown neuroprotective effects, including inhibition of apoptosis in HD-like conditions, which may indicate a new direction in the search for therapy in various neurodegenerative diseases.36
In our study, the let-7g-5p level was significantly reduced in patients with WFS as compared with the patients with T1DM. Moreover, the follow-up level of let-7g-5p was positively correlated with brainstem volume. The miRlet-7 are recognized markers in many other neurodegenerative diseases such as Alzheimer’s disease, PD and MS, acting by reducing the number of repair mechanisms including the defense against ER stress.37 38 Furthermore, the let-7g has shown its usefulness as a marker of residual β-cells function in T1DM in children.39 40
Increased ER stress in WFS, which includes a number of transcription factors and leads to diabetes and brain atrophy, results in a specific disturbance of miRNA expression that can be observed in the changes of their serum levels in patients with WFS. Therefore, the scenario of dynamic evaluation of miRNA expression in relation to clinical neurodegenerative events occurring in patients with WFS seems to be very useful in searching for prognostic markers in this syndrome. Functionally, miRNAs are a biological mechanism designed to suppress the expression of unwanted proteins and the serum expression of such miRNAs in WFS may be a reflection of them actively participating in mitigating ER stress or reflect the tissue loss due to the progression of the disease. Thus, we hypothesize that miRNAs may be a specific link between progression of brain degeneration, retinal thinning and insulin-dependent diabetes mellitus.
There are some limitations to our study. First, the severely limited sample size from patients with WFS were examined due the extremely low frequency of WFS in the European population (~1/400 000). In addition, no further verification of the results obtained in the validation group of patients was carried out. We did not have the resources for a parallel longitudinal study of T1DM and neurological evaluations of that group. However, we know from previous studies that in patients with T1DM no correlation between OCT/MRI parameters and age of patients was noticed and this was the reason for not evaluating the correlation with miRNA in the current study.21 Thus, the samples were analyzed with follow-up observation. Because of the limitations of the study, our observations are at the moment of preliminary nature. Nevertheless, given the uniqueness of the WFS group and the urgent clinical need for biomarkers of neurodegeneration progression that would be cheap, accessible and available for repeated testing makes the study a valuable platform for further testing of miRNAs in longitudinal neurodegeneration studies as well as mechanistic examinations of the miRNAs as potential therapeutic targets or drugs to mitigate ER stress.
In conclusion, our findings show for the first time that several selected miRNAs can be used in patients with WFS in the future as potential markers of disease progression.
References
Supplementary materials
Supplementary Data
This web only file has been produced by the BMJ Publishing Group from an electronic file supplied by the author(s) and has not been edited for content.
Footnotes
MB and WM contributed equally.
Contributors AZ collected clinical data and wrote the draft of the manuscript. MS and ZN performed statistical analyses. AW performed and analyzed ophthalmological studies. DB performed and analyzed MRI studies. WF performed statistical analyses and contributed to writing the manuscript. MB performed genetic analyses. WM designed the study and collected the clinical data.
Funding This study was supported by National Science Centre grants no 2014/15/B/NZ5/01579, 2013/09/B/NZ5/00779 and by the Polish Ministry of Science and Higher Education No 2328/EURO-WABB/11/2012/2.
Disclaimer AZ and WF are the guarantors of this work and, as such, had full access to all the data in the study and take responsibility for the integrity of the data and the accuracy of the data analysis.
Competing interests None declared.
Patient consent for publication Not required.
Ethics approval The study protocol was approved by the University Bioethics Committee at the Medical University in Lodz, Poland (RNN/73/14/KE).
Provenance and peer review Not commissioned; externally peer reviewed.
Data availability statement Data are available on reasonable request.