Article Text

Abstract
Introduction Therapeutic efficiency of glucagon-like peptide-1 (GLP-1) analog is about 50%–70% in type 2 diabetes mellitus (T2DM). Discovery of potential genetic biomarkers for prediction of treatment efficiency of GLP-1 analog before therapy is still necessary. We assess whether DNA methylation was associated with glycemic response to GLP-1 analog therapy in patients with poorly controlled T2DM.
Research design and methods Genomic DNA was extracted from the peripheral blood of training (n=10) and validation (n=128) groups of patients with T2DM receiving GLP-1 analogs. DNA methylome was analyzed using Infinium Human Methylation EPIC Bead Chip in the training group. The candidate genes were examined using a pyrosequencing platform in the validation group. The association between DNA methylation status and glycemic response to GLP-1 was analyzed in these patients.
Results The most differential methylation region between those with a good (responsive) and poor (unresponsive) glycemic response to GLP-1 analog therapy was located on chromosome 5q31.1 (135415693 to 135416613), the promoter of VTRNA2-1 in the training group. The methylation status of the VTRNA2-1 promoter was examined in the validation group via pyrosequencing reaction, and the hypomethylation of VTRNA2-1 (<40% methylation) was significantly associated with poor glycemic response to GLP-1 treatment (OR 2.757, 95% CI 1.240 to 6.130, p=0.011). Since the VTRNA2-1 promoter region was previously reported maternal imprinting extended to the adjacent centromeric CCCTC-binding factor site that contained an A/C polymorphism (rs2346018), which was associated with methylation density of VTRNA2-1, this A/C polymorphism was also integrated to analyze association with glycemic response to GLP-1 analog therapy. In patients with the A allele of rs2346018 and hypomethylation (<40%) on the VTRNA2-1 promoter, the OR increased to 4.048 (95% CI 1.438 to 11.389, p=0.007).
Conclusions The glycemic response to GLP-1 analog treatment is associated with the methylation status of the VTRNA2-1 promoter and polymorphism of rs2346018.
- diabetes mellitus
- type 2
- incretins
- genetic markers
- biomarkers
This is an open access article distributed in accordance with the Creative Commons Attribution Non Commercial (CC BY-NC 4.0) license, which permits others to distribute, remix, adapt, build upon this work non-commercially, and license their derivative works on different terms, provided the original work is properly cited, appropriate credit is given, any changes made indicated, and the use is non-commercial. See: http://creativecommons.org/licenses/by-nc/4.0/.
Statistics from Altmetric.com
Significance of this study
What is already known about this subject?
The development of glucagon-like peptide-1 (GLP-1)-based therapies is promising for the treatment of diabetes.
The clinical responsiveness to GLP-1 analogs varies (about 50%–70% responsive rate) among patients with type 2 diabetes mellitus (T2DM).
What are the new findings?
We conducted genome-wide methylation analysis to elucidate the potential biomarkers associated with glycemic response to GLP-1 analog therapy in T2DM.
The hypomethylation of VTRNA2-1 promoter was significantly associated with unresponsiveness to GLP-1 analog treatment.
In patients with the A allele of rs2346018 and hypomethylation on the VTRNA2-1 promoter, the OR increased to 4.408 (95% CI 1.438 to 11.389).
How might these results change the focus of research or clinical practice?
The glycemic response associated with the methylation status of the VTRNA2-1 promoter and polymorphism of rs2346018 can elucidate the different effects of GLP-1 analog treatment.
The variation in methylation status of VTRNA2-1 promoter and rs2346018 can help screen the patients with potential T2DM of unresponsiveness to GLP-1 analog.
Introduction
Glucagon-like peptide-1 (GLP-1) belongs to incretin, which releases in response to meal intake.1 It is secreted by L cells of the intestinal through the post-translational processing of proglucagon.2 GLP-1 increases insulin secretion and inhibits glucagon release in a glucose-dependent model. The GLP-1-based therapy is therefore recommended in the treatment of type 2 diabetes (T2DM).3 GLP-1-based therapies affect glucose control through slowing gastric emptying, inhibition of postprandial glucagon, reduction of appetite, and enhancement of glucose-dependent insulin secretion without the risk of hypoglycemia.4 Currently, GLP-1 analogs are mostly used for patients with poorly controlled T2DM.5 Unfortunately, the general control rate is not so satisfying, which may be partially due to the complex etiology of T2DM.6 The clinical responsiveness to GLP-1 analogs varies (about 50%–70% responsive rate) among patients with T2DM,7 which suggests that various beta cell functions and genetic or epigenetic factors may be crucial in the treatment responsiveness of these patients.3 Because of the high cost of these new drugs, it is important to clarify this critical issue in patients with T2DM.
The glucagon-like peptide 1 receptor (GLP1R) is a member of the class B1 family of G protein-coupled receptors, and polar interactions via hydrogen bonds or salt bridges between GLP1R and agonists have been predicted.8 The GLP1R specifically binds GLP-1 and related peptides with a lower affinity.9 Some GLP1R gene polymorphisms have been found to be related to the strength of these interactions.8 The possibility to increase the benefits and reduce side effects in patients with suboptimal drug responses could be accomplished by pharmacogenetics.10 A pilot study reported that variances in the insulinotropic response to exogenous GLP-1 in healthy volunteers depend on the presence or absence of two common single nucleotide polymorphisms (SNPs) of the GLP1R gene.11 In our previous study, quantitative trait loci analysis of GLP1R gene variations with clinical response to GLP-1 analog therapy showed a non-significant association in patients with poorly controlled T2DM.12 In addition to GLP1R, the variants in rs10010131 of wolfram in ER transmembrane glycoprotein (WFS1) and rs7903146 of transcription factor 7 like 2 (TCF7L2) genes have been demonstrated to affect the response to exogenous GLP-1, while variants in potassium voltage-gated channel subfamily Q member 1 (KCNQ1) (rs2237895, rs151290, and rs2237892) have been reported to alter endogenous GLP-1 secretion.13–15 However, another validation study showed no effect of variants in WFS1, TCF7L2, and KCNQ1 on GLP-1 levels after GLP-1-induced insulin secretion or a standard 75 g oral glucose tolerance test in healthy participants without T2DM.16
Aberrant DNA methylation may cause several pathologies and contribute to obesity and T2DM.17 Several epigenetic biomarkers of insulin resistance have been identified in genomic DNA derived from human whole blood.18 However, the relationship between epigenetics and responsiveness to GLP-1 analog treatment has yet to be explored. Recently, a differentially methylated region (DMR), including a 101 bp non-coding RNA gene, Vault RNA 2-1 (VTRNA2-1), and its maternally imprinting methylation have been directly linked to body mass index (BMI) and insulin sensitivity in early childhood.19 20 Furthermore, the maternal imprinting of VTRNA2-1 region extended to the adjacent centromeric CCCTC-binding factor (CTCF) site that contained an A/C polymorphism (rs2346018).19 The DNA methylation density of VTRNA2-1 promoter was associated with A/C polymorphism in the centromeric CTCF binding site (rs2346018). The presence of the A allele can increase the DNA methylation percentage in VTRNA2-1 and reduce CTCF transcription factor binding.19 Therefore, the methylation status of VTRNA2-1 was proposed to be regulated by tunable polymorphic imprinting.19
Taken together, these findings highlight the importance of epigenetics in disease development and control. Therefore, the aim of this study was to assess whether DNA methylation is associated with glycemic response to GLP-1 analog therapy in patients with poorly controlled T2DM.
Research design and methods
Patients
One hundred and thirty-eight patients with T2DM (training and validation group) who were receiving GLP-1 analog therapy were enrolled. The inclusion criteria were: (a) age >20 years; (b) diabetes mellitus diagnosed >2 years; and (c) hemoglobin A1c (HbA1c) level of 8%–12%. The exclusion criteria were: (a) recent history of drug or alcohol abuse; (b) sensitivity to analogous products; (c) serious cardiovascular disorders; (d) participation in another clinical investigation study; (e) ongoing influenza, autoimmune disease, or other metabolic disorders; and (f) pregnant or lactating women. This study was approved by the Institutional Review Board of Chang Gung Memorial Hospital. Informed consent was obtained from each subject (IRB No. 104-9629B).
Study protocol
In the training stage, 10 participants with a GLP-1 response according to the treatment protocol in our previous report.12 In brief, the patients with poorly controlled T2DM received continuous subcutaneous insulin infusion for normalization of blood glucose and then a combination therapy with injections of the GLP-1 analog. The participants received DNA methylome analysis by Infinium HumanMethylation450 and MethylationEPIC BeadChip platforms. The demographic data of the 10 patients are shown in online supplemental table S1.
Supplemental material
In the validation stage, patients (n=128) receiving GLP-1 analogs were enrolled from our outpatient department. The patients received GLP-1 analogs combined with other antidiabetic drugs as per the standard recommendations. Changes in A1C from baseline to 3 months were assessed (online supplemental table S2). Non-responsiveness to a GLP-1 analog was defined as a change in A1C of <0.5%.21
DNA extraction
Genomic DNA was extracted from the leukocytes of peripheral blood from the 128 patients using a Genomic DNA Extraction Kit according to the manufacturer’s recommendations (RBC Bioscience, Taiwan) before and after GLP-1 analog therapy.
Genotyping of SNP rs2346018 by direct sequencing
PCR was carried out to amplify the region of rs2346018 using the CTCF-forward and CTCF-reverse primers (online supplemental table S3). The PCR products were confirmed by electrophoresis on 1.5% agarose gels and directly sequenced using an automated sequencer ABI 377 (Applied Biosystems, Foster City, California, USA) to determine the polymorphism.
Whole-genome methylation analysis
Bisulfite modification of DNA samples
One microgram of genomic DNA was subjected to bisulfite modification using an EZ DNA Methylation kit (Zymo Research, Orange, California, USA) according to the manufacturer’s instructions.
DNA methylation microarray analysis
Bisulfite-converted DNA samples from step 1 were assessed using Infinium Human Methylation EPIC Bead Chip (Illumina, California, USA) according to the manufacturer’s instructions. Illumina Genome Studio software V.2011.1 was used to extract the raw signal intensities of each probe (without background correction or normalization). The resulting raw data were normalized (control normalization) and background corrected by the manufacturer software to generate β-values for representing methylation status of each CpG site. The data preprocessing of MethylationEPIC BeadChip was performed by R package “ChAMP” V.2.18.2, including filter and normalization.22 It filtered out (1) probes with detection p value (>0.01), (2) probes with <3 beads in at least 5% of samples per probe, (3) all non-CpG probes, (4) all SNP-related probes,23 24 (5) all multihit probes,25 (6) cross-reactive probes cohybridizing to the sex chromosomes.23 MethylationEPIC BeadChip normalization (sample normalization, using the parameter “BMIQ”), calling differentially methylated points and calling DMRs (using the parameter “Bumphunter”) were performed.
Data analysis
The volcano plots, statistical analysis (t-test), and the estimate positive false discovery rate for multiple hypothesis testing were performed with MATLAB (V.2015a). The selection of the most differentially expressed methylation levels was based on t-tests (p<0.05), and the change of beta value >0.5 was used to select the probes.
Bisulfite PCR, cloning, and DNA sequencing
Bisulfite-treated genomic DNA was amplified using specific primers (BSP primers; online supplemental table S3) by PCR (Titanium Taq DNA Polymerase, Takara Bio, USA). Amplified PCR products were purified and cloned into pCRII-TOPO vector (Invitrogen, Carlsbad, California, USA) to select the clones. DNA sequencing was performed on at least 10 individual clones using a 3770Automatic Sequencer (Applied Biosystems, Foster City, California, USA).
Bisulfite pyrosequencing reaction
Quantitative analysis of CpG site-specific DNA methylation at VTRNA2-1 was performed using bisulfite pyrosequencing (QiagenPyroMark Q96 and Q24). The pyrosequencing assay was validated using standard composed of known 100% methylated, 0% unmethylated, and unmodified human genomic DNA (EpiTect Control DNA and Control DNA Set, Qiagen). One microgram of genomic DNA was modified using an EpiTect Fast Bisulfite Conversion Kit (Qiagen) according to manufacturer’s instructions. About 10–20 ng of bisulfite DNA was used for the PCR reaction with pyrosequencing. The VTRNA2-1 forward and reverse primers were designed using PyroMark Assay design software (Qiagen) and were listed in online supplemental table S3. PCR was performed on a PCR Work station (AirClean Systems) using filtered (0.22 um) nuclease free water (Invitrogen). Pipette should be calibrated and cleaned before manipulating PCR reaction for pyrosequencing. Each biotinylated PCR product (20 µL) was mixed with 1 µL of Streptavidin Sepharose (GE Healthcare) and 40 µL of binding buffer (Qiagen) and then shaken for 10 min for immobilization. The immobilized biotinylated PCR products were purified to single-stranded DNA using a vacuum workstation (Qiagen) according to manufacturer’s recommendations. The products were then mixed with a sequencing primer (online supplemental table S3) at a concentration of 0.3 µM in annealing buffer (Qiagen), heated to 80°C for 5 min, and then allowed to cool to room temperature for annealing of the sequencing primer. The plates, enzymes, substrates, and nucleotides were set on PyroMark Q96 or Q24 (Qiagen) for pyrosequencing reaction.
Quantitative reverse transcriptase polymerase chain reaction (qRT-PCR)
RNA was extracted from the patients’ peripheral blood samples using Tempus Blood RNA Tubes (Thermo Fisher Scientific, USA) and a QIAamp RNA Blood Mini Kit (Qiagen, Hilden, Germany). The cDNA was synthesized using 5 µg of total RNA and reverse transcriptase (Promega, Madison, Wisconsin, USA) with a random hexamer, followed by quantitative PCR using SYBR Green Master Mix (Applied Biosystems, USA) with the VTRNA2-1 and 5S RNA primers as previously reported.26 The 5S RNA was chosen as the reference gene for internal standardization. The delta Ct was calculated as the Ct value of VTRNA2-1 – Ct value of 5S RNA.
TGF-β1 ELISA assay
Blood samples were obtained and the serum was collected immediately after centrifugation. Serum samples were stored at −20°C until analysis. Serum TGF-β1 was measured using a TGF-β1 ELISA kit (R&D Systems, Minneapolis, Minnesota, USA).
Statistical analysis
Differences between groups of continuous variables were tested using Student’s t-test. Differences in proportions were assessed using a χ² test or Fisher’s exact test, as appropriate. Results were expressed as mean±SD or percentage. The level of statistical significance was set at a p<0.05. Receiver operating characteristic (ROC) curve assay and other statistical analyses were conducted using SAS (V.9.3, SAS Institute, Cary, North Carolina, USA).
Results
Whole-genome methylation analysis in the training group
The global methylation profiles of genomic DNA from 10 subjects before and after GLP-1 analog treatment were analyzed. There were no significant differences in mean age, mean BMI, duration of diabetes mellitus, baseline HbA1c levels, comorbidity, and concurrent medication proportions between the GLP-1-responsive and non-responsive groups (online supplemental table S1). Before data analysis, we checked differences in the methylation status of sex chromosome-associated genes (online supplemental figure S1). The distribution could clearly be distinguished between the male and female subjects across the X-chromosome-specific and Y-chromosome-specific gene methylation levels.
We first analyzed differential methylation between the before and after treatment groups with regard to methylation status. The results showed no significant changes in methylation before and after GLP-1 analog treatment in both responsive and non-responsive groups in volcano plot analyses (online supplemental figure S2).
The methylation status of VTRNA2-1 was most significantly different between the GLP-1 responsive and non-responsive groups (p<1×10⁻¹⁰) (figure 1A, online supplemental table S4). If the region was considered as a whole, with two just two states—hypermethylated or hypomethylated—the p value is still significant (0.033 by Fisher’s exact test). In addition to VTRNA2-1, some other DMRs showed differential methylation status between the non-responsive and responsive groups with low significance (online supplemental table S4).
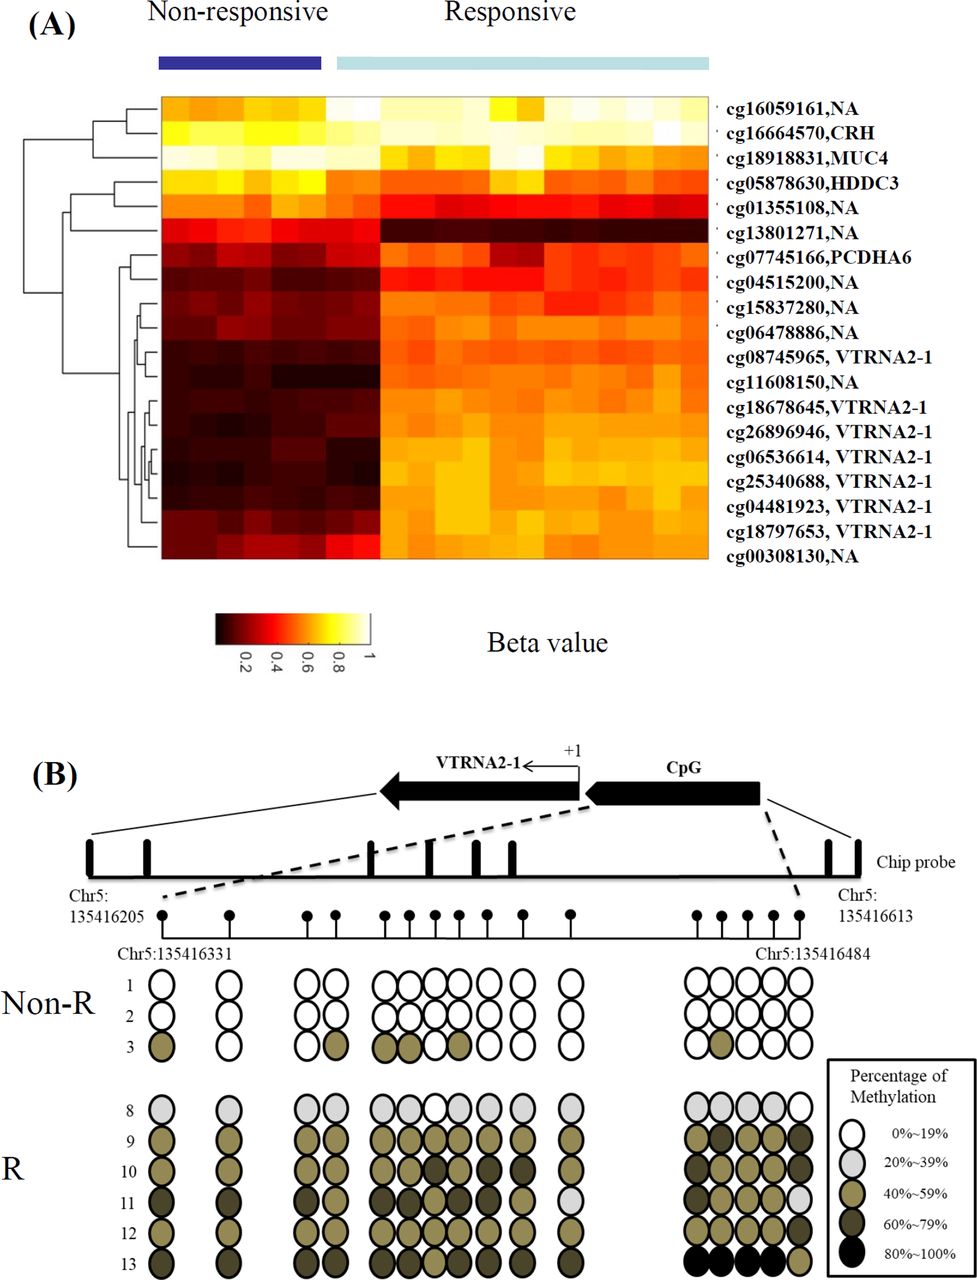
Differential DNA methylation levels could distinguish the responsive and non-responsive patients with type 2 DM who treated with GLP-1 analogs. (A) Unsupervised hierarchical clustering of 36 methylation probes. Profiles were visualized using Cluster 3.0 and Tree View programs using average-linkage clustering algorithms. Heat map and gene lists of all participants and the most significant DMRs were shown. Selection of the most differentially expressed DMPs, based on t-tests. The duplicated gene names are represented as the different probe positions in the same gene. The bisulfite genome DNA from patient 1 to 8 and patient 9 to 10 were analyzed by the Infinium MethylationEPIC BeadChip and HumanMethylation450 platforms; respectively. (B) Bisulfite sequencing analysis of each CpG dinucleotide in the VTRNA2-1 promoter region. Each row represents the percentage of methylation on each CpG dinucleotide. +1 indicates the transcription start site. The physical position was based on GRCh37/hg19 assembly. DMP, differentially methylated point; DMR, differentially methylated region.
To confirm the methylation of the VTRNA2-1 promoter, the DNA methylation status in each of the 16 CpGs around the VTRNA2-1 promoter region (from −7 to −202) were analyzed using bisulfite sequencing. Almost 16 CpGs were unmethylated in the non-responsive group, whereas most of 16 CpGs were hypermethylated in the responsive group (figure 1B). Taken together, methylation of the VTRNA2-1 promoter was associated with a glycemic response to GLP-1 analog treatment in the training group, and the methylation status of VTRNA2-1 was confirmed via bisulfite sequencing methods.
DNA methylation analysis by pyrosequencing of VTRNA2-1 promoter region in the validation group
A total of 128 participants were enrolled in pyrosequencing analysis in the validation group (online supplemental table S2). Of the 128 participants, 52% were treated with liraglutide once daily, 32% with exenatide twice daily, and 16% with dulaglutide once weekly. There were no significant differences in age, sex, BMI, diabetes mellitus duration, baseline HbA1c levels, comorbidity, and concurrent medication proportions between the responsive and non-responsive groups. The HbA1c level after GLP-1 treatment was significantly different between the responsive and non-responsive groups (p<0.0001) (online supplemental table S2).
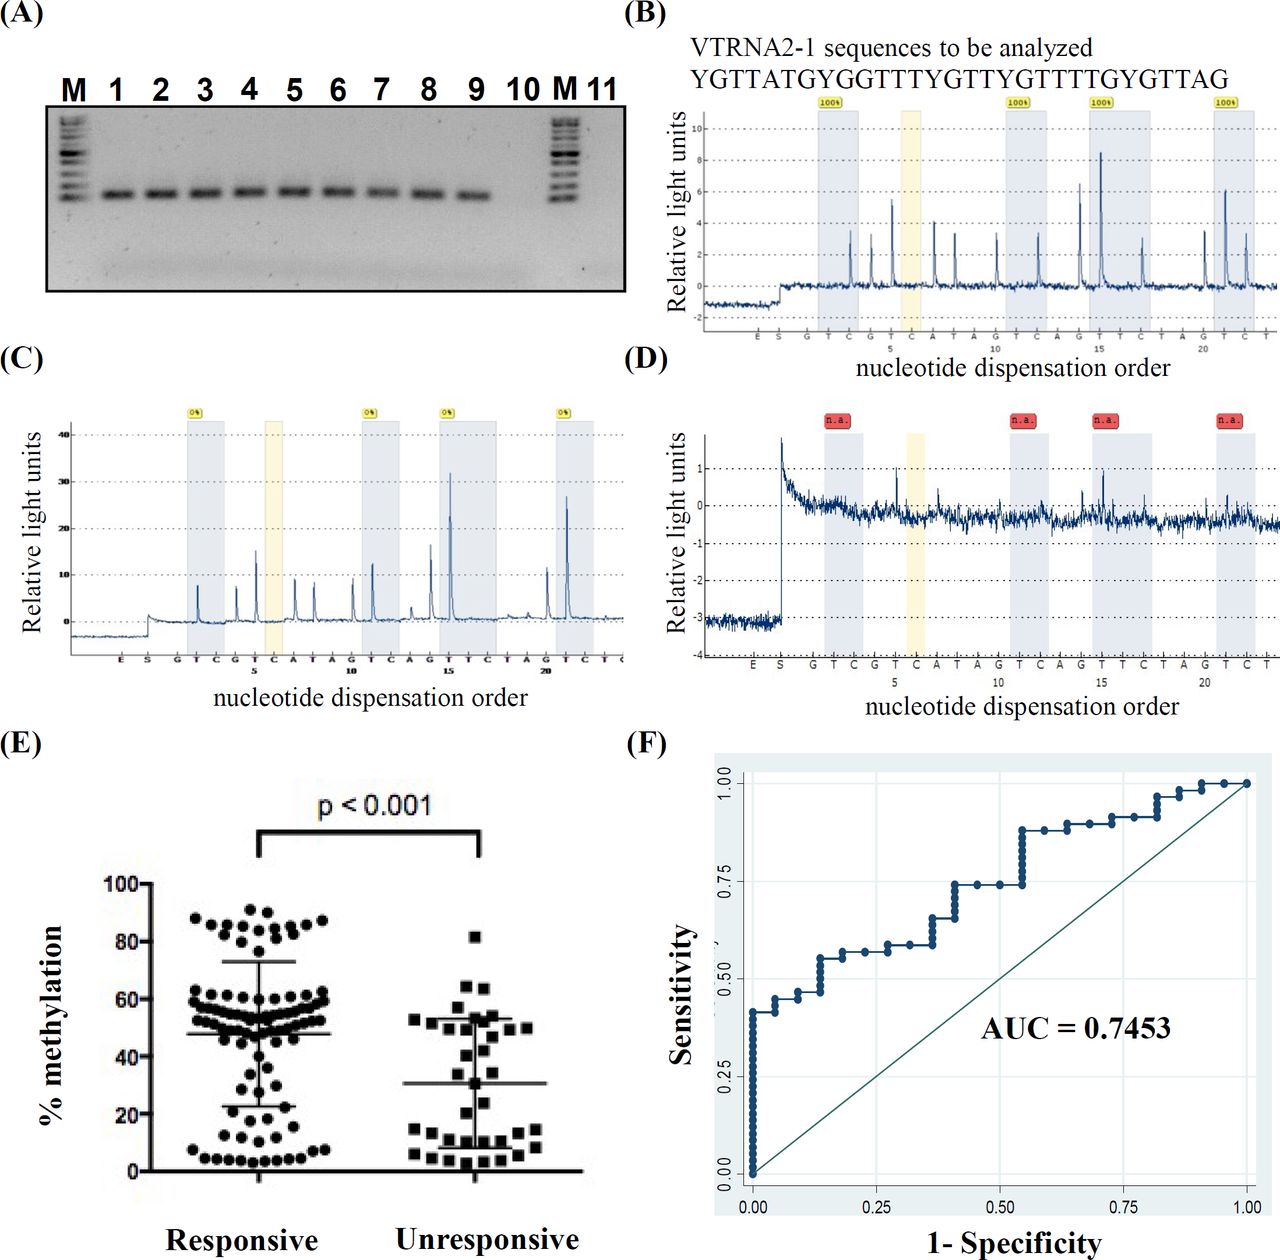
The PCR and sequencing primers were designed to amplify VTRNA2-1 promoter region on chr5:135 416 381(cg06536614), chr5:135416388, chr5:135 416 394(cg26328633), and chr5:135 416 398(cg25340688) (online supplemental table S3) to detect the methylation status of the VTRNA2-1 promoter in genomic DNA from the patients. The VTRNA2-1 promoter was amplified using our primers with methylated/unmethylated control genomic DNA (EpiTech control DNA and Control DNA set, Qiagen) or bisulfite control genomic DNA and modified genomic DNA from the patients, but could not be amplified in unmodified genomic DNA (figure 2A). These PCR products were further analyzed by pyrosequencing. Those derived from control DNA, methylated (100%) and unmethylated control (0%), showed the corresponding methylation status. In addition, there was still no obvious signal from the PCR reaction derived from unmodified genomic DNA (figure 2B–D), which showed the specificity of the designed primers.

The correlation between GLP-1 analog response and percentage methylation of VTRNA2-1 promoter. (A) Bisulfite genomic DNA derived from the patients (lanes 1–7) amplified via designed pyrosequencing PCR primers (online supplemental table S3), the methylation control (100% methylation, lane 8), unmethylation control (0% methylation, lane 9), and unmodified genome DNA (lane 10) were also amplified using the same primer set. The negative control of this study was ddH2O supplemented with all PCR reagent and primers (lane 11). M: 100 bp marker. The PCR products were then subjected to pyrosequencing reaction. (B)–(D). Pyrogram of PCR product sequencing results uses the Q96 or Q24 platform (Qiagen). The percentage of methylation in each CpG site is shown as a cyan blue color box. From left to right, the methylation percentage of cg06536614, chr5: 135416388, cg26328633, cg25340688, in each sample. The orange color indicates the non-specific control in pyrosequencing reactions, which should be no signal. The pyrosequencing results for PCR derived from 100% methylation, 0% methylation, and unmodified genomic DNA are shown in (B), (C), and (D), respectively. (E) The correlation between the mean methylation percentages of four sites: cg06536614, chr5: 135416388, cg26328633, cg25340688 in the promoter region of VTRNA2-1 (Y axis: average of four site methylation %) and the drug response to GLP-1 analog (non-responsive, responsive; X axis), *p<0.05. (F). The area under ROC curve (AUC of the prediction model of methylation levels in the VTRNA2-1 promoter region (average methylation of cg06536614, chr5: 135416388, cg26328633, cg25340688) adjusted by age, sex, and BMI. The arrow indicates the optimal cut-off point of 1.542 according to Youden’s method. AUC, area under receiver operating characteristic curve; ROC, receiver operating characteristic.
The mean methylation percentages over the promoter region of VTRNA2-1 between the responsive and non-responsive groups by pyrosequencing were shown in figure 2E. The mean methylation levels were higher in the responsive group than in the non-responsive group (47.67±25.42 vs 30.66%±22.44%, p<0.001) (figure 2E). We used mean methylation, dichotomized at 40% methylation, to define hypermethylation (≥40%) and hypomethylation (<40%) as in a previous report.27 The OR for responsiveness was 2.757 (95% CI 1.240 to 6.130, p=0.011) (table 1), indicating that the patients with hypomethylation (<40%) tended to have a poor glycemic response after receiving GLP-1 analog therapy.
The OR of GLP-1 analog response and the methylation status of VTRNA2-1 among the patients with type 2 diabetes mellitus in the different genotypes of rs2346018
The VTRNA2-1 promoter region was previously recognized as maternal imprinting. It was extended to the adjacent centromeric CTCF site that contained an A/C polymorphism (rs2346018), which was associated with methylation density of VTRNA2-1 promoter. This A/C polymorphism was therefore integrated to analyze the association with the glycemic response to GLP-1 analog therapy. The distribution of rs2346018 fit the Hardy-Weinberg equilibrium (p=0.529). But the direct association between rs2346018 and methylation levels of VTRNA 2-1 promoter region was not significant (χ²=3.078 and p=0.215) in our patients. The distribution of rs2346018 also fit the Hardy-Weinberg equilibrium by the groups of non-responsiveness and responsiveness to GLP-1analog treatment (p=0.940 and 0.265, respectively).
When the effect of the methylation level of the VTRNA2-1 promoter region on GLP-1 analog response was examined using a recessive model (ie, major allele C vs individuals with one or more copies of the minor allele A) of rs2346018, the heterozygotes or homozygotes for the minor allele A exhibited a more predictable GLP-1 analog response according to the methylation level of the VTRNA2-1 promoter region compared with homozygotes for the major allele C. Accordingly, the OR increased to 4.048 (95% CI 1.438 to 11.389, p=0.007) in the patients with the A allele (table 1). On the other hand, the dominant model (ie, individuals with one or two copies of major allele C vs the minor allele A) or recessive model of rs2346018 only showed the trend but no significance (p=0.095 and 0.075 respectively) in predicting GLP-1 analog response. Combining methylation status with genotype of VTRNA2-1 has the benefit in predicting GLP-1 response. In conclusion, the patients with hypomethylation (<40%) on the VTRNA2-1 promoter and A allele of rs2346018 tended to be non-responsive to GLP-1 analog treatment.
After adjusting for age, gender, and BMI in multiple logistic regression models, the OR of responsiveness to GLP-1 analog treatment for patients with hypermethylation (≧40% in VTRNA2-1 promoter region) increased to 5.264 (95% CI 1.743 to 15.899, p=0.003) (table 2).
ORs of the responsiveness to GLP-1 analog therapy by clinical characteristics and features of the subjects in multiple logistic regression models
The predictive score of methylation level in theVTRNA2-1 promoter region for responsiveness to GLP-1 analog treatment
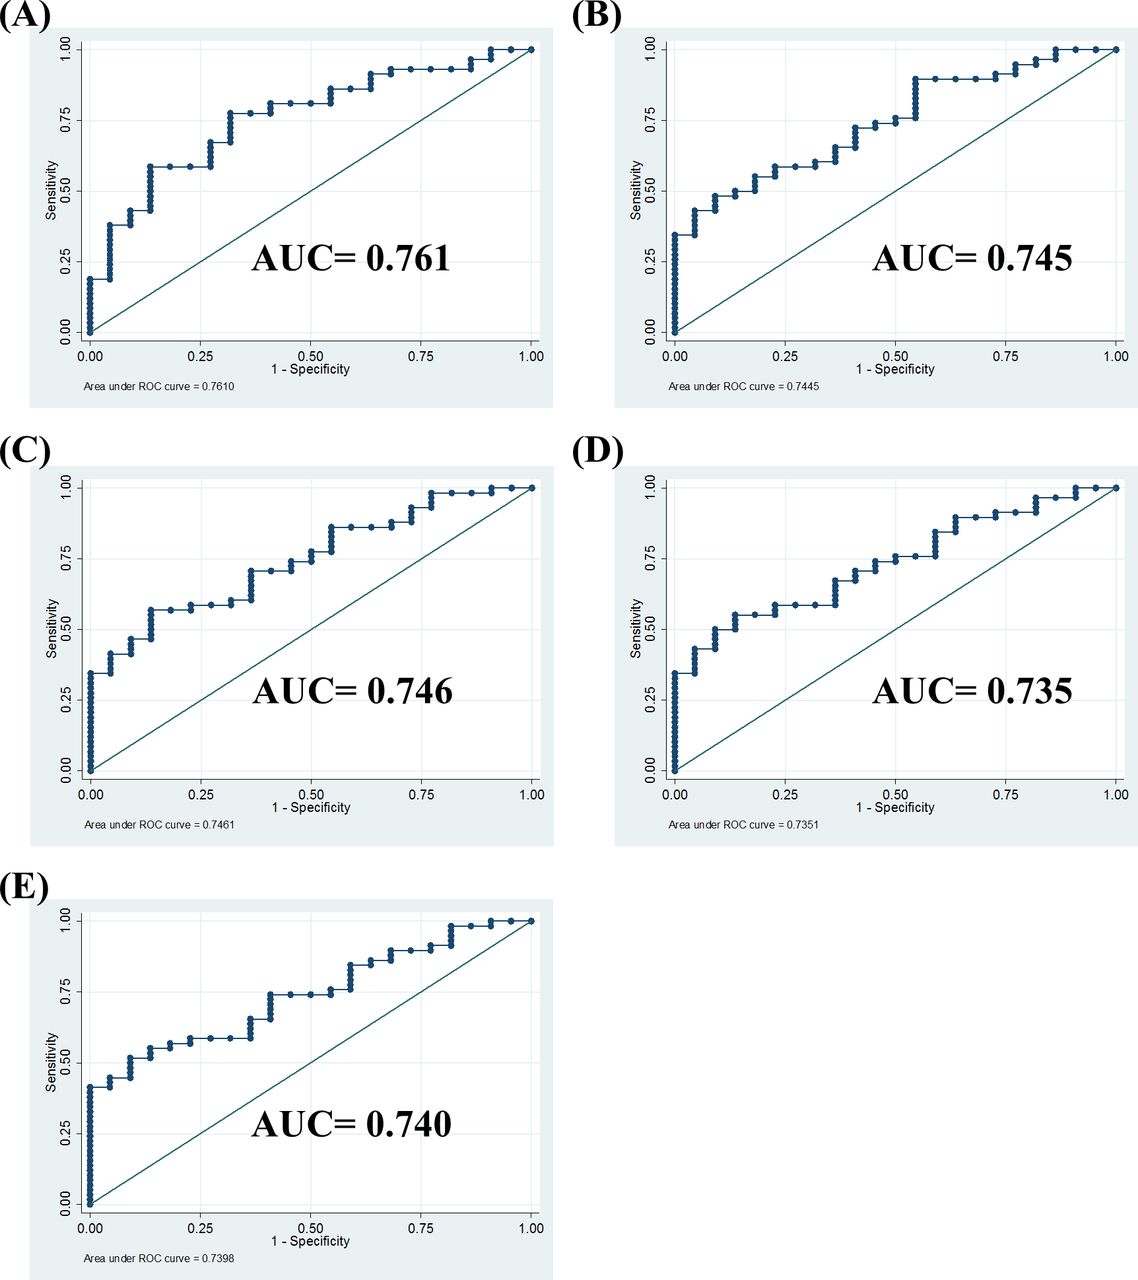
Higher methylation levels in the VTRNA2-1 promoter region were associated with a greater chance of being responsive to GLP-1 analog treatment in the patients with T2DM after adjusting for age, gender, and BMI in multiple regression models (table 2). Based on these factors, we further assessed the performance of the methylation status of VTRNA2-1 as a predictor for GLP-1 analog therapy using the area under receiver operating characteristic (ROC) curve (AUC). The formula for the predictive score was calculated as: [0.022×age (years) – 0.042×BMI – 0.608×gender (male=1, female=0)+1.661×methylation level (hypermethylation=1, hypomethylation=0)+1.095]. As shown in figure 2F, the methylation status of the VTRNA2-1 promoter had good performance for identifying GLP-1 responsiveness (AUC, 0.745 with 95% CI 0.628 to 0.863). Using an optimal cut-off value of 1.542 by Youden’s method,28 the sensitivity and specificity were 53% and 86%, respectively. Other ROC curves of prediction models through the methylation status of each CpG site in the VTRNA2-1 promoter region were also adjusted by age, sex, BMI or enrolled polymorphism of rs2346018, and the results showed a similar predictive ability (figure 3). In conclusion, the responsiveness to GLP-1 analog treatment in the patients with poorly controlled T2DM could potentially be predicted using the logistic model with the methylation status of VTRNA2-1 before treatment.

The AUC prediction models of different CpG sites methylation status in the VTRNA2-1 promoter region adjusted by age, sex, and BMI. (A) Average methylation percentage of 4 CpG sites in VTRNA2-1 promoter further adjusted for rs2346018 (1: CC; 2: CA or AA). (B) Methylation of cg 06536614 in the VTRNA2-1 promoter. (C) Methylation of chr5:135 416 388 in the VTRNA2-1 promoter. (D) Methylation of cg26328633 in the VTRNA2-1 promoter. (E) Methylation of cg25340688 in VTRNA2-1 promoter. All adjusted for age, gender, and BMI. The AUC value for each parameter is as indicated in figures. AUC, area under receiver operating characteristic curve; BMI, body mass index.
Discussion
In the genome-wide methylation analysis, a hypomethylation state (<40%) over the VTRNA2-1 promoter region was closely linked to GLP-1 analog non-responsiveness. VTRNA2-1 is an RNA polymerase III-transcribed, noncoding RNA that is 101 bp in size, and it is also referred to as nc886.19 The VTRNA2-1 has been shown to be modulated by its promoter methylation and could be induced by TGF-β1.29 It can bind to Dicer to inhibit miRNA maturation and subsequently suppress the miRNA pathway in other therapeutic drug resistance study.29 In our recent work, we also found that an incretin-based regimen could be involved in the different outcomes of certain anti-diabetic therapy.30 In this study, the methylation status in the VTRNA2-1 promoter region had a significantly different pattern between the GLP-1 analog responders and non-responders. Detailed molecular characterization of the response to GLP-1 analogs in patients is thus crucial in the current precision medicine era.
The VTRNA2-1 is located in human chromosome 5 and is physically flanked by two genes, transforming growth factor beta induced (TGFBI) and SMAD Family Member 5 (SMAD5).31 Previous reports suggest that VTRNA2-1 could modulate expression of TGF-β1;32 however, recent literatures showed that expression of VTRNA2-1 could be induced via TGF-β1,29 which could have an impact on beta cell survival.33 TGF-beta signaling can also control endocrine differentiation by both inhibiting proliferation and enhancing differentiation of endocrine progenitor cells to become mature beta-cells. Some studies have shown that TGF-beta isoforms have a specific synergistic role in the GLP-1 signaling pathway in early pancreatic development, toward endocrine differentiation and away from acinar differentiation.34 The TGF-β/SMAD3 signaling pathway is important in regulating glucose and energy homeostasis.35 The loss of TGF-β signaling in obesity can lead to inflammation. In this study, there was a positive correlation between the gene expression of the VTRNA2-1 and serum TGF-β1 level, the correlation coefficient was moderate (Pearson’s r value=0.458, p=0.005) (online supplemental figure S3A). However, there was no significant difference in the serum level of TGF-β1 between the responsive and non-responsive groups (online supplemental figure S3B). The relation between the VTRNA 2-1 mRNA expression and methylation status of VTRNA 2-1 promoter was negatively correlated (online supplemental figure S3C). Furthermore, the change in A1C was significantly correlated with the methylation level but not with the RNA expression of VTRNA 2-1 and the TGF-beta1 levels (online supplemental figure 4). The reciprocal interaction between VTRNA2-1 and TGF-β1 on the response to GLP-1 analog treatment may not be assessed only by TGF-β1 levels in patients with T2DM.
DMRs are stretches of DNA in an organism’s genome that have different DNA methylation patterns compared with other samples. These samples can be different cells or tissues within the same individual, the same cell at different times, or cells from different individuals. Interindividual DMRs (inter-DMRs) with different methylation patterns have been reported among multiple individuals.36 These kinds of epigenetic markers can be used in the prediction of diseases and drug responses. Interesting, VTRNA2-1 is a metastable epiallele that is sensitive to a periconceptional environment such as maternal nutrition,37 which might indicate that the mother’s diet during the periconceptional stage can affect the life-long health of children, including the risk of cancer, metabolism status, or even drug response.
The setting of an observational study is not the ideal setting for assessing treatment response, in which the effect of residual confounding cannot be completely ruled out. However, the lack of randomized controlled trial in the responsiveness of GLP-1 analog treatment currently raises the importance of real world practice assessment. The clinical application of screening DMRs near VTRNA2-1 may be able to identify the patients who would be non-responsiveness to GLP-1 analogs before starting treatment. This would be helpful to avoid the ineffective use of this expensive drug in the current era of modern incretin-based therapy for patients with T2DM.
In conclusion, the variable response to GLP-1 analog therapy was correlated with methylation status in DMRs near VTRNA2-1 promoter. Individualized treatment options could be made through precise screening for this epigenetic marker.
Acknowledgments
We acknowledge the Molecular Medicine Research Center, Chang Gung University, Taiwan for the support of pyrosequencing.
References
Supplementary materials
Supplementary Data
This web only file has been produced by the BMJ Publishing Group from an electronic file supplied by the author(s) and has not been edited for content.
Footnotes
Contributors C-HL and C-NT wrote the manuscript. Y-SL performed methylation chip analysis, researched data, and contributed to discussion. Y-YH contributed to discussion and reviewed/edited the manuscript. C-NT reviewed/edited/submitted the manuscript. C-HL is the guarantor of this work and has full access to all the data in the study and takes responsibility for the integrity of the data and the accuracy of the data analysis.
Funding This work was supported by Chang Gung Memorial Hospital (grant numbers CORPG5F0011, CMRPG3H0401, CMRPG3H0402, CMRPG3H0403, CMRPG3H0941, CMRPG3H0942, CMRPG3H0943 for C-HL, CMRPD1K0111 for C-NT), and the Ministry of Science and Technology, ROC (grant numbers MOST105-2628-B-182A-007-MY3, MOST 105-2628-B-182-012- MY3, MOST 109-2635-B-182-002).
Disclaimer The funders had no role in study design, data collection and analysis, decision to publish, or preparation of the manuscript.
Competing interests None declared.
Patient consent for publication Not required.
Provenance and peer review Not commissioned; externally peer reviewed.
Data availability statement Data are available on reasonable request due to privacy/ethnical restrictions. C-HL has full access to all the data in the study.
Supplemental material This content has been supplied by the author(s). It has not been vetted by BMJ Publishing Group Limited (BMJ) and may not have been peer-reviewed. Any opinions or recommendations discussed are solely those of the author(s) and are not endorsed by BMJ. BMJ disclaims all liability and responsibility arising from any reliance placed on the content. Where the content includes any translated material, BMJ does not warrant the accuracy and reliability of the translations (including but not limited to local regulations, clinical guidelines, terminology, drug names and drug dosages), and is not responsible for any error and/or omissions arising from translation and adaptation or otherwise.