Article Text

Abstract
Introduction Epidemiological studies indicate an association between type 2 diabetes and cognitive dysfunction that appear to start already in the prediabetic state. Although cross-sectional studies have linked insulin resistance to impaired cognition, the potential predictive value of insulin resistance has not yet been sufficiently studied longitudinally without confounding by overt diabetes (and its pharmacological treatment).
Research design and methods We investigated longitudinal data from participants of the ‘Tübinger Evaluation of Risk Factors for Early Detection of Neurodegeneration’ Study. Subjects underwent a neurocognitive assessment battery (CERAD Plus battery; Consortium to Establish a Registry for Alzheimer’s Disease) at baseline and followed every 2 years (median follow-up 4.0 Q1–3: 2.2–4.3 years). Subjects within a pre-diabetic glycated hemoglobin range of 5.6%–6.5% underwent 5-point 75 g oral glucose tolerance tests (OGTTs) with assessment of insulin sensitivity and insulin secretion (n=175). Subjects with newly diagnosed diabetes mellitus or with major depressivity (Beck Depression Inventory >20) were excluded (n=15). Data were analyzed by mixed models using sex, age and glycemic trait as fixed effects. Subject and time since first measurement were used as random effects.
Results Insulin sensitivity was positively associated with the CERAD sum score (higher is better) in a time-dependent manner (p=0.0057). This result is mainly driven by a steeper decrease in the memory domain associated with lower insulin sensitivity (p=0.029). The interaction between age and insulin sensitivity was independent of glycemia (p=0.02). There was also no association between insulin secretion and cognition.
Conclusions Insulin resistance rather than sole elevation of blood glucose predicts cognitive decline, specifically in the memory domain, in persons with prediabetes. Treatments of diabetes that improve insulin sensitivity might therefore have the potential to postpone or even prevent cognitive decline in patients with diabetes.
- insulin resistance
- diabetes complications
This is an open access article distributed in accordance with the Creative Commons Attribution Non Commercial (CC BY-NC 4.0) license, which permits others to distribute, remix, adapt, build upon this work non-commercially, and license their derivative works on different terms, provided the original work is properly cited, appropriate credit is given, any changes made indicated, and the use is non-commercial. See: http://creativecommons.org/licenses/by-nc/4.0/.
Statistics from Altmetric.com
Significance of this study
What is already known about this subject?
Epidemiological studies indicate an association between type 2 diabetes and cognitive dysfunction that already starts in the prediabetic state.
What are the new findings?
Insulin resistance rather than sole elevation of blood glucose predicts cognitive decline, specifically in the memory domain, in persons with prediabetes.
How might these results change the focus of research or clinical practice?
Treatments of diabetes that improve insulin sensitivity might therefore have the potential to postpone or even prevent cognitive decline in patients with diabetes.
Introduction
The epidemiological association of type 2 diabetes mellitus with cognitive dysfunction ranging from mild cognitive impairment to manifest dementia is well established.1 This association already starts in midlife; and the longer the duration of diabetes, the higher the risk for developing slight cognitive impairment and even dementia.1 Moreover, cognitive decline seems to start well ahead of the manifestation of overt diabetes, in the prediabetic state.2 In order to understand the time line of progression and the interplay of these pathologic entities, studies in subjects at high risk for diabetes or dementia are needed.
The pathogenetic link between impaired glycemic control and cognitive decline has not yet been entirely elucidated. Reduced insulin secretion and peripheral insulin resistance are the major pathomechanisms in the development of type 2 diabetes mellitus. Several studies have linked peripheral insulin resistance in healthy subjects with impaired cognitive performance. However, only a minority of them had a longitudinal study design and they all assessed glucose metabolism from fasting glucose and/or fasting insulin levels only.3–9 These measurements cannot sufficiently address all major aspects of glucose metabolism, as humans are in the postprandial state most of the daytime. Therefore, standardized challenge tests provide more precise measurements of glucose metabolism and insulin sensitivity.
We therefore investigated whether traits of glucose metabolism including insulin sensitivity and insulin secretion are associated with future cognitive performance and might predict cognitive decline in non-diabetic subjects. As opposed to most previous studies, our study assessed traits of glucose metabolism by a standardized 5-point 75 g oral glucose tolerance test (OGTT) at one time point. This allowed us to obtain more precise information on glucose tolerance status, insulin sensitivity and insulin secretion. Comprehensive neurocognitive assessment was performed by the extended Consortium to Establish a Registry for Alzheimer’s Disease (CERAD Plus) test battery at baseline and every second year after baseline assessment.
Research design and methods
The subjects were recruited from the ongoing prospective longitudinal Tübinger Evaluation of Risk Factors for Early Detection of Neurodegeneration (TREND) Study, which conducts biennial assessments of elderly participants without neurodegenerative diseases but with at least one of the prodromal markers for neurodegeneration (depression, hyposmia or probable REM-sleep-behaviour disorder). Moreover, participants had no prior history of stroke, inflammatory disorders affecting the central nervous system (such as multiple sclerosis, encephalitis, meningitis, vasculitis) and inability to walk without aid.10 Of this ongoing TREND Study, 175 subjects with a prediabetic glycated hemoglobin (HbA1c) within a range of 5.6% and 6.5% underwent OGTT. In three subjects, diabetes was diagnosed from this OGTT according to the classification of the American Diabetes Association.11 These subjects were excluded from all further analysis. Furthermore, subjects with manifest depression (Beck Depression Inventory (BDI) scores>20) were also excluded from this analysis as depression represents a confounder for cognitive testing. This resulted in data from 160 participants that were finally analyzed for this study. Detailed subject characteristics at baseline are given in table 1. Subject characteristics and data of cognitive tests at different time points are shown in online supplemental table 1.
Supplemental material
Data are given as means±SEM
Assessment of cognitive function and depression
Cognition was tested using the established, standardized German version of the extended CERAD Plus neuropsychological battery.12 The battery contains the following subtests: semantic and phonematic verbal fluency tasks, Boston Naming Test, Mini Mental Status Examination, word list learn, word list recall, word list recognition, constructional praxis, recall of constructional praxis and the trail-making test parts A and B. The subtests of the CERAD Plus battery were grouped into four domains: executive, memory, language and visuospatial. This cognitive assessment battery was performed at baseline and every 2 years afterwards (median follow-up 4.0 years Q1–3: 2.2–4.3 years, online supplemental table 1). The CERAD Plus test battery sum score was calculated according to Chandler.13
Depressive symptoms were assessed with the BDI-I.14 The time line of the study is presented as online supplemental figure 1.
Oral glucose tolerance test
Subjects with a HbA1c of 5.6%–6.5% without known diabetes were metabolically investigated by a 5-point 75 g OGTT with assessment of insulin sensitivity and insulin secretion (n=175). After an overnight fast, subjects ingested a standard solution containing 75 g glucose (Accu-Chek Dextro O.G.T., Roche Diagnostics, Mannheim, Germany) at 08:00 hours. Subsequent glucose and insulin concentrations were determined from venous blood samples that had been obtained at 0, 30, 60, 90 and 120 min.
Glucose metabolism
Serum insulin was determined on an ADVIA Centaur XP immunoassay system (Siemens Healthineers, Eschborn, Germany). Blood glucose was measured by the oxidase method (EKF Diagnostic, Barleben, Germany). Insulinogenic Index (IGI) was calculated as (Insulin 30–Glucose 0). The OGTT-derived Insulin Sensitivity Index (ISI) was calculated as ISI=10 000√(Glucose 0∙Insulin 0∙Glucose mean∙Insulin mean), as proposed by Matsuda and DeFronzo.15 The Disposition Index (DI) was calculated as ISI × IGI to account for the individual degree of insulin resistance. As an alternative to the Matsuda Index, we also computed the non-esterified fatty acid (NEFA)-ISI Index from insulin and free fatty acid levels during OGTT. This has been suggested to be a more robust marker of insulin sensitivity in comparison to gold-standard methods measuring insulin sensitivity.16
Statistical analysis
All analyses were performed with R V.3.4. The association of glycemic traits (insulin sensitivity and insulin secretion) with the change of cognitive scores was examined using linear mixed models with random slopes and random intercepts. All available results from repeated cognitive testing were included into the analyses. Prior to modeling, glycemic traits were log-transformed and cognitive scores were inverse-normal transformed to obtain normally distributed variables. Outliers above or below more than 5 SD from the mean were excluded (out of 10 843 data values that were available for the reported analyses, 126 values were excluded from analyses). The linear mixed models were fitted with the lme4 package using sex, age at each measurement and glycemic trait as fixed effects. Subject and elapsed time since first measurement were applied as random effects. The following model formula was used: neurologic_outcome~sex + age * metabolic_variable + (1+time|subject_id). The null hypothesis was no interaction between age at each measurement and glycemic variable, which would suggest that the glycemic status does not modulate the age-dependent slope (corresponding to the natural change) of the cognitive score. In order to reduce multicollinearity and enable detection of marginal effects (age on cognitive score, glycemic trait on cognitive score), age and glycemic trait were standardized (scaled to a mean of 0 with an SD of 1, for glycemic traits this step was performed after log-transformation). Variables were Z-score transformed (centered and scaled) for fitting mixed models and for improvement of the interpretation of model coefficients.17
We also modeled the risk of a cognitive decline >5% for the cognitive score using Kaplan-Meier estimators. Here, we performed a median cut for insulin sensitivity, which led to a comparison of a stratum with high and low insulin sensitivities. The two survival curves of the median-splitted insulin sensitivity groups were compared using log-rank tests. Unless otherwise stated, values are reported as mean±SEM.
Results
As assessed during the OGTT, 92 subjects were normal glucose tolerant (NGT), 36 had impaired fasting glucose (IFG), 18 had impaired glucose tolerance (IGT) and 14 had both IGT and IFG. Detailed subject characteristics at baseline are given in table 1. The three subjects newly diagnosed with diabetes during the OGTT were excluded from further analysis. Data sets of 160 participants at baseline, of 149 participants after 2 years and 78 participants after 4 years could be analyzed.
The CERAD sum score decreased (ie, worsened) with age (β=−0.890.26, p=0.0009) and was positively associated with insulin sensitivity assessed by the Matsuda Index (β=0.330.13, p=0.015).
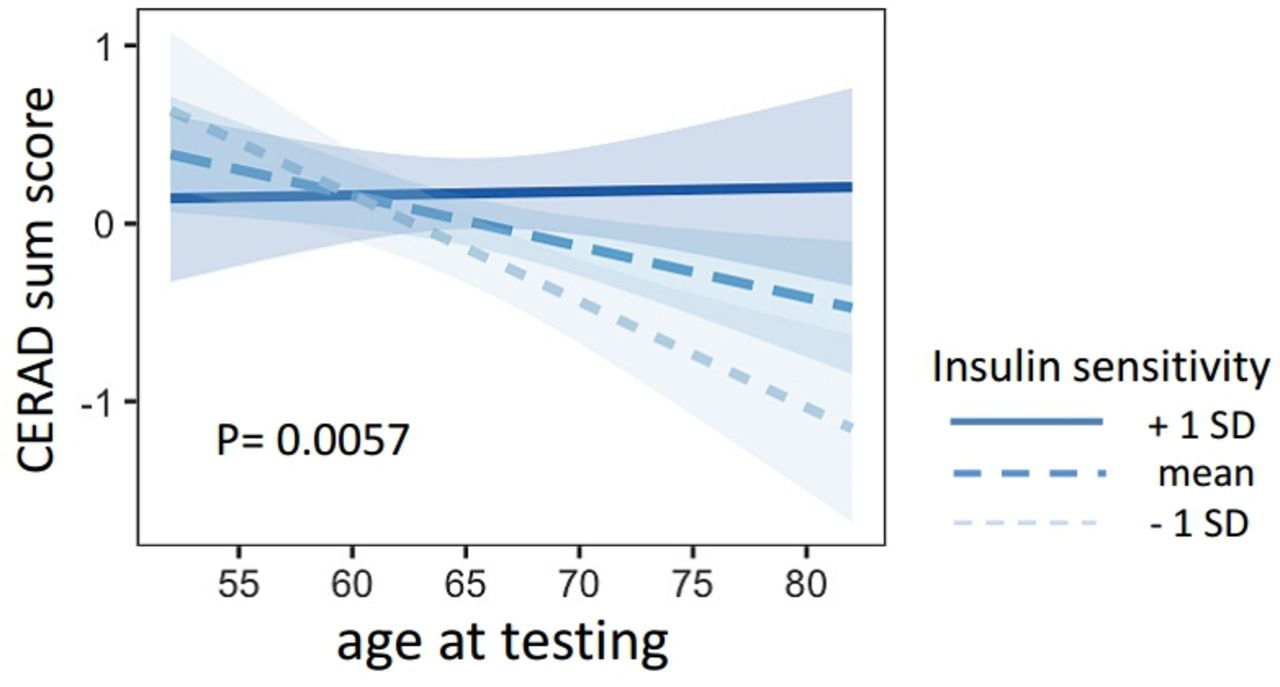
Insulin sensitivity was associated with the time-dependent change of CERAD sum score (interaction for age × insulin sensitivity, β=0.320.11, p=0.0057). Lower insulin sensitivity was associated with a steeper decline of the CERAD sum score (figure 1). This interaction was also replicated with an alternative ISI, the NEFA-ISI Index (β=0.360.13, p=0.0083). The interaction between age × insulin sensitivity (Matsuda Index) on CERAD sum score furthermore remained significant after adjustment for BMI, systolic and diastolic blood pressure, triglycerides and cholesterol (β=0.170.06, p=0.0057).

Presented are the regression lines from the statistical models. The linear trend lines show the association of age and the CERAD sum score for different levels of insulin sensitivity (mean±1 SD). CERAD, Consortium to Establish a Registry for Alzheimer’s Disease.
When analyzing the different cognitive domains (memory, executive, language and visuospatial domains), there was an interaction between insulin sensitivity and age on the memory domain performance (β=0.27±0.12, p=0.029), while no interactions on the other cognitive domains were detected (all p>0.05, table 2).
Interaction of age at cognitive tests and insulin sensitivity and insulin secretion on the different cognitive domains
Insulin secretion (assessed by the DI), was neither associated with the CERAD sum score nor with the tested subdomains (all p>0.16, table 2).
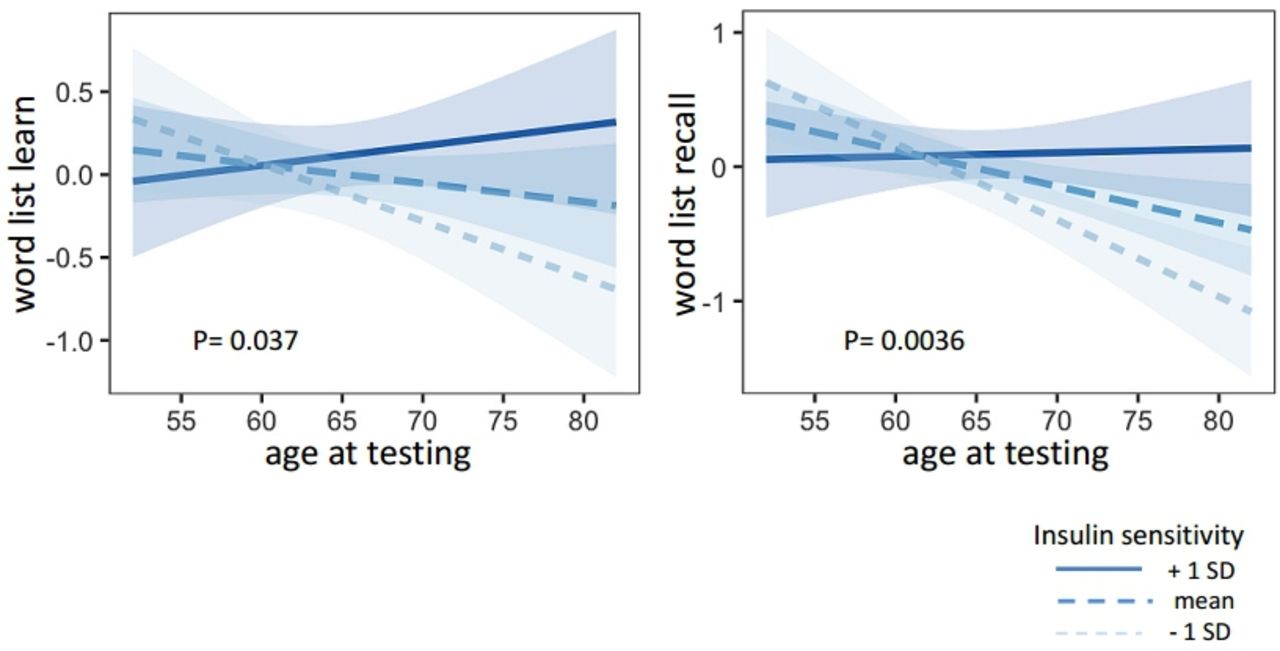
Similarly to the CERAD sum score, tests assessing memory function worsened with age (word list recall β=−0.860.24, p=0.00052, word list learn β=−0.61±0.26, p=0.022) and there was a trend towards a positive association with insulin sensitivity (word list recall β=−0.23±0.0.12, p=0.063; word list learn β=0.24±0.13, p=0.067) (table 3). There was a steeper decline over time in insulin-resistant subjects (word list recall β=0.31±0.11, p=0.0036; world list learn β=0.24±0.11, p=0.037) (figure 2, table 3).

Presented are the regression lines from the statistical models. The linear trend lines show the association of age and the cognitive memory tests ‘world list learn’ (left) and ‘word list recall’ (right) for different levels of insulin sensitivity (mean±1 SD).
Interaction of insulin sensitivity and age on cognitive memory scores ‘word list recall’ and ‘word list learn’
All above listed interactions remained significant after adjusting for area under the curve (AUC)0–120 glucose, that is, glycemia during the OGTT (all p≤0.04). Moreover, all listed interactions remained significant after adjusting for BMI (all p≤0.029). The interaction between insulin sensitivity and age on the CERAD sum score also remained significant after adjusting for cardiovascular risk factors that could potentially influence cognition (hypertension, hypercholesterinemia and smoking, p=0.01).
Besides the OGTT-derived Matsuda ISI, we also analyzed fasting insulin resistance (homeostatic model assessment of insulin resistance (HOMA-IR)). Comparable results were obtained, however, effect sizes were higher for the Matsuda Index (online supplemental table 2).
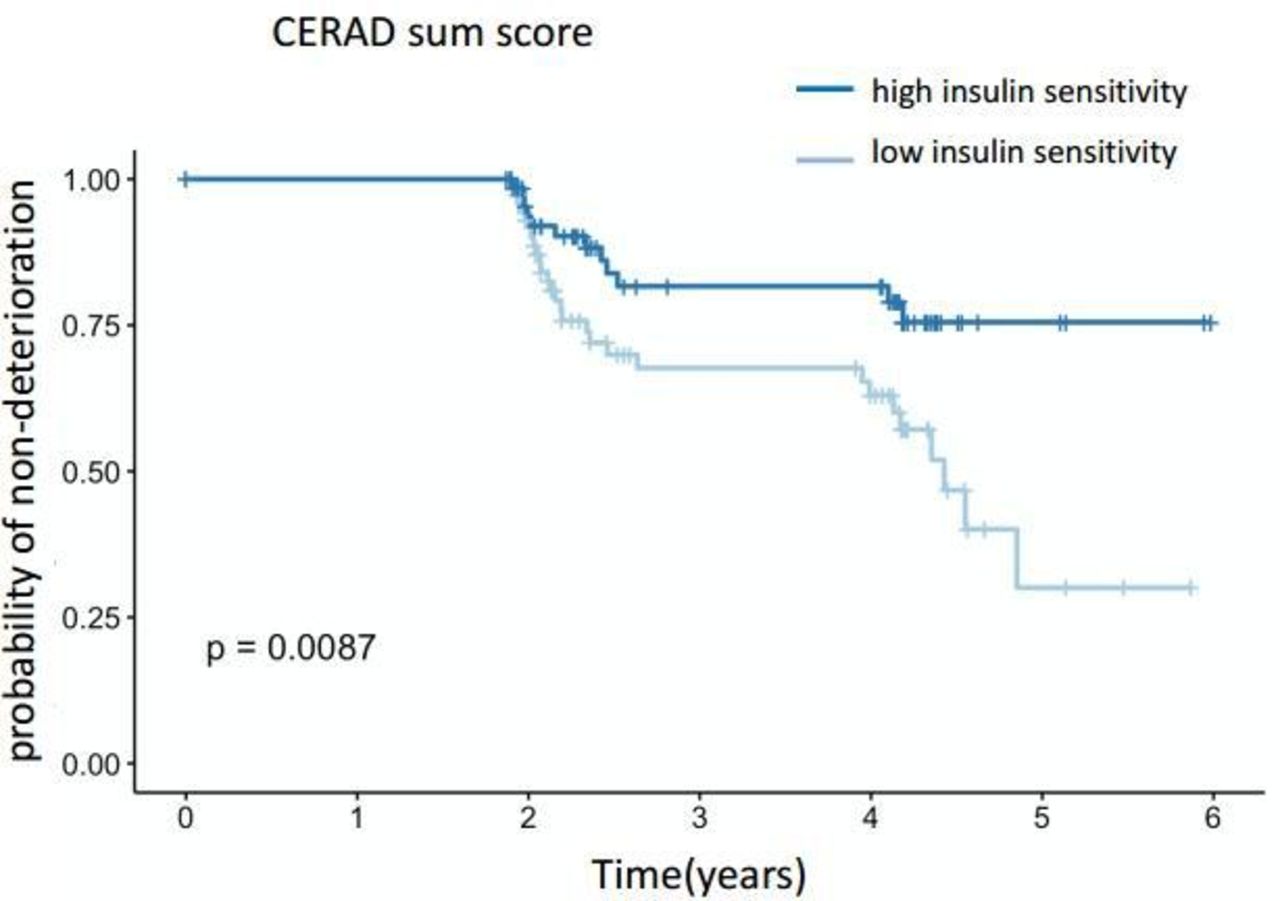
When modeling the risk of a decline >5% for the cognitive score using Kaplan-Meier estimators, the more insulin-resistant half of the subjects had a significantly higher risk for cognitive decline assessed by CERAD sum score (figure 3). The 95% CIs for the proportional hazards (Cox) model were −1.56 to −0.2, p=0.01 with estimates −0.88±0.35.
Risk of cognitive decline (assessed by CERAD sum score) >5% using Kaplan-Meier estimators. Subjects were stratified by the median of insulin sensitivity. Insulin-resistant subjects are represented in the lower curve, insulin-sensitive subjects in the upper curve. CERAD, Consortium to Establish a Registry for Alzheimer’s Disease.
Conclusions
In the present study, we detected insulin resistance as a significant modulator of cognitive decline in persons at risk for type 2 diabetes. In contrast, we did not find associations of insulin secretion with the tested cognitive variables. These results support and extend previous studies linking peripheral insulin resistance to cognitive decline.3–9 Of note, the association was independent of glycemia, suggesting that not elevated blood sugar per se but rather insulin resistance could be an important factor in the underlying mechanism that drives cognitive decline.
Insulin signaling in the brain has been shown to play a pivotal role in cognition which is summarized in a recent review of our group.18 There is a strong correlation between peripheral insulin sensitivity and central insulin action,19–22 at least for some brain areas centrally involved in memory and executive function.18 Thus, our findings of impaired cognitive function in insulin-resistant subjects are likely due to altered insulin signaling in the brain.23 Insulin receptors are densely expressed in brain areas such as the hippocampus and prefrontal cortex that are involved in memory function.24 25 Correspondingly, we found effects in regards to insulin sensitivity especially in the memory domain.
Another possible hypothesis is that inflammation might be the pathophysiological link between the two diseases. Chronic inflammation is often observed in insulin-resistant subjects and leads to tissue alteration not only in the periphery but also in the brain.18 As our current data cannot prove the mechanistic link between insulin sensitivity and cognition, further studies are still needed to elucidate this issue.
To our knowledge, there is only one longitudinal study investigating the link between glucose metabolism and overt dementia with precise metabolic phenotyping.26 The association of low insulin sensitivity with a higher risk of dementia did not withstand adjustments for other risk factors (including diabetes) in this study. However, its primary and secondary end points were manifest Alzheimer’s disease (AD) or vascular dementia, and even though a subgroup was classified with ‘any dementia or cognitive impairment’, the study might have missed the association of insulin sensitivity with an only slight decline in cognitive performance that would be expected in otherwise healthy persons. The same study found insulin secretion to be associated with an increased risk of AD in a population with a mean age of 71 years at baseline,26 a finding that we could not replicate in our younger subjects with a mean age of 64 years. The main differences are the longer duration of the other study with an older baseline age and a median follow-up of 12 years. Our current analysis had a median follow-up of 4 years but covered an age range from 44 years to 82 years (median 65 years), resulting in an observation period of 640 patient years. Of note, insulin secretion and insulin resistance are well correlated in subjects without diabetes. In our study, the use of a cohort in transition from normal glucose regulation to diabetes could have increased the sensitivity to precisely detect associations between metabolism and cognition. Although our data are observational, very recent results from large genetic studies demonstrate a genetic association between AD and diabetes, suggesting that the link might indeed be causal.27
One limitation of our current study is the relatively small sample size. However, we improved statistical power by using age at each measurement and glycemic trait as fixed effects and subject and elapsed time since first measurement as random effects. Furthermore, the number of patients with IFG and/or IGT was smaller than the number of persons with NGT. This proportion is, however, in line with previous findings28 29 and underlines that HbA1c and OGTT detect different phenotypes of disturbed glucose metabolism. Also, we had no follow-up values of metabolic traits available for analyses. Such follow-ups will be of particular interest when following the progression from prediabetes towards overt diabetes, but would not affect the predictive value of insulin sensitivity at baseline.
Our current findings altogether suggest the need of an early intervention in persons at risk for diabetes and dementia that targets insulin resistance. Treatment strategies for diabetes that improve insulin sensitivity could have the potential to postpone cognitive decline in such patients. In fact, insulin-sensitizing peroxisome proliferator-activated receptor (PPAR) γ agonists were shown to preserve or improve cognitive function in patients with AD, in some, but not all studies.30 31 Also, restoring insulin signaling in the brain, for example, by intranasal insulin administration led to improvement of cognitive memory processes in healthy persons as well as patients with AD,31 32 again emphasizing the role of brain insulin signaling/sensitivity in cognitive function. One further approach for the treatment of cognitive impairments has recently gained growing interest - glucagon-like peptide-1 (GLP-1) receptor agonists.31 33 These drugs showed first beneficial effect in recent pilot trials34–36 and larger trials are ongoing.31 33 Of note, animal studies indicate a close interaction between GLP-1 receptor and insulin receptor signaling in the brain.33 37 38 Thus, the cognitive benefits of GLP-1 receptor agonists could at least partly be modulated via improved brain insulin sensitivity.
In summary, insulin resistance is associated with cognitive decline and specifically memory impairment in persons at increased risk for diabetes. Therefore, insulin resistance rather than sole elevation of blood glucose could predict cognitive impairment. Therapeutic interventions improving insulin sensitivity might therefore have the potential to postpone or even prevent cognitive decline.
Acknowledgments
The authors thank all the study participants for their cooperation with this project. The authors thank the clinical study teams at the University of Tübingen, Germany for technical assistance. The authors thank the Deutsche Forschungsgemeinschaft and the Open Access Publishing Fund of the University of Tübingen, Germany, for their support.
References
Supplementary materials
Supplementary Data
This web only file has been produced by the BMJ Publishing Group from an electronic file supplied by the author(s) and has not been edited for content.
Footnotes
Contributors CW researched and analyzed data and drafted the manuscript, KB researched data and contributed to discussion, RW analyzed data and contributed to discussion, SK, HP contributed to discussion, GS contributed to discussion, WM, TG, DB contributed to the design of the study and to discussion, GWE, FM contributed to discussion, H-UH, AF, MH contributed to the design of the study and to discussion. All authors approved the final version of the manuscript prior to submission.
Funding Part of this work was supported by a grant (01GI0925) from the Federal Ministry of Education and Research (BMBF) to the German Center for Diabetes Research (DZD e.V.). The TREND Study has been, and still is supported by the Hertie Institute for Clinical Brain Research, the German Centre for Neurodegenerative Diseases (DZNE within the framework of iMed Helmholtz Association), the Centre for Integrative Neuroscience, TEVA Pharmaceutical Industries Ltd., Union Chimique Belge (UCB), Janssen Pharmaceuticals, Inc. and the International Parkinson Fonds. The supporting institutions had no influence on the design, conduct, or analysis of the study.
Competing interests None declared.
Patient consent for publication Not required.
Ethics approval Informed written consent was obtained from study participants prior inclusion in the study and the ethics committee of the University of Tübingen approved the protocol (90/2009BO2 and 350/2007BO1).
Provenance and peer review Not commissioned; externally peer reviewed.
Data availability statement The data are not publicly available because they contain information that could compromise research participant privacy/consent.
Supplemental material This content has been supplied by the author(s). It has not been vetted by BMJ Publishing Group Limited (BMJ) and may not have been peer-reviewed. Any opinions or recommendations discussed are solely those of the author(s) and are not endorsed by BMJ. BMJ disclaims all liability and responsibility arising from any reliance placed on the content. Where the content includes any translated material, BMJ does not warrant the accuracy and reliability of the translations (including but not limited to local regulations, clinical guidelines, terminology, drug names and drug dosages), and is not responsible for any error and/or omissions arising from translation and adaptation or otherwise.