Article Text

Abstract
Introduction Exposure to malnutrition in early life has been found to significantly elevate type 2 diabetes risk in adulthood. However, the changes in metabolites resulting from malnutrition in early life have not been studied. The aim of this study was to identify metabolites with levels associated with type 2 diabetes resulting from exposure to China’s Great Famine (1959–1962).
Research design and methods Participants were from SPECT-China 2014 and SPECT-China2 2019, two cross-sectional studies performed at the same site. In total, 2171 subjects participated in SPECT-China and SPECT-China2 simultaneously. The sample size of fetal-exposed (1959–1962) versus non-exposed (1963–1974) individuals was 82 vs 79 in 2014 and 97 vs 94 in 2019. Metabolomic profiling was performed between famine-exposed and non-exposed groups.
Results Among the different famine exposure groups, the fetal-exposed group (1959–1962) had the greatest incidence rate (12.5%), with an OR of 2.11 (95% CI 1.01 to 4.44), compared with the non-exposed group (1963–1974). Moreover, compared with those in the non-exposed group (1963–1974), four metabolites (indole-3-carbinol (I3C), phosphatidylcholine (PC) (22:6(4Z,7Z,10Z,13Z,16Z,19Z)/16:1(9Z)), pyrimidine, and PC(16:1(9Z)/22:5(4Z,7Z,10Z,13Z,16Z))) showed significantly lower relative intensities in the famine and diabetes groups both in 2014 and 2019. Pyrimidine significantly mediated the association of famine exposure with diabetes, and I3C marginally mediated this association.
Conclusions Famine exposure in the fetal period could increase type 2 diabetes risk in adults, even those in their 60s. I3C and pyrimidine are potential mediators of the effects of famine exposure on diabetes development.
- diabetes mellitus
- type 2
- malnutrition
Data availability statement
Data are available upon reasonable request.
This is an open access article distributed in accordance with the Creative Commons Attribution Non Commercial (CC BY-NC 4.0) license, which permits others to distribute, remix, adapt, build upon this work non-commercially, and license their derivative works on different terms, provided the original work is properly cited, appropriate credit is given, any changes made indicated, and the use is non-commercial. See: http://creativecommons.org/licenses/by-nc/4.0/.
Statistics from Altmetric.com
Significance of this study
What is already known about this subject?
Early-life famine exposure has been found to significantly elevate type 2 diabetes risk in adulthood.
What are the new findings?
Fetal famine-exposed individuals had the highest incidence rate of diabetes.
Indole-3-carbinol (I3C), phosphatidylcholine (PC) (22:6(4Z,7Z,10Z,13Z,16Z,19Z)/16:1(9Z)), pyrimidine, and PC(16:1(9Z)/22:5(4Z,7Z,10Z,13Z,16Z)) showed significantly lower relative intensities in the famine and diabetes groups.
Pyrimidine significantly mediated the association of early-life famine exposure with diabetes, and I3C marginally mediated this association.
How might these results change the focus of research or clinical practice?
I3C and pyrimidine are potential mediators of diabetes associated with early-life undernutrition.
Introduction
The global prevalence of diabetes has rapidly increased over recent decades, and the number is projected to increase from 9.3% (463 million people) in 2019 to 10.2% (578 million) by 2030 and to 10.9% (700 million) by 2045.1 2 China is now the epicenter of the global type 2 diabetes mellitus epidemic.3 The overall prevalence (11.6% in 2013) has been soaring since the 1970s, when the Chinese economic reform began.4 5 The main factors contributing to this phenomenon are aging, food, physical activity, obesity, and potentially genetic background.4 Further understanding the primary factors contributing to the diabetes epidemic in China is crucial in determining future prevention and intervention programs.
Malnutrition in early life is another potential factor, as the Developmental Origins of Health and Disease theory suggests.6 China’s Great Famine from 1959 to 1962 spread throughout China and is regarded as one of the largest and most severe famines in the 20th century.7 Studies have shown that prenatal and/or early postnatal exposure to China’s Great Famine was associated with metabolic disturbances, including diabetes, non-alcoholic fatty liver diseases, metabolic syndrome and visceral adipose dysfunction,8–12 and was also found to exacerbate the association between hypertension and cardiovascular disease.13 These studies were analyzed in a quasi-experimental setting with lifetime risks. A recent cohort study found that fetal-exposed participants also showed an increased risk of diabetes in adulthood (HR 1.25, 95% CI 1.07 to 1.45), even during a median of 7.3 years of follow-up.14 The participants recruited were in their 40s. Whether the effects of famine exposure can persist in the elderly (60s) population needs further verification.
According to the above results, the metabolic system in humans can undergo persistent changes as a result of famine exposure, but the contribution of the mechanism to human disease remains to be defined. Metabolomics is defined as ‘the quantitative measurement of the dynamic multiparametric metabolic response of living systems to pathophysiological stimuli or genetic modification’.15 Animal models exposed to prenatal malnutrition show metabonomic changes in the metabolic pathways related to energy metabolism and glutamate metabolism in the brain and amniotic fluid.15 16 As far as we know, comprehensive metabonomic profiling following prenatal exposure to malnutrition is lacking in humans, and this information could be critical to understanding the famine-induced plasticity of the metabolic system. Here, we performed metabolomic profiling in individuals prenatally exposed to China’s Great Famine and in unexposed individuals as controls. We aimed to identify metabolites that were significantly changed on exposure to famine and their role in the association of famine exposure with type 2 diabetes.
Research design and methods
Participants
SPECT-China (registration number ChiCTR-ECS-14005052; www.chictr.org.cn) is a cross-sectional survey on the prevalence of metabolic diseases and risk factors in East China. A stratified cluster sampling method was used to select a sample in the general population. The sampling process was stratified according to rural/urban area and economic development status in Shanghai, Jiangxi Province and Zhejiang Province. Adults aged 18 years old and above who were Chinese citizens and have lived in their current residence for 6 months or longer were selected and invited to our study. Those with severe communication problems and acute illness and showed an unwillingness to participate were excluded from the study. The overall response rate was 90.8%. In total, 6899 subjects were included in the SPECT-China study from February to June 2014.17
SPECT-China2 (registration number ChiCTR1900021356; www.chictr.org.cn) is a continuous cross-sectional study at the same study sites as SPECT-China from February to June 2019. Inclusion and exclusion criteria were also the same. A total of 5097 participants participated in a comprehensive examination. After excluding 209 participants with missing laboratory and questionnaire results, 4888 subjects were included in SPECT-China2.
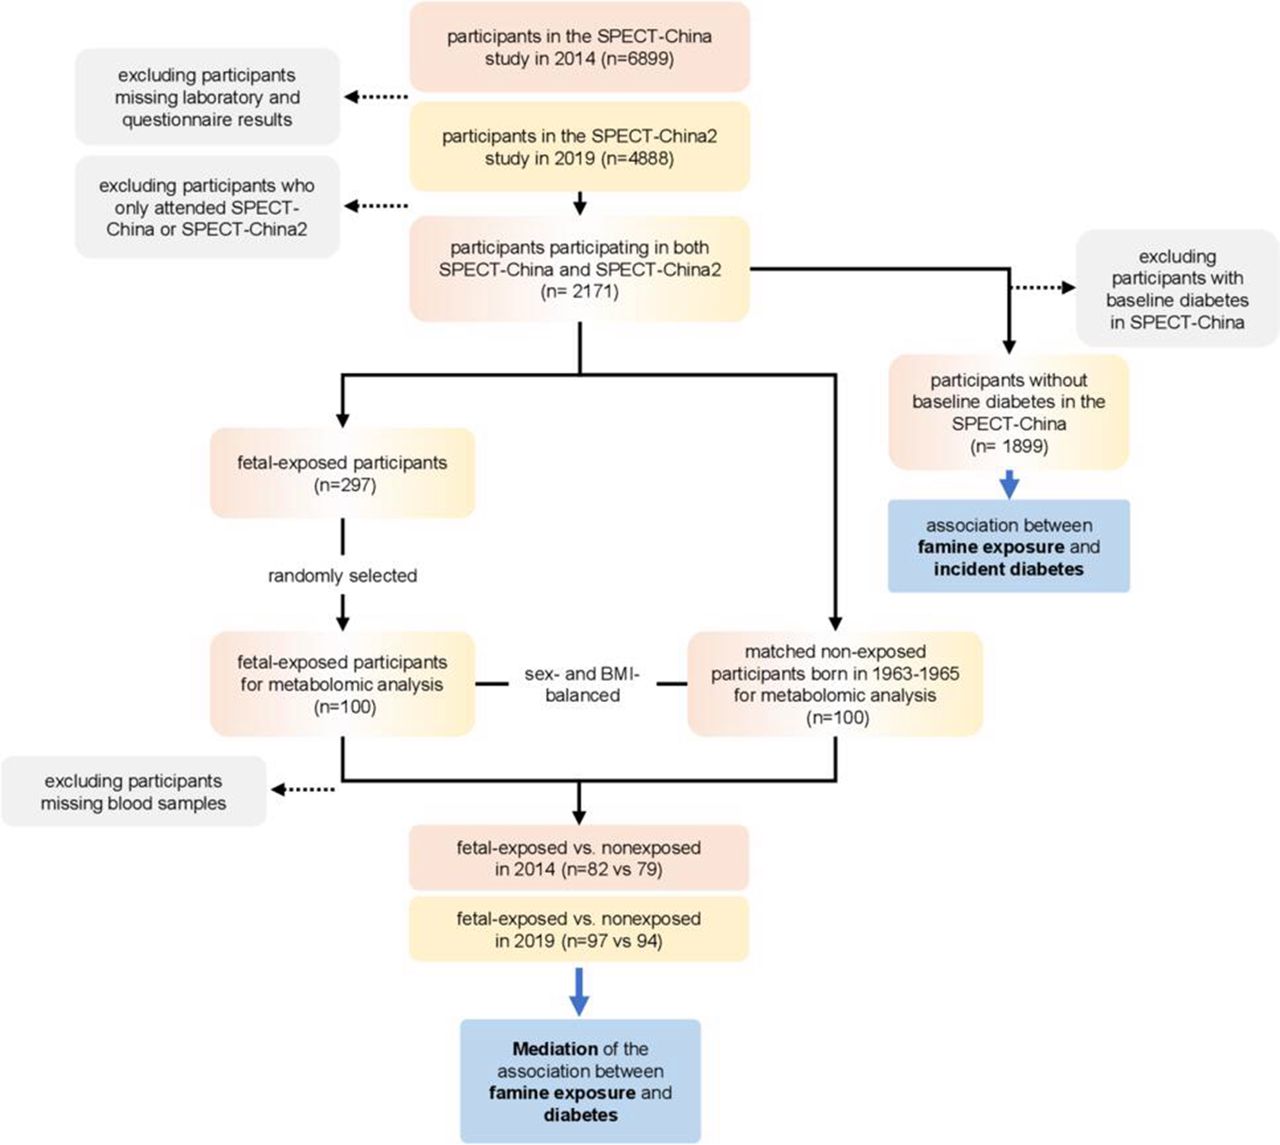
Among them, 2171 subjects participated in SPECT-China and SPECT-China2 simultaneously. A total of 1899 subjects had no baseline diabetes in SPECT-China (figure 1).

Flow chart of the study participants. BMI, body mass index.
Metabolomic profiling sample selection
Among the 2171 participants in both SPECT-China and SPECT-China2, 297 experienced fetal famine exposure. Then, 100 participants were randomly selected from the 297 participants with randomization number. Randomization numbers were generated using the SAS statistical software package V.9.4. Meanwhile, each of the fetal famine-exposed participants was matched with a sex-balanced and body mass index (BMI)-balanced non-exposed participant (born in 1963–1965) to ensure a balanced distribution of sex and BMI. Some serum samples were used in previous laboratory examinations. Finally, the sample size of fetal-exposed versus non-exposed women was 82 vs 79 in 2014 and 97 vs 94 in 2019 (figure 1).
Exposure age categories
Exposure to famine was based on a proxy, the year of birth. Based on the study by van Abeelen et al and Bogin’s life cycle theory,18 19 subjects were categorized into five groups according to their life stages when exposed to famine from January 1, 1959, to December 31, 1962: fetal period (age 52–55 years, in 2014), born between 1959 and 1962; childhood (age 56–65 years, in 2014), born between 1949 and 1958; adolescence and young adult period (age 66–93 years, in 2014), born between 1921 and 1948; non-exposed (age 40–51 years, in 2014), born between 1963 and 1974; and non-exposed (age ≤39 years, in 2014), born after 1975 (n=1245). In China, the prevalence of diabetes has risen dramatically in people older than 40 years.4 As such, we separated the non-exposed group into two groups: current age 40–51 years and current age ≤39 years.
The metabolomic profiling analysis included participants randomly selected from the fetal exposure group (age 52–55 years, in 2014) born between 1959 and 1962, and the non-exposed group (age 40–51 years, in 2014) born between 1963 and 1974.
Measurements
Trained staff used a questionnaire to collect information on demographic characteristics, medical history and lifestyle risk factors. Current smoking was defined as having smoked at least 100 cigarettes in one’s lifetime and currently smoking cigarettes.4 Body weight, height and blood pressure were measured with the use of standard methods as described previously.4 Venous blood samples were drawn after an overnight fast of at least 8 hours. Blood samples were stored at −20°C after collection and centrifugation and shipped by air on dry ice to a central laboratory within 2–4 hours of collection, which was certified by the College of American Pathologists. Glycated hemoglobin (HbA1c) was assessed by high-performance liquid chromatography (MQ-2000PT, China). Fasting plasma glucose (FPG) and lipid profile, including total cholesterol, triglycerides, high-density lipoprotein (HDL) and low-density lipoprotein (LDL), were measured by Beckman Coulter AU680 (Germany).
Diabetes was determined using a previous diagnosis by healthcare professionals, FPG level ≥7.0 mmol/L or HbA1c ≥6.5%. Hypertension was assessed by systolic blood pressure ≥140 mm Hg, diastolic blood pressure ≥90 mm Hg, or self-reported previous diagnosis of hypertension by physicians. Dyslipidemia was defined as total cholesterol ≥6.22 mmol/L (240 mg/dL), triglycerides ≥2.26 mmol/L (200 mg/dL), LDL ≥4.14 mmol/L (160 mg/dL), HDL <1.04 mmol/L (40 mg/dL) or a self-reported previous diagnosis of hyperlipidemia by physicians, according to the modified National Cholesterol Education Program Adult Treatment Panel III. Overweight was defined as BMI 23–24 kg/m² and obesity as 25 kg/m² or more because these cut-offs have been recommended as more reasonable thresholds to define overweight and obesity in Asians.20
Metabolomic profiling
Metabolite extraction
Fifty microliters of serum were transferred to a centrifuge tube. After the addition of 200 µL of extract solution (acetonitrile:methanol=1:1, containing isotopically labeled internal standard mixture), the samples were vortexed for 30 s, sonicated for 10 min in an ice-water bath, and incubated for 1 hour at −40°C to precipitate proteins. Then, the sample was centrifuged at 13 800 g for 15 min at 4°C. The resulting supernatant was transferred to a fresh glass vial for analysis. The quality control sample was prepared by mixing an equal aliquot of the supernatants from all of the samples.
LC-MS/MS analysis
LC-MS/MS (liquid chromatography tandem mass spectrometry) analyses were performed using a ultra-high performance liquid chromatography (UHPLC) system (Vanquish, Thermo Fisher Scientific) with a ultra performance liquid chromatography (UPLC) BEH Amide Column (2.1 mm × 100 mm, 1.7 µm) coupled to a Q Exactive HFX mass spectrometer (Orbitrap MS, Thermo). The mobile phase consisted of 25 mmol/L ammonium acetate and 25 mmol/L ammonia hydroxide in water (pH=9.75) (A) and acetonitrile (B). The analysis was carried out with an elution gradient as follows: 0–0.5 min, 95% B; 0.5–7.0 min, 95%–65% B; 7.0–8.0 min, 65%–40% B; 8.0–9.0 min, 40% B; 9.0–9.1 min, 40%–95% B; 9.1–12.0 min, 95% B. The column temperature was 35℃. The autosampler temperature was 4℃ and the injection volume was 3 µL.
The QE HFX mass spectrometer was used for its ability to acquire MS/MS spectra in information-dependent acquisition mode with the acquisition software (Xcalibur, Thermo). In this mode, the acquisition software continuously evaluates the full scan MS spectrum. The electrospray ionization (ESI) source conditions were set as follows: sheath gas flow rate of 50 arb, aux gas flow rate of 10 arb, capillary temperature of 320℃, full MS resolution of 60 000, MS/MS resolution of 7500, collision energy of 10/30/60 in NCE mode, and spray voltage of 3.5 kV (positive) or −3.2 kV (negative).
Data preprocessing and annotation
The raw data were converted to the mzXML format using ProteoWizard and processed with an inhouse program, which was developed using R and based on XCMS, for peak detection, extraction, alignment, and integration. Then, an inhouse MS2 database (BiotreeDB) was applied for metabolite annotation. The cut-off for annotation was set at 0.3.
Statistical analysis
We performed survey analyses with IBM SPSS Statistics V.22. All analyses were two-sided. A p value <0.05 indicated a significant difference. Continuous variables are expressed as mean±SD and categorical variables are described as percentage (%). The characteristics of the study sample were compared by Student’s t-test or analysis of variance for continuous variables with normal distribution, Mann-Whitney U test or Kruskal-Wallis test for continuous variables with a skewed distribution, and Pearson’s χ2 test for categorical variables.
To analyze the association between life stages when exposed to famine and incident diabetes, logistic regression analysis was used. In different life stages, non-exposed individuals (1963–1974) were the reference. Model 1 was unadjusted. Model 2 was adjusted for age, gender, current smoking, and rural/urban residence. Model 3 was adjusted for age, sex, current smoking, rural/urban residence, BMI category (less than 23 kg/m², 23–24 kg/m², and 25 kg/m² or more), hypertension and dyslipidemia.
For metabolomic profiling, 12 664 peaks were detected and 8391 metabolites remained after relative SD denoising. Then, the missing values were filled up by half of the minimum value. Additionally, the total ion current normalization method was employed in this data analysis. The final data set containing the peak number, sample name and normalized peak area information was imported into the SIMCA V.15.0.2 software package (Sartorius Stedim Data Analytics, Umea, Sweden) for multivariate analysis.
For comparisons of each group, we calculated the Euclidean distance matrix for the quantitative values of the differential metabolites and clustered them by the complete linkage method. We used the intersection of the differentially expressed metabolites in 2014 and 2019 to avoid false positive results. There were four metabolites (indole-3-carbinol (I3C), phosphatidylcholine (PC) (22:6(4Z,7Z,10Z,13Z,16Z,19Z)/16:1(9Z)), pyrimidine, PC(16:1(9Z)/22:5(4Z,7Z,10Z,13Z,16Z))) showing significantly lower relative intensity in the famine group both in 2014 and 2019.
Data of these four metabolites were scaled and logarithmically transformed to minimize the impact of both noise and high variance of the variables. After these transformations, the value of variable importance in the projection (VIP) of the first principal component in orthogonal projections to latent structures-discriminate analysis (OPLS-DA) was obtained. It summarizes the contribution of each variable to the model. Metabolites with VIP >1 and p<0.05 (Student’s t-test) were considered significantly changed metabolites. Principal component analysis (PCA), an unsupervised analysis that reduces the dimension of the data, was carried out to visualize the distribution and the grouping of the samples with changed metabolites. To visualize group separation, supervised OPLS-DA was applied.
We then tested the mediation effects of the four metabolites in the association between famine exposure and diabetes by the SPSS PROCESS macro in an approach with 5000 bootstrap samples.21 Mediation model 1 was unadjusted, and model 2 was adjusted for sex and BMI. First, mediation analysis was used to clarify whether exposure X was proposed as influencing outcome Y via an intervening variable M. In this study, we predicted that ‘famine’ impacted ‘diabetes’ with ‘metabolites’ as mediator variables. PROCESS was performed using one independent variable (famine exposure), one mediator (one metabolite), and one dependent variable (diabetes). Second, in the moderation or interaction analysis, we predicted that metabolites would moderate the relationship between famine exposure and diabetes. PROCESS was performed using one independent variable (famine exposure), one moderator (one metabolite), and one dependent variable (diabetes).
Results
The baseline characteristics of the study population by famine exposure period are presented in table 1. Compared with the non-exposed group (1963–1974), the fetal-exposed and childhood-exposed groups had higher FPG, HbA1c, blood pressure and LDL values and a higher prevalence of rural residence, obesity, hypertension and dyslipidemia.
Baseline characteristics of the study population
During a mean follow-up period of 5 years, 137 cases of diabetes were newly discovered among the 1899 participants, and the incidence rate was 1.44% per year. The associations between the famine exposure period and incident type 2 diabetes are shown in table 2. The crude rates in 5 years of incident diabetes were 2.0%, 12.5%, 10.6%, 7.9% and 3.9% in non-exposed (1975 and later), fetal-exposed (1959–1962), childhood-exposed (1949–1958), adolescence/adult-exposed (1921–1948) and non-exposed (1963–1974) groups, respectively. The unadjusted ORs for incident diabetes were 2.97 (95% CI 1.65 to 5.31) for the fetal-exposed group, 2.87 (95% CI 1.76 to 4.67) for the childhood-exposed group, and 2.01 (95% CI 1.05 to 3.87) for the adolescent/adult-exposed group compared with the non-exposed group (1963–1974). In the multivariate-adjusted model, only the OR for incident diabetes in the fetal-exposed group was significant (OR 2.11, 95% CI 1.01 to 4.44). No interaction effect of famine exposure and BMI on diabetes risk was found (p>0.05).
Association between famine exposure and diabetes incidence
The sample size of fetal-exposed versus non-exposed groups for metabolomic profiling was 82 vs 79 in 2014 and 97 vs 94 in 2019. We visualized the results of screening differential metabolites in the form of volcano plots and heatmaps (figure 2A,B). Each point in the volcano plot represents a metabolite, and the abscissa represents the fold change of the group compared with each substance. The size of the scatter represents the VIP value of the OPLS-DA model. A larger scatter distance correlates with a higher VIP value. Scattered dots represent the final screening results. Metabolites that were significantly upregulated are shown in red, metabolites that were significantly downregulated are shown in blue, and metabolites that were not significantly different are shown in gray. The differential metabolites obtained through the above analysis are often biologically similar in results and functions/complementary, or are positively controlled/negatively regulated by the same metabolic pathway, showing similar or opposite expression characteristics between fetal-exposed and non-exposed groups. For each group of comparisons, we calculated the Euclidean distance matrix for the quantitative values of the differential metabolites, clustered the differential metabolites in a fully linked method, and displayed them in a heatmap. The relative levels of 88 metabolites were significantly different between the fetal famine exposure group and the non-exposed group in 2014. As a verification, we found that 4 of the 88 metabolites were also significantly different between the fetal famine exposure group and the non-exposed group in 2019, as shown in the Venn diagram in figure 2C. The four metabolites were I3C, PC(22:6(4Z,7Z,10Z,13Z,16Z,19Z)/16:1(9Z)), pyrimidine, and PC(16:1(9Z)/22:5(4Z,7Z,10Z,13Z,16Z)). Furthermore, to verify the ability to discriminate among fetal-exposed, non-exposed, diabetes and non-diabetes, PCA and OPLS-DA were carried out and represented, showing a separation among groups using the four metabolites (online supplemental figure 1).
Supplemental material
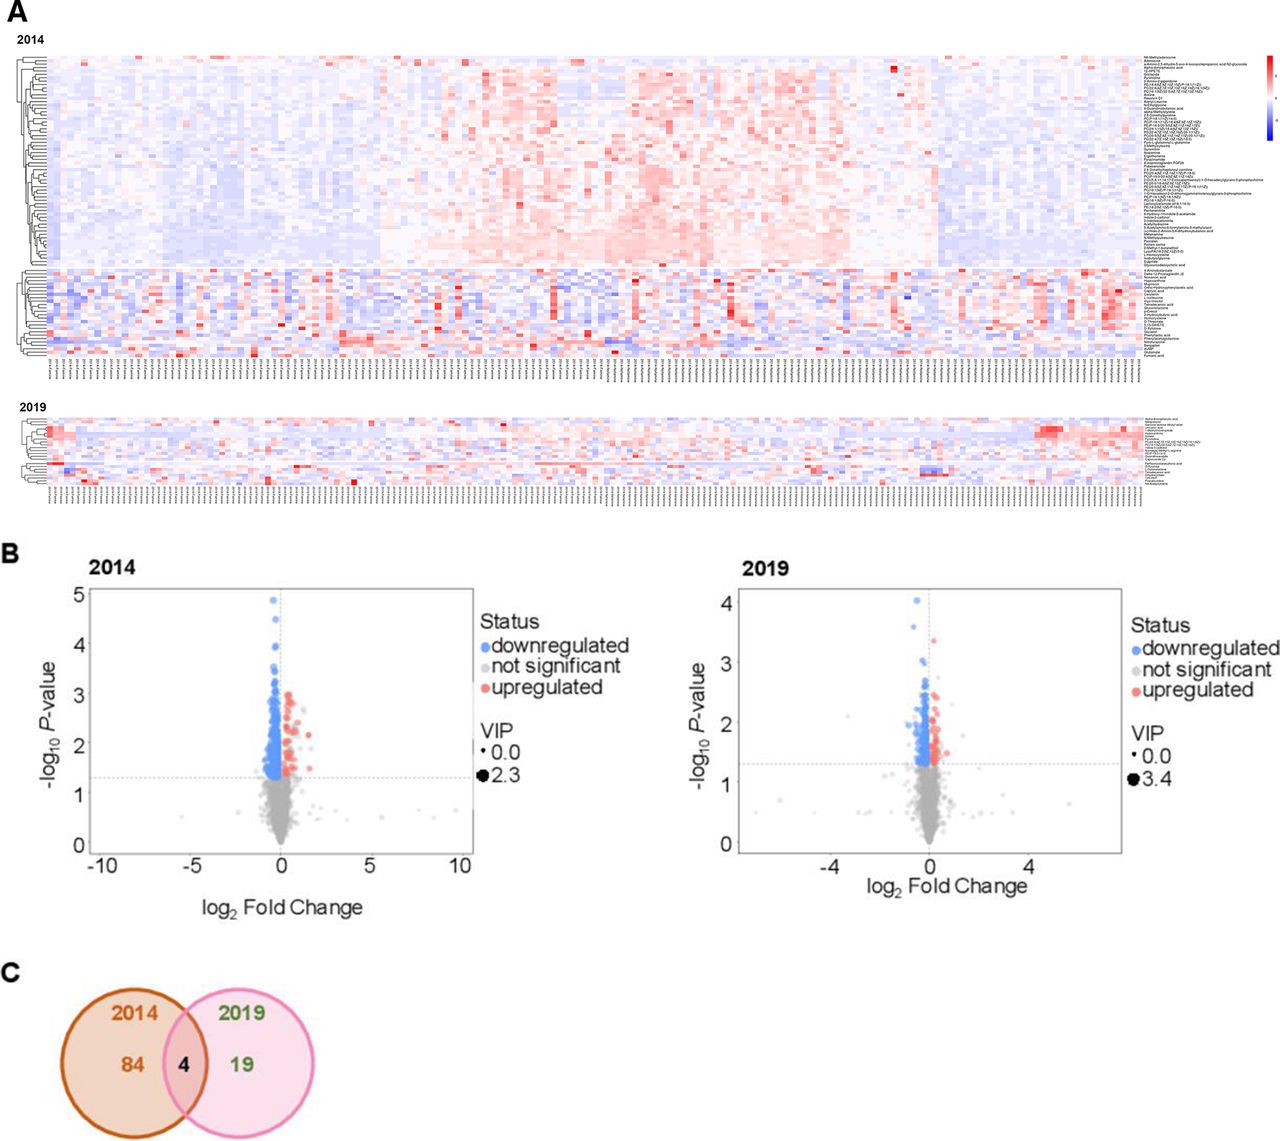
Examination of the metabolic profiles of peripheral blood from individuals from the fetal-exposed and non-exposed groups. (A) Heatmap representation of the fully linked clustering of the significantly changed positive and negative ion features in 2014 (upper panel) and 2019 (lower panel). (B) Volcano plot of the differential metabolites between fetal-exposed and non-exposed individuals in 2014 (left) and 2019 (right). (C) Venn diagram showing the metabolites that were significantly different between fetal-exposed and non-exposed individuals in both 2014 and 2019. VIP, variable importance in the projection.
The relative intensity of changed metabolites between the fetal-exposed and non-exposed groups in 2014 and 2019 is presented in table 3. The famine group had a non-significantly (2014) or significantly (2019) higher prevalence of diabetes.
Relative intensities of four significantly changed metabolites between the fetal-exposed and non-exposed groups in both 2014 and 2019
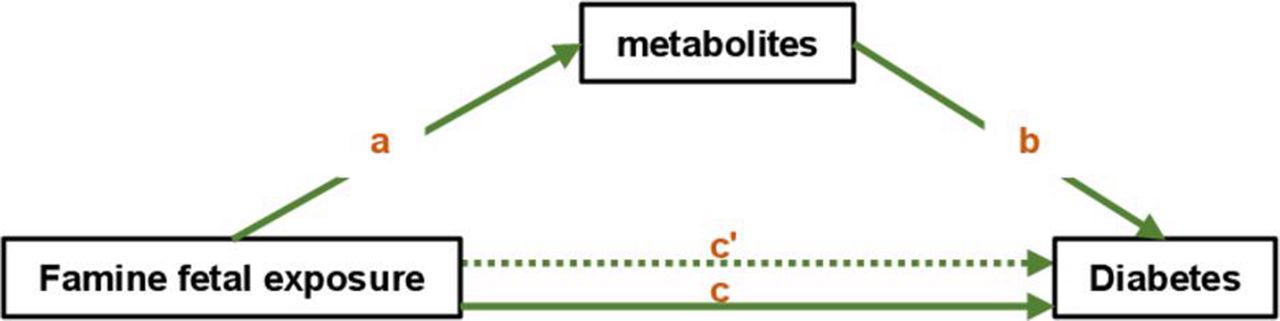
We further performed mediation analysis and tried to understand whether the four metabolites were significant mediators between famine and diabetes. Figure 3 illustrates the model for the mediation effect. In the model, ‘a’ indicates the path from famine (exposure) to metabolites (mediators), ‘b’ indicates the path from metabolites (mediators) to diabetes (outcome), and ‘c’ indicates the direct path from famine (exposure) to diabetes (outcome) when controlled for mediators.
The conceptual mediation model. In the model, ‘a’ indicates the path from famine (exposure) to metabolites (mediators), ‘b’ indicates the path from metabolites (mediators) to diabetes (outcome), ‘c’ indicates the total effect of famine (exposure) on diabetes (outcome), and ‘c'’ indicates the direct path from famine (exposure) to diabetes (outcome) when controlling for mediators.
Famine exposure in the fetal period was significantly associated with higher relative intensities of I3C, PC(22:6(4Z,7Z,10Z,13Z,16Z,19Z)/16:1(9Z)), pyrimidine and PC(16:1(9Z)/22:5(4Z,7Z,10Z,13Z,16Z)) in participants from 2014 and 2019. Among the metabolites, famine exposure showed consistently significant direct effects on diabetes in 2019 but not in 2014 (table 4). Moreover, pyrimidine significantly mediated the association between famine exposure and diabetes, although further adjusting for sex and BMI mitigated the significance. In 2019, I3C marginally mediated the association between famine exposure and diabetes in the unadjusted model (β=0.18, 95% CI −0.01 to 0.50). We also tested the interaction effect of famine exposure and the four metabolites on diabetes. None of the four metabolites showed a significant interaction effect (p for interaction ranging from 0.156 to 0.760).
Mediation analyses of famine exposure, metabolites, and diabetes
Sensitivity analysis
To avoid the difference resulting from the same participants with diabetes participating in the research in both 2014 and 2019, we reanalyzed the metabolites of the participants attending only SPECT-China2 in 2019 without baseline diabetes and found that the three metabolites were significantly or marginally different between the fetal famine exposure group and the non-exposed group (I3C, p=0.073; pyrimidine, p=0.040; PC(16:1(9Z)/22:5(4Z,7Z,10Z,13Z,16Z)), p=0.070), while PC(22:6(4Z,7Z,10Z,13Z,16Z,19Z)/16:1(9Z)) showed similar relative levels between the fetal famine exposure group and the non-exposed group (p=0.185).
Discussion
In this study, we found that early-life malnutrition could greatly increase the incidence of diabetes in the elderly population. The rates and ORs in 5 years of follow-up for incidental diabetes were highest in the fetal famine-exposed group (birth years 1959–1962). Moreover, compared with those in the non-exposed group, four metabolites (I3C, PC(22:6(4Z,7Z,10Z,13Z,16Z,19Z)/16:1(9Z)), pyrimidine, PC(16:1(9Z)/22:5(4Z,7Z,10Z,13Z,16Z))) showed significantly lower relative intensities in the fetal famine-exposed and diabetes groups in both 2014 and 2019. Pyrimidine significantly mediated the association between famine exposure and diabetes, and I3C marginally mediated the association between famine exposure and diabetes in 2014. These results identified key metabolites in individuals prenatally exposed to China’s Great Famine, which could mediate the association between early-life malnutrition and type 2 diabetes development.
Evidence suggests that famine exposure during early development before and after birth could cause metabolic abnormalities in adulthood. Prenatal famine exposure is associated with metabolic disorders in adulthood.22 23 A recent meta-analysis also showed that early-life famine exposure, especially fetal-infant exposure, may increase the risk of developing type 2 diabetes in adulthood.24 With regard to postnatal famine exposure, we and others believe that there is a link between famine exposure and type 2 diabetes and the development of other metabolic diseases in China.9 11 12 24 25 In this study, we found that the rates at 5 years of incident diabetes were highest in the fetal famine-exposed group (12.5%) and gradually decreased with increasing age in famine-exposed individuals (childhood-exposed: 10.6%; adolescence/adult-exposed: 7.9%), and the ORs for incident diabetes also followed this trend (fetal-exposed: 2.97; childhood-exposed: 2.87; adolescence/adult-exposed: 2.01). After adjusting for age, sex, current smoking, rural/urban residence, BMI category, hypertension and dyslipidemia, only the OR for incident diabetes in the fetal-exposed group was significant. Therefore, regardless of age, individuals with famine exposure in the fetal period could have a higher incidence of diabetes.
The duration of the effect caused by early-life malnutrition on glucose metabolism has not been fully elucidated to date. In people prenatally exposed to the Dutch famine, although it was confirmed that undernutrition during gestation was linked to decreased glucose tolerance, the effect does not seem to become more pronounced at age 58 than at age 50.26 In this study, the age of the famine-exposed population in 2019 was at least 57, and the incidence of diabetes was still increased greatly in fetal famine-exposed subjects (age 57–59), suggesting that early-life malnutrition could have a profound effect on metabolic function, and the differential metabolites in famine-exposed subjects might be a result of the long-lasting early-life malnutrition effect.
The roles of pyrimidines and their derivatives in the regulation of glucose metabolism have been studied in recent years. Short-term uridine administration could reduce the phosphorylation level of insulin signaling proteins and reduce the ability for insulin-stimulated blood glucose removal during an insulin tolerance test.27 Moreover, a series of pyrimidine derivatives were used as a treatment for type 2 diabetes mellitus and obesity-related symptoms. 5-methyl-2-(4-((4-(methylsulfonyl)benzyl)oxy)phenyl)-4-(piperazin-1-yl)pyrimidine derivatives ameliorated obesity-related symptoms by decreasing body weight without markedly changing food intake, normalized some serum biomarkers, and exerted therapeutic activity on fat deposition in liver tissue.28 Pyrimido[5,4-d]pyrimidine derivatives could also reduce the blood glucose area under the curve,29 and 6-amino-pyrido[2,3-d]pyrimidine-2,4-dione derivatives could inhibit α-glucosidase in a competitive mode.30 Another series of pyrimidine derivatives of small-molecule glucagon-like peptide-1 (GLP-1) receptor agonists were able to significantly increase insulin secretion.31 Thieno[2,3-d]pyrimidines, as antioxidant and anti-inflammatory molecules, could be attributed to the significant downregulation of nuclear factor kappa B (NF-κB) protein expression in hepatic tissues.32 In summary, given its critical role in metabolism regulation, pyrimidine has the potential to be developed as a predictor and therapeutic target in diabetes.
In this study, we found that I3C could be a mediator of diabetes, and this result is biologically plausible. I3C, an anti-inflammatory phytochemical, was proposed as a potential preventive agent against obesity and metabolic disorders since chronic inflammation in adipose tissue might lead to obesity-related insulin resistance and contribute to an increased risk of diabetes.33 I3C is a substance present in vegetables of the Brassicaceae family.34 When plant tissue is disrupted, an endogenous thioglucosidase is activated and converts glucobrassicin and other indolylic glucosinolates to indoles, principally to I3C.34 In recent studies with C57BL/6J mice after the administration of a high-fat diet, I3C showed a positive modulation of glucose, insulin, HbA1c levels, body weight, adipose tissue macrophage infiltration, glucose tolerance, and thermogenesis.35–37 The potential mechanism is decreased level of oxidative stress mediators and increased level of antioxidant enzymes and small molecules and expression of acetyl coenzyme A carboxylase, inflammatory biomarkers, peroxisome proliferator-activated receptor-γ (PPARγ), uncoupling proteins 1 and 3, PPARα, and PPARγ coactivator 1α.35–37 I3C also regulates the gut–liver–adipose tissue axis by restoring hepatic antioxidant capacity, attenuating the increased levels of hepatic proinflammatory cytokines and decreasing adipose inflammation and free fatty acid release.38 These findings suggest that I3C has benefits in preventing global metabolic disorders. Moreover, we found that I3C could be a mediator of the association between famine and diabetes, indicating that malnutrition in early life might modify the dietary habits of no preference of I3C in adulthood and finally lead to metabolic diseases.
Some limitations should also be mentioned in this preliminary study. First, the ages of subjects in the non-exposed and fetal-exposed groups were not comparable. The Great Famine in China was a national disaster, and we thus cannot identify a group of people with comparable ages who completely avoided the effects of famine, even in the childhood-exposed or adolescence/adult-exposed groups. Second, we presumed that the individuals did not migrate to other areas, which may cause bias. Due to strict requirements for obtaining permanent residency, only 2.68% of the rural population live in provinces other than their birthplace.39 Third, due to limited budget, we did not perform metabolomic analysis of every famine exposure group. According to the incidence of diabetes and its strong association with fetal exposure, we chose fetal-exposed and non-exposed control groups to perform this examination. Finally, targeted metabolomic examinations and further molecular biological experiments are also needed in future studies to provide more evidence for these results.
In conclusion, we reported that famine exposure in early life was positively and significantly associated with a higher incidence of diabetes, even in elderly subjects. I3C and pyrimidine are potential mediators of diabetes associated with early-life malnutrition. Future developments in targeted metabolomics to quantify these metabolites and their validation in more plasma samples will help assess the suitability of these promising metabolites for the early diagnosis of famine-related diabetes in both experimental and clinical studies.
Data availability statement
Data are available upon reasonable request.
Ethics statements
Ethics approval
The study protocol was approved by the Ethics Committee of Shanghai Ninth People’s Hospital, Shanghai Jiao Tong University School of Medicine (approval number of SPECT-China: 2013(86); approval number of SPECT-China2: SH9H-2019-T11-1). The study protocol conformed to the ethical guidelines of the 1975 Declaration of Helsinki as reflected in a priori approval by the appropriate institutional review committee. Informed consent was obtained from all participants included in the study.
Acknowledgments
The authors thank all team members and participants of the SPECT-China and SPECT-China2 study.
References
Supplementary materials
Supplementary Data
This web only file has been produced by the BMJ Publishing Group from an electronic file supplied by the author(s) and has not been edited for content.
Footnotes
YW, FX and HW contributed equally.
Contributors FX, NW and YL designed this study. YW, FX, HW, CC, YC, WZ and NW collected the data. YW, FX, HW, NW and YL analyzed the data and wrote the manuscript. All authors gave final approval of the version to be published.
Funding This study was supported by the National Natural Science Foundation of China (91857117); Science and Technology Commission of Shanghai Municipality (19140902400, 18410722300); Major Science and Technology Innovation Program of the Shanghai Municipal Education Commission (2019-01-07-00-01-E00059); Commission of Health and Family Planning of Pudong District (PWZxq2017-17); and Shanghai JiaoTong University School of Medicine (19XJ11007). The funders played no role in the design or conduct of the study, collection, management, analysis or interpretation of data, or in the preparation, review or approval of the article.
Competing interests None declared.
Provenance and peer review Not commissioned; externally peer reviewed.
Supplemental material This content has been supplied by the author(s). It has not been vetted by BMJ Publishing Group Limited (BMJ) and may not have been peer-reviewed. Any opinions or recommendations discussed are solely those of the author(s) and are not endorsed by BMJ. BMJ disclaims all liability and responsibility arising from any reliance placed on the content. Where the content includes any translated material, BMJ does not warrant the accuracy and reliability of the translations (including but not limited to local regulations, clinical guidelines, terminology, drug names and drug dosages), and is not responsible for any error and/or omissions arising from translation and adaptation or otherwise.