Article Text

Abstract
Introduction The minor allele of a missense variant, rs373863828, in CREBRF is associated with higher body mass index (BMI), lower fasting glucose, and lower odds of type 2 diabetes. rs373863828 is common in Pacific Island populations (minor allele frequency (MAF) 0.096–0.259) but rare in non-Pacific Island populations (MAF <0.001). We examined the cross-sectional associations between BMI and rs373863828 in type 2 diabetes and fasting glucose with a large sample of adults of Polynesian ancestries from Samoa, American Samoa, and Aotearoa New Zealand, and estimated the direct and indirect (via BMI) effects of rs373863828 on type 2 diabetes and fasting glucose.
Research design and methods We regressed type 2 diabetes and fasting glucose on BMI and rs373863828 stratified by obesity, regressed type 2 diabetes and fasting glucose on BMI stratified by rs373863828 genotype, and assessed the effects of rs373863828 on type 2 diabetes and fasting glucose with path analysis. The regression analyses were completed separately in four samples that were recruited during different time periods between 1990 and 2010 and then the results were meta-analyzed. All samples were pooled for the path analysis.
Results Association of BMI with type 2 diabetes and fasting glucose may be greater in those without obesity (OR=7.77, p=0.015 and β=0.213, p=9.53×10⁻⁵, respectively) than in those with obesity (OR=5.01, p=1.12×10⁻⁹ and β=0.162, p=5.63×10⁻⁶, respectively). We did not observe evidence of differences in the association of BMI with type 2 diabetes or fasting glucose by genotype. In the path analysis, the minor allele has direct negative (lower odds of type 2 diabetes and fasting glucose) and indirect positive (higher odds of type 2 diabetes and fasting glucose) effects on type 2 diabetes risk and fasting glucose, with the indirect effects mediated through a direct positive effect of rs373863828 on BMI.
Conclusions There may be a stronger effect of BMI on fasting glucose in Polynesian individuals without obesity than in those with obesity. Carrying the rs373863828 minor allele does not decouple higher BMI from higher odds of type 2 diabetes.
- glucose
- BMI
- obesity
- genetics
Data availability statement
Data are available in a public, open access repository. Data are available upon reasonable request. No data are available. The 2010 sample data from Samoa examined in this study are available from dbGaP (accession number: phs000914.v1.p1). The 1991–1995 and 2002–2003 sample data from Samoa and American Samoa are not available because participants did not consent to data sharing when enrolled. Sample data from Aotearoa New Zealand are not publicly available owing to consent restrictions, but can be requested from author TRM (https://orcid.org/0000-0003-0844-8726) under an appropriate arrangement.
This is an open access article distributed in accordance with the Creative Commons Attribution Non Commercial (CC BY-NC 4.0) license, which permits others to distribute, remix, adapt, build upon this work non-commercially, and license their derivative works on different terms, provided the original work is properly cited, appropriate credit is given, any changes made indicated, and the use is non-commercial. See: http://creativecommons.org/licenses/by-nc/4.0/.
Statistics from Altmetric.com
Significance of this study
What is already known about this subject?
The minor allele of the missense variant rs373863828 in CREBRF is paradoxically associated with higher body mass index (BMI) and lower type 2 diabetes.
rs373863828 is common in Samoan and other Polynesian and Pacific populations (minor allele frequency 0.042–0.259) but rare in non-Pacific populations (minor allele frequency <0.001).
What are the new findings?
The rs373863828 minor allele has direct negative effects (lower odds of type 2 diabetes and fasting glucose) and indirect positive effects (higher odds of type 2 diabetes and fasting glucose) on type 2 diabetes risk and fasting glucose.
The indirect positive effect of the rs373863828 minor allele is mediated through a direct positive effect (higher BMI) of the rs373863828 minor allele on BMI.
Higher BMI is associated with higher odds of type 2 diabetes and fasting glucose even for those carrying the metabolically favorable rs373863828 minor allele.
How might these results change the focus of research or clinical practice?
Exploring the effect of rs373863828 on BMI, type 2 diabetes, and fasting glucose adds to the current knowledge of CREBRF and may lead to important insights into ‘favorable adiposity’, where type 2 diabetes risk is lower in minor allele homozygotes despite their higher mean BMI.
Introduction
High body mass index (BMI) is a risk factor for type 2 diabetes and elevated fasting glucose levels. While type 2 diabetes and obesity are highly correlated, there is little overlap in genetic variants associated with each phenotype.1 One genetic variant associated with both, the minor allele A of a missense variant in CREBRF (rs373863828, c.1370G>A, p.R457Q) is simultaneously associated with higher BMI (1.36 kg/m2 per copy of the A allele) and, contrary to expectations, lower the odds of type 2 diabetes (OR 0.586) and lower fasting glucose (−1.65 mg/dL per copy of the A allele) in Samoans and other Pacific Island populations.2–6 Alleles with such discrepant effects have been termed ‘favorable adiposity’ alleles.7 8 Favorable adiposity alleles like those of rs373863828 in CREBRF and variants in ADAMTS9, GRB14/COBLL1, and TCF7L21 9 could reveal avenues for the study of the variation in biological pathways underlying the relationship between BMI and type 2 diabetes. The biological mechanisms of CREBRF and its role in the development of obesity and type 2 diabetes remain largely unknown.
The association of rs373863828 with BMI, obesity, type 2 diabetes, and fasting glucose was first identified in Samoans from Samoa and American Samoa2 and has since been replicated in other Pacific populations.3–6 rs373863828 is common in Samoans (minor allele frequency (MAF)=0.259),2 Tongans (MAF=0.150),5 Pukapukans (MAF=0.243), Niueans (MAF=0.096), Cook Island Māori (MAF=0.195), New Zealand Māori (MAF=0.174),3 Native Hawaiians (MAF=0.128),6 and Pacific Island people from Guam and Saipan (MAF=0.042),4 but is very rare in non-Pacific populations (MAF <0.001).10 11
The prevalence of obesity in Polynesia is among the highest in the world, and temporal increases in obesity-related disorders such as type 2 diabetes represent a growing public health problem in the region.12 From 1978 to 2013, the prevalence of obesity (≥30 kg/m2) in men rose from 28% to 53% and in women from 45% to 78%.13 Similarly, from 1980 to 2014, the age-standardized prevalence of type 2 diabetes of Samoan men and women increased from 6.1% and 9.0%, respectively, to 22.7% and 26.6%, respectively.14
Previous work has focused on the direct associations of rs373863828 with BMI, type 2 diabetes, and fasting glucose.2–5 Here we examine, more extensively, the relationships among type 2 diabetes, fasting glucose, BMI, and rs373863828 in three samples of adult Samoans (n=2861, n=1083, and n=1013) living in Samoa and American Samoa and a sample of adult Polynesians (n=1270) of several ancestries living in Aotearoa New Zealand. This combined study (n=7127) is the largest one thus far examining the relationship between rs373863828, type 2 diabetes, and BMI.2 3 This is also the first time that path analysis has been used to explore the direct and indirect effects of rs373863828 on type 2 diabetes and fasting glucose.
Research design and methods
Participants and phenotypes
For this study, we worked with three samples of Samoan participants from Samoa and American Samoa2 15–20 from a 1990–1995 longitudinal study of cardiometabolic disease, a 2002–2003 family-based cross-sectional study of adiposity-related trait genetics, and a 2010 population-based study of cardiometabolic disease genetics, and a sample of participants of Māori and Pacific (Polynesian) ancestry from the Genetics of Gout, Diabetes and Kidney Disease in Aotearoa New Zealand Study.3
Adult participants in the longitudinal 1990–1995 study were recruited from Samoa and American Samoa. They reported Samoan ancestry and no previous diagnosis of diabetes, heart disease, or hypertension at baseline.18–20 Whole blood was collected after an overnight fast for fasting glucose measurement. Fasting glucose ≥126 mg/dL at baseline was used to define type 2 diabetes.2 18 The final sample comprised 1013 individuals with full phenotypic and genotypic data (table 1).
Sample demographic information stratified by sex and diabetes status
Participants of the cross-sectional 2002–2003 family study reported Samoan ancestry and were recruited from Samoa and American Samoa as members of families of probands selected from the longitudinal 1990–1995 study.2 16 17 Whole blood was collected after a 10-hour fast for fasting glucose measurement. Fasting glucose ≥126 mg/dL and/or a previous diabetes diagnosis was used to define type 2 diabetes.2 16 The final sample comprised 1083 adults with full phenotypic and genotypic data (table 1).
Participants in the 2010 Samoan sample were drawn from a cross-sectional population-based study of adults of reported Samoan ancestry recruited in Samoa. Details of the sample population and recruitment have been described elsewhere.2 15 In brief, whole blood samples were collected following a 10-hour fast for the fasting glucose measurement. Type 2 diabetes was defined as fasting glucose ≥126 mg/dL and/or currently taking medication to treat diabetes.2 The final sample comprised 2861 participants with full phenotypic and genotypic data (table 1).
The sample from Aotearoa New Zealand (n=2124) was recruited from 2006–2017.21 Type 2 diabetes was ascertained by physician diagnosis and/or participant reports and/or use of glucose-lowering therapy.3 Ancestry of participants was based on both self-reported New Zealand Māori and/or Pacific ancestries of their grandparents and clustering of genome-wide principal components resulting in 2124 adults of Polynesian ancestry. Fasting glucose was not measured in this study (table 1).
In all studies, height and weight were measured in duplicate and were used to calculate BMI. When classifying participants into those with and without obesity, we used the standard WHO cut-off of ≥30 kg/m2.22 Compared with people of European ancestries, people of Polynesian ancestries have a greater ratio of lean mass to fat mass at higher BMI, so a BMI threshold of >32 kg/m2 has been suggested to be more appropriate in this population than the standard WHO cut-off of ≥30 kg/m2.22 23 Our conclusions did not change when we used the Polynesian-specific BMI cut-off (online supplemental table S4).
Supplemental material
Details of the DNA extraction and genotyping for the Samoan, American Samoan, and Aotearoa New Zealand samples have been described elsewhere.2 3 Subject relatedness in the 2010 sample was measured using an empirical kinship matrix calculated with OpenMendel using genome-wide genotype data.2 24 25 In the 2002–2003 sample, expected kinship was derived from familial pedigrees with OpenMendel.24 Neither genome-wide genotype data nor pedigree information was available for participants in the 1990–1995 sample, so subjects were treated as unrelated in the statistical models. In the Aotearoa New Zealand sample, a kinship coefficient matrix was calculated from 40 156 independent autosomal markers using PLINK V.1.9.26
All participants in these studies gave written informed consent.
Statistical analysis
We explored the impact of BMI and rs373863828 on type 2 diabetes and fasting glucose in three ways: (1) regression analysis to assess the effect of rs373863828 and natural log-transformed BMI (lnBMI) on type 2 diabetes and natural log-transformed fasting glucose (lnFG) in the two obesity-stratified groups; (2) regression analysis to assess the effect of lnBMI on type 2 diabetes and lnFG within each of the three rs373863828 genotype groups; and (3) path analysis to model the effects of lnBMI and rs373863828 on type 2 diabetes and lnFG.
Except where noted, all statistical analyses were conducted using R (V.3.6.0), and a significance threshold of α<0.05 was used for all tests.27 Age and age2 were scaled and centered (cAge and cAge2) to separate the effects of the sex × age and sex × age2 interactions from the main effects. The rs373863828 genotype was coded as an additive genetic effect for the analysis in R so that it represents the number of copies (0, 1, or 2) of the minor allele, A.
Participants who reported a diabetes diagnosis—and thus were potentially being treated for the disease—were excluded from fasting glucose analyses (table 1). We did not exclude individuals with fasting glucose ≥126 mg/dL from the fasting glucose analysis if they did not report a diagnosis because they were presumed to not be part of any intervention affecting their fasting glucose levels.
Each regression model was fit using logistic mixed models for type 2 diabetes status and linear mixed models for fasting glucose (online supplemental table S1). We adjusted for kinship as a random effect using the lme4qtl package.28
Unless otherwise noted, we performed each analysis in each of the three Samoan/American Samoan samples and the Aotearoa New Zealand sample and then meta-analyzed the results together. In the regression analyses, the samples were meta-analyzed using SE—weights based on the effect sizes and heterogeneity was tested in METAL.29 In the path analyses, we pooled the raw data across the samples.
All regression models were adjusted for age and sex. The analyses in the 2002–2003 and 1990–1995 Samoan/American Samoan sample sets were also adjusted for polity (Samoa or American Samoa) to account for the many socioeconomic, cultural, and nutritional differences during these time periods between the Independent State of Samoa and the US territory of American Samoa.19 We did not adjust for polity in the single-country 2010 Samoan or Aotearoa New Zealand samples. For each regression model, we compared the effect sizes and the overlap of CIs, a conservative measure of heterogeneity, to assess whether the effects were different per stratification.30
Association of lnBMI and rs373863828 with type 2 diabetes and lnFG stratified by obesity
We stratified the samples by the WHO obesity cut-off (30 kg/m2). We examined if the effects of lnBMI and rs373863828 on type 2 diabetes differed for individuals with and without obesity by regressing type 2 diabetes on lnBMI and rs373863828 in the obesity-stratified groups. We also examined whether the effects of lnBMI and rs373863828 on fasting glucose differed by regressing lnFG on lnBMI and rs373863828 in the obesity-stratified groups.
Association of lnBMI with type 2 diabetes and lnFG stratified by rs373863828 genotype
We stratified the samples by rs373863828 genotype (GG, GA, and AA). We examined if the effect of lnBMI on type 2 diabetes differed depending on genotype group by regressing type 2 diabetes on lnBMI in each of the groups. We also examined whether the effect of lnBMI on lnFG differed by regressing lnFG on BMI in each of the genotype groups.
Modeling the effects of lnBMI and rs373863828 on type 2 diabetes and lnFG with path analysis
The relationships among sex, age, rs373863828, lnBMI, and type 2 diabetes were modeled with path analysis using the lavaan package in R.31 Interaction terms were not included in the path model and therefore variables were not centered. The path analysis consisted of two layered multiple regression analyses: the regression of lnBMI on sex, age, and rs373863828, and the regression of type 2 diabetes on lnBMI, sex, age, and rs373863828. The indirect effect of rs373863828 on type 2 diabetes as mediated by lnBMI was calculated by multiplying the path coefficient of the direct effect of rs373863828 on lnBMI by the path coefficient of the direct effect of lnBMI on type 2 diabetes. Fasting glucose was modeled using path analysis by substituting lnFG for type 2 diabetes in the above model. Relatedness was not accounted for in these models because the methods for accounting for relatedness do not exist and this may increase type I error.
In the path analysis, the absolute value of an effect size of around 0.1 is commonly considered to be small, around 0.3 is medium, and 0.5 is large.32 The direct paths of sex to type 2 diabetes and sex to lnFG had effect sizes less than 0.1 and were not part of the direct or indirect path of rs373863828 on type 2 diabetes/lnFG so they were trimmed from the models. For both type 2 diabetes and lnFG, two models were examined: with and without a dummy variable for study (2010 Samoa, 2002–2003 Samoa, 2002–2003 American Samoa, 1990–1995 Samoa, 1990–1995 American Samoa, or 2006–2013 Aotearoa New Zealand) to assess for study sample differences.
Results
Association of lnBMI and rs373863828 with type 2 diabetes and lnFG stratified by obesity
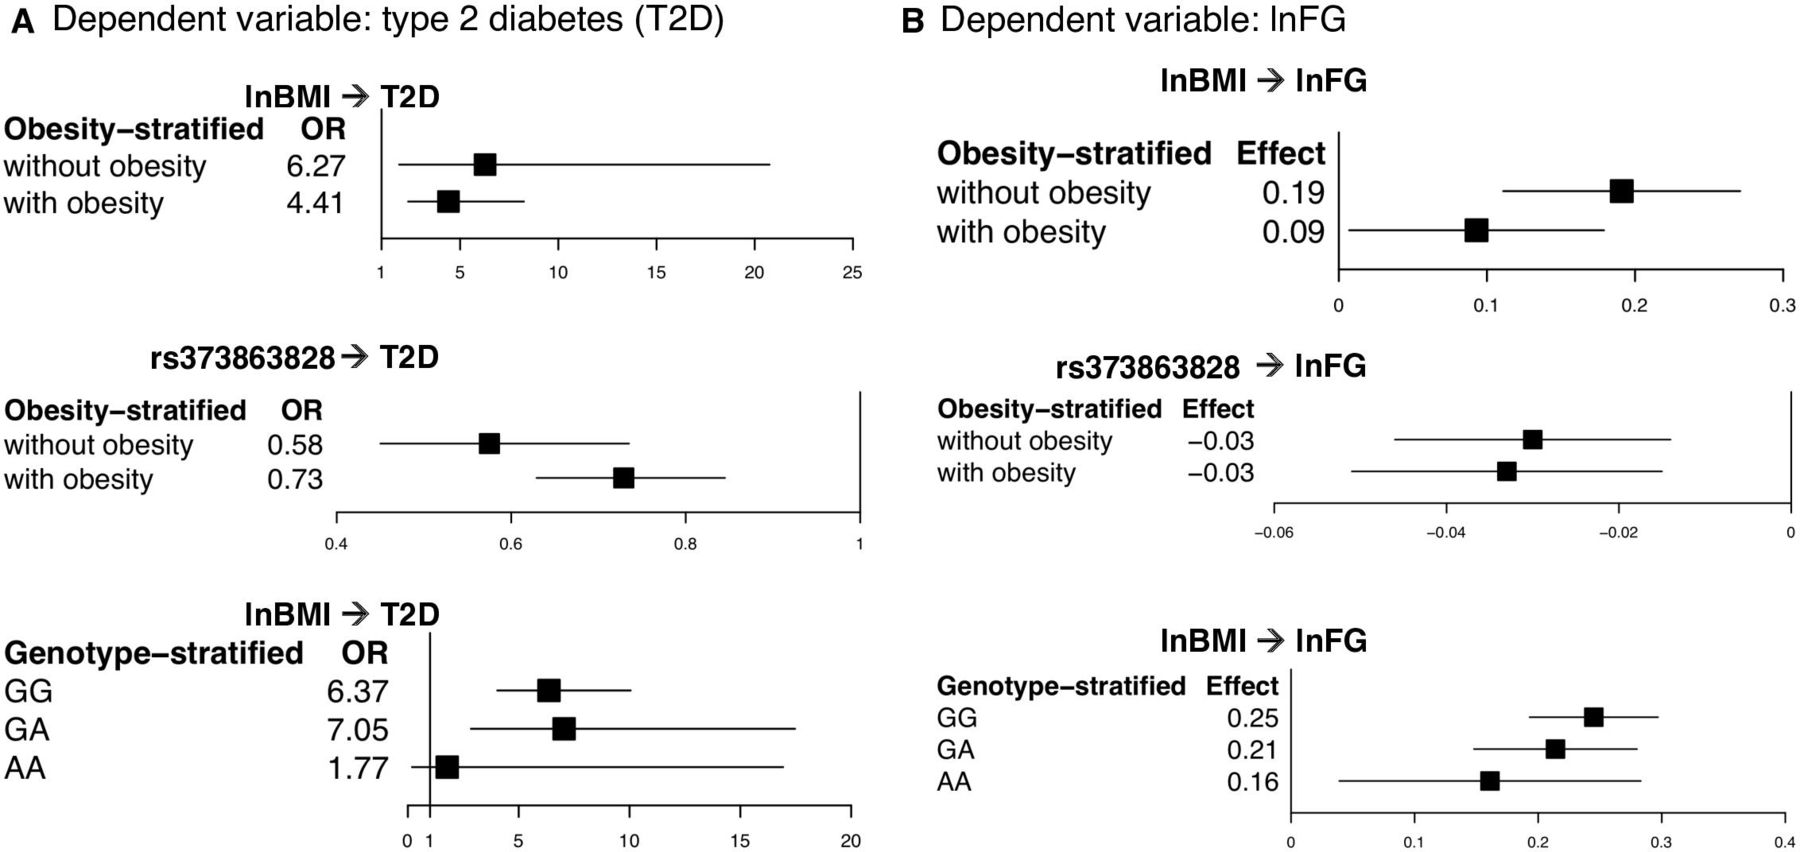
In the regression of type 2 diabetes on lnBMI and rs373863828, higher lnBMI was associated with higher odds of type 2 diabetes in participants without and with obesity (OR=7.77, p=0.015 and OR=5.01, p=1.12×10⁻⁹, respectively). lnBMI was also associated with lnFG in participants without and with obesity (β=0.213 (1.24 mg/dL higher fasting glucose with each higher unit of lnBMI), p=9.53×10⁻⁵ and β=0.162 (1.18 mg/dL higher fasting glucose), p=5.63×10⁻⁶, respectively) (figure 1 and online supplemental figure S1 and table 2). There was evidence of heterogeneity (p<0.01) between studies in the subset without obesity in the lnFG analysis (p=0.046) (online supplemental figure S1 and online supplemental table S2).
Effect of lnBMI and rs373863828 on type 2 diabetes and fasting glucose in the meta-analysis, stratified by obesity status and genotype

Comparison of the OR and effect size in the obesity and genotype-stratified groups. From the meta-analysis, (A) a comparison of the OR and 95% CI in the obesity and genotype-stratified models with type 2 diabetes as the dependent variable and (B) a comparison of the effect size and 95% CI in the obesity and genotype-stratified models with lnFG as the dependent variable. lnBMI, log-transformed body mass index; lnFG, log-transformed fasting glucose; T2D, type 2 diabetes.
On the other hand, rs373863828 was associated with lower odds of type 2 diabetes in participants both without and with obesity (OR=0.59, p=9.80×10⁻⁴ and OR=0.67, p=1.09×10⁻⁸, respectively). rs373863828 was also associated with lower lnFG in participants both without and with obesity (β=−0.036 (−0.96 mg/dL fasting glucose with each copy of the missense allele), p=4.57×10⁻⁵ and β=−0.029 (−0.97 mg/dL fasting glucose), p=1.66×10⁻⁴, respectively) (figure 1 and online supplemental figure S1 and table 2).
Association of lnBMI with type 2 diabetes and lnFG stratified by rs373863828 genotype
In the regression of type 2 diabetes on lnBMI in the genotype-stratified groups, higher lnBMI was associated with higher odds of type 2 diabetes in both the GG and GA groups (OR=6.37, p=1.88×10⁻¹⁵ and OR=7.05, p=2.46×10⁻⁵, respectively). lnBMI was not significantly associated with type 2 diabetes in the AA group (OR=1.774, p=0.619) (table 2). However, the analysis of the AA group only included participants from the 2010 Samoan sample (type 2 diabetes cases=22) because the regression models did not converge with the low numbers of type 2 diabetes cases in the AA group in the 1990–1995 and 2002–2003 Samoan samples (n=2 and n=6, respectively) and in the Aotearoa New Zealand sample (n=16) (figure 1 and online supplemental table S3). According to a post-hoc power calculation, we had 70.5% power to detect an OR of 1.774 in our AA sample with α=0.05.
In the meta-analysis of lnBMI on lnFG in the genotype-stratified groups, higher lnBMI was associated with higher lnFG in all genotype groups (GG: β=0.245 (1.28 mg/dL higher fasting glucose with each unit of lnBMI), p=3.12×10⁻²⁰; GA: β=0.214 (1.24 mg/dL higher fasting glucose), p=1.89×10⁻¹⁰; and AA: β=0.161 (1.17 mg/dL higher fasting glucose), p=0.001) (figure 1 and online supplemental table S3). In the lnFG analyses, there was evidence of heterogeneity between studies in the GG group (p=0.079) (online supplemental figure S2).
Path analysis models
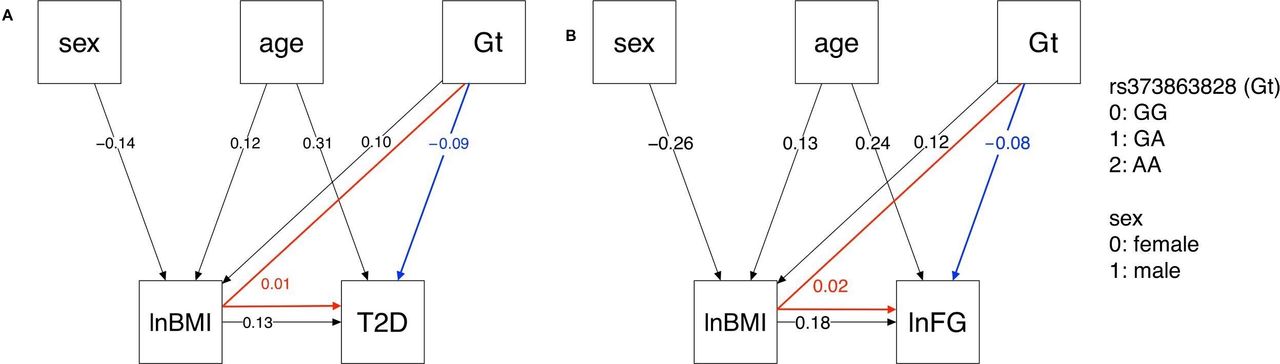
The type 2 diabetes path analysis model included five nodes: lnBMI, sex, rs373863828 genotype (subscript Gt in the following path coefficients), age, and type 2 diabetes (subscript T2D). The path pooled analyses were modeled with and without additional nodes to account for study sample (online supplemental figure S2). These models were similar, so the simpler models are presented in figure 2. In the path pooled analysis displayed in figure 2A, rs373863828 had a small direct effect on lnBMI (PlnBMI,Gt=0.10, p<0.001). rs373863828 and lnBMI had small direct effects on type 2 diabetes (PT2D,Gt=−0.09, p<0.001 and PT2D,lnBMI=0.13, p<0.001, respectively). rs373863828 also had a small indirect effect on type 2 diabetes as mediated by lnBMI (PlnBMI,Gt× PT2D,lnBMI=0.01). The root mean square error of approximation (RMSEA) was 0.011 (90% CI 0.000 to 0.035), indicating a good model fit.33
Type 2 diabetes and lnFG path analysis models. In the pooled analysis, rs373863828 genotype (Gt) has both direct (blue) and indirect (red) effects on (A) T2D and (B) lnFG as mediated by lnBMI. All direct paths shown have p<0.001. lnBMI, log-transformed body mass index; lnFG, log-transformed fasting glucose; T2D, type 2 diabetes.
The lnFG path analysis model included five nodes: lnBMI, sex, rs373863828, age, and lnFG. In the path pooled analysis (figure 2B), rs373863828 had a small direct effect on lnBMI (PlnBMI,Gt=0.12, p<0.001). rs373863828 had a small direct effect on lnFG (PlnFG,lnBMI=0.18, p<0.001). rs373863828 also had a small indirect effect on lnFG that was mediated by lnBMI (PlnBMI,Gt× PlnFG,lnBMI=0.02). RMSEA was 0.068 (90% CI 0.045 to 0.094), indicating that the path model was a mediocre fit.33
Discussion
We see here that the discordant association of rs373863828 with BMI and type 2 diabetes is consistent among individuals with and without obesity and across dietary and physical activity exposures and general nutritional environments from Samoa in 199119 to Aotearoa New Zealand in 2006–20133 34 (online supplemental tables S2 and S3). While there is evidence of heterogeneity between studies in some of the meta-analyses, this is not surprising, given the secular trends in fasting glucose and type 2 diabetes (online supplemental figure S1). These samples were recruited during different decades and from different countries, and there could be underlying differences in them arising from cohort effects, their different dietary and physical activity environments, and differences in other exposures.
There may be a stronger effect of BMI on type 2 diabetes and fasting glucose levels in Samoans without obesity than in Samoans with obesity, especially in the more recent adult samples. Temporal trends in BMI and adiposity among adolescents and young adults indicate that adults studied more recently have very likely been living with higher BMI and adiposity levels for a longer time.35 36 Adiposity earlier in life and longer exposure to it are likely to lead to more rapid temporal increases in hyperglycemia and insulin resistance as adiposity increases from normal to overweight to obesity, relative to later in the pathophysiology process.37 Note the increase in the variance of fasting glucose (table 1) from the 1990s to the later time periods.
While higher BMI is associated with higher fasting glucose across all rs373863828 genotypes, the magnitude of effect is less with each copy of the missense allele (table 2 and figure 1). However, we do not see a similar pattern in the effect of BMI on type 2 diabetes (table 2 and figure 1). Carrying the A allele does not decouple higher BMI from higher odds of type 2 diabetes. Individuals who are GG or GA or AA all have higher odds of type 2 diabetes with higher BMI, but individuals who are AA have a lower risk of type 2 diabetes than those who are GG at any given BMI (table 2 and figure 1).
In our exploration of the relationships among BMI, fasting glucose, and genotype via path analysis, we found that the rs373863828 missense variant has both a direct protective effect on type 2 diabetes and fasting glucose and an indirect opposing risk-increasing effect on type 2 diabetes odds and fasting glucose (figure 2). This indirect effect is mediated through the direct increasing effect of the rs373863828 missense variant on BMI (figure 2). Again, the rs373863828 missense allele provides some protection from type 2 diabetes, but higher BMI is associated with higher odds of type 2 diabetes regardless of rs373863828 genotype.
Little is known about the biology behind the effects of CREBRF on type 2 diabetes and BMI. There is evidence that it has multiple, tissue-specific functions. The rs373863828 minor allele is associated with greater bone and lean mass in Samoan infants at 4 months old, but it is not associated with BMI,38 suggesting that body composition may be involved in the association between rs373863828, type 2 diabetes, and BMI. Another function is indicated by the analog of CREBRF in Drosophila, which is involved in energy homeostasis,39 and along with one of its binding partners, CREBL2, it functions as a metabolic regulator linking nutrient sensor mTORC1 (mechanistic target of rapamycin complex 1) to cellular metabolic response.40 Finally, there is evidence of a role in adipose differentiation. Overexpression of CREBRF in mouse 3T3-L1 preadipocytes induces the expression of adipogenic markers and results in increased lipid accumulation, and overexpression of CREBRF:p.R457Q promotes greater lipid storage while using less energy than wild-type CREBRF.2 Our path analysis with its disparate effects adds to this body of evidence that CREBRF’s role in biology is multifarious.
While rs373863828 has disparate effects on BMI and type 2 diabetes, BMI is still an important and readily available clinical predictor of type 2 diabetes risk,41 independent of rs373863828. While this work is unlikely to impact clinical practice in the immediate future, exploring the effect of rs373863828 on BMI and type 2 diabetes adds to current knowledge of the effects of CREBRF on BMI and type 2 diabetes.
Our power to detect differences in the stratified analyses was limited by the number of individuals in each sample, in particular the low number of individuals with type 2 diabetes with two copies of the rs373863828 minor allele in the 1990–1995 Samoan, 2002–2003 Samoan, and Aotearoa New Zealand samples. Another limitation of this work is that we were not able to estimate kinship in our models for the 1990–1995 Samoan sample because we did not have genome-wide genotype data nor pedigree information. The heterogeneity between studies may also limit our power to detect associations.
Future work should include possible confounding variables such as socioeconomic status, physical activity, diet, time since diagnosis of type 2 diabetes, and more specialized measurements of fat distribution in the models. These variables were not consistently measured in every sample included in this work so they were not included in order to keep the confounding variables as unified as possible. The effect of rs373863828 on fat distribution could also be explored in future work by measuring body composition with dual-energy X-ray absorptiometry and by looking at the association between rs373863828 and other obesity-related diseases.
In summary, we provide evidence that the rs373863828 minor allele has both direct negative effects (lower odds of type 2 diabetes and fasting glucose) and indirect positive effects (higher odds of type 2 diabetes and fasting glucose). The indirect positive effects on type 2 diabetes and fasting glucose are mediated by the direct positive effect (higher BMI) of the minor allele of rs373863828 on BMI. Higher BMI is associated with higher fasting glucose and odds of type 2 diabetes. We also suggest that there may be a stronger positive association between BMI and type 2 diabetes and fasting glucose in Polynesians without obesity than in Polynesians with obesity. Finally, the A allele of rs373863828 is associated with lower odds of type 2 diabetes, but no matter the genotype higher BMI is still associated with higher odds of type 2 diabetes.
Data availability statement
Data are available in a public, open access repository. Data are available upon reasonable request. No data are available. The 2010 sample data from Samoa examined in this study are available from dbGaP (accession number: phs000914.v1.p1). The 1991–1995 and 2002–2003 sample data from Samoa and American Samoa are not available because participants did not consent to data sharing when enrolled. Sample data from Aotearoa New Zealand are not publicly available owing to consent restrictions, but can be requested from author TRM (https://orcid.org/0000-0003-0844-8726) under an appropriate arrangement.
Ethics statements
Patient consent for publication
Ethics approval
This study involves human participants. The research in Samoa and American Samoa was reviewed and approved by the institutional review boards of Miriam Hospital, Providence, Rhode Island, Brown University, University of Cincinnati, and University of Pittsburgh. Research in Samoa was also reviewed and approved by the Health Research Committee of the Samoan Ministry of Health. Research in American Samoa was additionally reviewed and approved by the American Samoa Department of Health Institutional Review Board. Ethical approval for the Aotearoa New Zealand study was given by the NZ Multi-Region Ethics Committee (MEC/05/10/130; MEC/10/09/092; MEC/11/04/036) and the Northern Y Region Health Research Ethics Committee (NPHCT study; NTY07/07/074). Participants gave informed consent to participate in the study before taking part.
Acknowledgments
We are grateful for the contributions of Melania Selu and Vaimoana Lupematisila to the recruitment of the 2010 Samoan sample. We thank the Samoan participants and local village authorities and research assistants over the years. We acknowledge the support of our research collaboration with the Samoa Ministry of Health, Samoa Bureau of Statistics, Samoan Ministry of Women, Community and Social Development, and the American Samoa Department of Health. We acknowledge the contributions of Nicola Dalbeth, Janak de Zoysa, Rinki Murphy, and Lisa Stamp to the recruitment of the Aotearoa New Zealand sample, Jennie Harré Hindmarsh to the recruitment of the Ngati Porou Hauora (NPHCT) sample included within the Aotearoa New Zealand sample, and the contributions of Ruth Topless, Amanda Phipps-Green, Marilyn Merriman, and Murray Cadzow for laboratory work and management of the New Zealand data sets.
References
Supplementary materials
Supplementary Data
This web only file has been produced by the BMJ Publishing Group from an electronic file supplied by the author(s) and has not been edited for content.
Footnotes
Contributors EMR and MK performed the analyses with guidance from RLM, DEW, JCC, and IM. EMR, JCC, and MK wrote the manuscript. NLH led the field work data collection in Samoa in 2010 and phenotype analyses with guidance from STM. STM led the fieldwork data collection in American Samoa in 1990–1994 and 2002, and in Samoa in 1991–1995 and 2003. GS and HC performed the genotyping of the Samoan samples with guidance from RD. MSR, SV, and JT facilitated fieldwork in Samoa and American Samoa. TN contributed to the discussion of the public health implications of the findings. TRM contributed to the data collection in Aotearoa New Zealand. TJM created the kinship matrix for the Aotearoa New Zealand sample. All authors contributed to this work, discussed the results, and critically reviewed and revised the manuscript. RLM is the guarantor of the work.
Funding Research in Samoa and American Samoa was funded by the National Institutes of Health (R01-HL093093, R01-HL133040, R01-AG09375, R01-HL52611, R01-DK55406, P30-ES006096, and R01-DK59642). Research in New Zealand was funded by the Health Research Council of New Zealand (08/075, 10/548, 11/1075, 14/527).
Competing interests None declared.
Provenance and peer review Not commissioned; externally peer reviewed.
Supplemental material This content has been supplied by the author(s). It has not been vetted by BMJ Publishing Group Limited (BMJ) and may not have been peer-reviewed. Any opinions or recommendations discussed are solely those of the author(s) and are not endorsed by BMJ. BMJ disclaims all liability and responsibility arising from any reliance placed on the content. Where the content includes any translated material, BMJ does not warrant the accuracy and reliability of the translations (including but not limited to local regulations, clinical guidelines, terminology, drug names and drug dosages), and is not responsible for any error and/or omissions arising from translation and adaptation or otherwise.