Article Text

Abstract
Introduction Type 2 diabetes mellitus (T2DM) is one of the most ordinary metabolic disorders and manifests as a high blood sugar level; 80%–90% of patients with T2DM will develop high blood pressure (HBP), which exacerbates irreversible organ damage. Understanding the metabolic basis of HBP is essential to facilitating early diagnosis and prompt treatments of diabetic complications.
Research design and methods 34 patients who originally had T2DM and then developed HBP within 1 year were selected from physical examination participants. Using ultrahigh-performance liquid chromatography quadrupole time-of-flight metabolomic analysis, we compared the metabolomic profile of patients with 30 healthy controls. The results showed a clear discrimination in metabolomic profiles between T2DM and T2DM+HBP when employing orthogonal projection to latent structure with discriminant analysis with electrospray ionization modes.
Results Eight differential metabolites changed significantly during disease progression, among which L-isoleucine, L-glutamic acid, pyroglutamic acid and linoleic acid decreased, while sphinganine, Cer(d18:0/16:0), Cer(d18:0/18:0), and citric acid increased. These metabolites are associated with the γ-glutamyl cycle, tricarboxylic acid cycle, and ceramide metabolism.
Conclusions These novel serum biomarkers may improve the management of T2DM and HBP complications, thus reducing the use of incorrect medical care.
- blood pressure
- diabetes mellitus
- type 2
- metabolism
Data availability statement
Data sharing not applicable as no datasets generated and/or analysed for this study. All data relevant to the study are included in the article.
This is an open access article distributed in accordance with the Creative Commons Attribution Non Commercial (CC BY-NC 4.0) license, which permits others to distribute, remix, adapt, build upon this work non-commercially, and license their derivative works on different terms, provided the original work is properly cited, appropriate credit is given, any changes made indicated, and the use is non-commercial. See: http://creativecommons.org/licenses/by-nc/4.0/.
Statistics from Altmetric.com
Significance of this study
What is already known about this subject?
An association has been reported 80%–90% of patients with type 2 diabetes mellitus (T2DM) would develop high blood pressure (HBP) in previous studies; however, the specific mechanisms of pathogenesis was unclear; we started from metabolomic analysis and analyzed the possible pathogenesis by differential metabolites.
What are the new findings?
During the development of HBP in T2DM patients, eight changed significantly metabolites have been found.
Among these metabolites, L-isoleucine, L-glutamic acid, pyroglutamic acid, and linoleic acid decreased, while sphinganine, Cer(d18:0/16:0), Cer(d18:0/18:0), and citric acid increased.
The previously mentioned metabolites were associated with tricarboxylic acid (TCA) cycle, ceramide metabolism, and γ-glutamyl cycle, and their changes may be important for the therapeutic effect of interventions for T2DM combined with HBP.
How might these results change the focus of research or clinical practice?
The results point towards several options in terms of TCA cycle, ceramide metabolism, γ-glutamyl cycle and so on, providing an idea in the possible pathogenesis of T2DM combined with HBP.
Introduction
Diabetes mellitus (DM) is a state established by insistently high levels of glucose in the blood.1 According to the WHO and the International Diabetes Federation, 366 million people were influenced by diabetes in 2011, and an approximated 3.4 million people died of high blood sugar in 2004, a number that is expected to double for the period 2005–2030.2–4 The two most general types are type 1 diabetes and type 2 diabetes. Particularly, type 2 diabetes mellitus (T2DM), as one of the most costly and devastating health problems, brought a huge financial burden on the health systems of many countries.5 Hypertension/high blood pressure (HBP) is frequent in patients with DM, as 80%–90% of patients with T2DM will develop HBP.6 HBP occurs approximately twice as frequently in individuals with T2DM as in those without T2DM.7 T2DM often progresses to combine with HBP in clinical scenarios, and these conditions strongly predispose people to irreversible organ damage as well as organ dysfunction and failure including the retina, kidneys, heart, blood vessels, and nervous system.8
Metabolomics is assured as the comprehensive quantitative and qualitative analysis of all metabolites in blood,9 and it is a non-invasive analysis of easily accessible human body fluids. Metabolomics analysis can evaluate the metabolic changes in humans on general physiological or pathological conditions.10 11 The pathogenesis of both DM and hypertension is associated with the metabolic disorders in human tissue.12 Metabolomics analysis can supply collateral evidence for an in-depth study of the small biomolecules appear in a biological sample.13 14 Combining high-resolution mass analyses with conventional Mass spectrometry (MS) provides available structural information for identifying metabolites.15 16 Recently, ultrahigh-performance liquid chromatography quadrupole time-of-flight mass spectrometry (UHPLC-Q-TOF MS) has been widely used in metabolomics studies due to its high sensitivity and reproducibility with better detection limits.17 18
In this study, a metabolomics analysis on the ground of UHPLC-Q-TOF MS was used to gain a wider understanding of the metabolic differences between T2DM and T2DM+HBP compared with HC and to predict the metabolites marking the progression from T2DM to T2DM+HBP. It is hoped that the differences in endogenous metabolites could be explored through metabolomics analysis, and the association between these metabolites and biological pathways could be used to explain disease progression to realize targeted prevention of complications.
Research design and methods
Study sample demographic data and anthropometric parameter collection
The study subjects were recruited from Hangxin Hospital, Beijing, China. In total, 4298 individuals (3062 males and 1236 females) underwent health screening at Hangxin Hospital, Beijing, China, in 2016–2018. The study protocol was in line with the Helsinki Declaration, and all serum samples were collected under institutional review board approved protocols and after obtaining the informed consent of the study patients. Routine physical examination was performed during the process of sample collection; to help find the cause of any sign or symptom, a doctor conducted a careful physical examination and asked about personal and family medical history. The participants were adults of Han ethnicity who resided in the Beijing region and did not have renal dysfunction. All of this information was recorded in a database for easy viewing.
The body mass index (BMI) was calculated as weight (kg) divided by height squared (m2). Age was also recorded in our database. DM was characterized by a fasting plasma glucose (FPG) ≥7.0 mmol/L, 2-hour postprandial plasma glucose (2 h PG) ≥11.1 mmol/L, or a history of oral hypoglycemic or insulin use based on the standard formulated by the WHO in 1999.19 Patients with T2DM were selected based on their diagnosis and medical history. According to the hypertension diagnostic standards published by WHO/International Society of Hypertension Committee in 1999, HBP was defined as systolic blood pressure (SBP) ≥140 mm Hg, diastolic blood pressure (DBP) ≥90 mm Hg, or the use of antihypertensive treatment.20 To closely follow the aims of this study and exclude the effects of age, sex, and obesity, a total of 34 age-matched, sex-matched, and BMI-matched T2DM subjects who had T2DM+HBP within 1 year were selected. Venous blood samples were taken from individuals after overnight fasting for at least 10 hours, and the serum samples were collected in a normal manner. Aliquots of serum samples were snap-frozen in liquid nitrogen and transferred to −80°C refrigerator for UHPLC-Q-TOF MS analysis.
Clinical chemistry measurements
The total cholesterol (TC), low-density lipoprotein cholesterol (LDL-C), high-density lipoprotein cholesterol (HDL-C), triglycerides (TG), aspartate transaminase (AST) and alanine aminotransferase (ALT) in the serum were measured using an automatic biochemical analyzer (Biosino Biotechnology Ltd, Beijing, China).21
Chemicals and reagents
Ultrahigh-performance liquid chromatography (UHPLC)-grade acetonitrile and methanol were purchased from Honeywell Burdick & Jackson (Muskegon, Michigan, USA, 99% purity). Deionized water was purified using the Milli-Q system (Millipore, Billerica, Massachusetts, USA). The standards used in the UHPLC-Q-TOF MS/MS analysis were purchased from Agilent (Agilent Technologies, Santa Clara, California, USA).
UHPLC-Q-TOF MS analysis
After sample processing, the UHPLC-Q-TOF MS analysis was performed using an Agilent 1290IIUHPLC system (Agilent Technologies) coupled to a 6530B quadrupole time-of-flight mass spectrometer (Agilent Technologies) with electrospray ionization (ESI) in positive and negative modes.
Data processing and data analysis
After data pretreatment, the multivariate data analysis was carried out with SIMCA (V.12.0, Umetrics, Sweden) based on normalizing serum samples volume. The original data set was divided into a training set (90%) and a test set (10%) prior before any statistical analysis. No samples in the test set were used for parameter selection. A principal component analysis (PCA) was conducted on the mean-centered data to generate an overview and check for outliers. A partial least squares-discriminant analysis (PLS-DA) and the orthogonal projection to latent structure with discriminant analysis (OPLS-DA) were subsequently performed using the unit-variance scaled data to find metabolites with significant intergroup differences.22 Using double cross-validation and permutation test, we can evaluate the accuracy of classification and regression.23 To eliminate the overfitting of supervised PLS-DA models, a cross-validation procedure and 100 random permutations testing were performed using SIMCA software. The OPLS-DA models were built with two calculated components and with sixfold cross-validation. Variable importance of projection (VIP) scores >1 were considered the most class discriminating.24 The Bonferroni correction is a safeguard against multiple tests of statistical significance by using the same data.25 After Bonferroni correction, the p value was less than 0.0167, with a significant difference.
Structural assignment of candidate biomarkers
Frist of all, in accordance with precise mass measurements and the relative intensities of the isotope peaks through high-resolution MS spectra, possible empirical formulas of the potential biomarkers were recognized. Second, the Mass Fragment application manager, a component of Marker Lynx, was applied to promote the MS fragment ion analysis process by chemically intelligent peak-matching algorithms. In brief, the MS product ion spectra of metabolites was matched with the structure messages of metabolites obtained from the human metabolome databases (HMDB) in accordance with parameters such as deviation from calculated mass, isotopic pattern, and double-bond equivalent.26 In the end, the biomarkers were defined by standard compounds on account of retention times and MS spectra.
Results
Clinical characteristics
A total of 4298 participants recruited in the study were followed for up to 3 years. Take medical history and written data from the database, according to the T2DM and HBP diagnostic criteria, the test population has been selected. Thirty-four patients whose primary disease was T2DM and who later developed HBP within 1 year were selected. At the same time, 30 age-matched and sex-matched healthy controls were also enrolled in this study as healthy controls (HCs) group. There were no significant differences in age, sex, BMI, TC, TG, LDL-C, HDL-C, ALT, or AST among the three study groups based on the Coefficient of variation in analysis of variance (CV-ANOVA) test (p>0.05). As expected, the FPG in T2DM and T2DM+HBP was higher than that in HC (p<0.05). The DBP and SBP in T2DM+HBP were higher than those in HC and T2DM (p<0.05) (table 1).
Characteristics of subjects
Optimization of UHPLC-Q-TOF MS analysis
Serum metabolites from T2DM patients and T2DM+HBP patients were analyzed with an overall approach using a nontargeted analysis method. Optimization of the chromatographic separation protocol was vital because of the high number of chromatographic peaks. The 15 min gradient method was applied for analysis of samples from the complete cohort of individuals in the end. After deleting the repeated features, 6680 spectral features of each serum sample, 783 annotated metabolites in positive electrospray ionization mode (ESI+), and 268 metabolites in negative electrospray ionization mode (ESI−) with our in-house reference standard library and HMDB were acquired. The metabolic profiles of T2DM patients, T2DM+HBP patients and HC were systemically characterized by UHPLC-Q-TOF MS, and global differences were found among these three groups using these metabolites, as shown in figure 1.
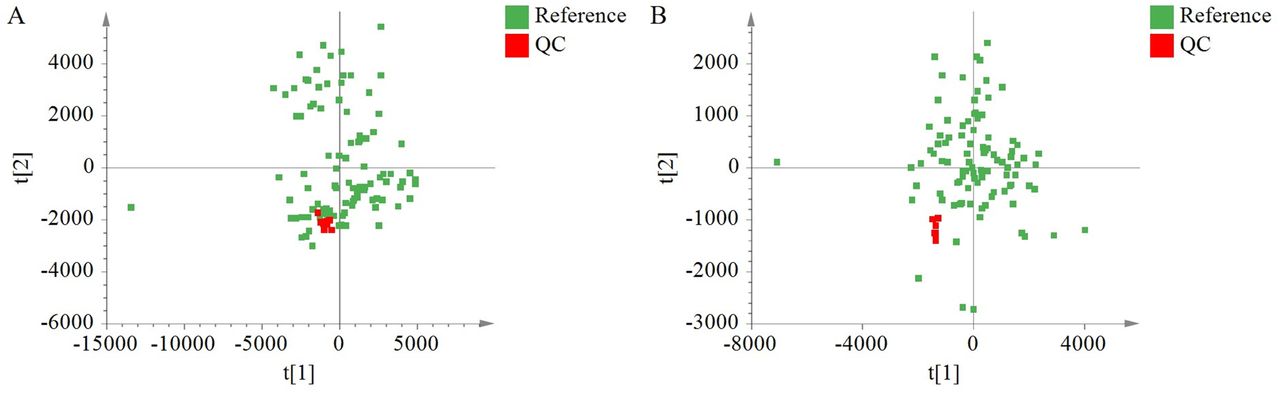
Score plots of principal components analysis models generated from the UHPLC–MS analyses of human serum displaying the biological samples and the quality control samples (QC; n=10, red). (A) Positive electrospray ionization mode (ESI+) and (B) negative electrospray ionization mode (ESI−). UHPLC–MS, ultrahigh-performance liquid chromatography mass spectrometry.
Quality control (QC)and analytical reproducibility
QC samples is generally preferred for assessing reproducibility, instrument performance and stability in metabolomics studies.27 PCA score plots can be used as a statistical strategy for evaluating analytical reproducibility and stability by representing the location of QC. Quality control of the samples in UHPLC-Q-TOF MS analysis was performed by a representative QC sample injection interval of 11 samples (n=11). The QC samples were localized in roughly the same area of the PCA score plot (figure 1). The distribution of the QC samples and the other samples emphasizes the reproducibility and instrument stability. The PCA score plot revealed intergroup metabolic differences, where each point represented a serum metabolome and the distance between data points reflected the scale of their metabolic differences. All samples were analyzed using UHPLC-Q-TOF MS in ESI+ (figure 1A) and ESI− (figure 1B).
Serum metabolic profiling and multivariate analysis based on UHPLC-Q-TOF MS/MS
Before further analysis, drugs and drug metabolites were excluded; metformin is usually perceived as a first-line drug for T2DM.28 These include agents that increase insulin release, decrease sugar absorption from the intestines, and make human body more sensitive to insulin.29 Thiazide-diuretics, ACE inhibitors, angiotensin receptor blockers, and calcium channel blockers are first choice of chemical medicines for HBP.30 As this work focuses mainly on endogenous compounds, these drugs and drug metabolites were not included in the database for statistical model. Only the metabolites that showed a p value of less than 0.05 and VIP scores of more than 1 were considered the most diagnostic class.
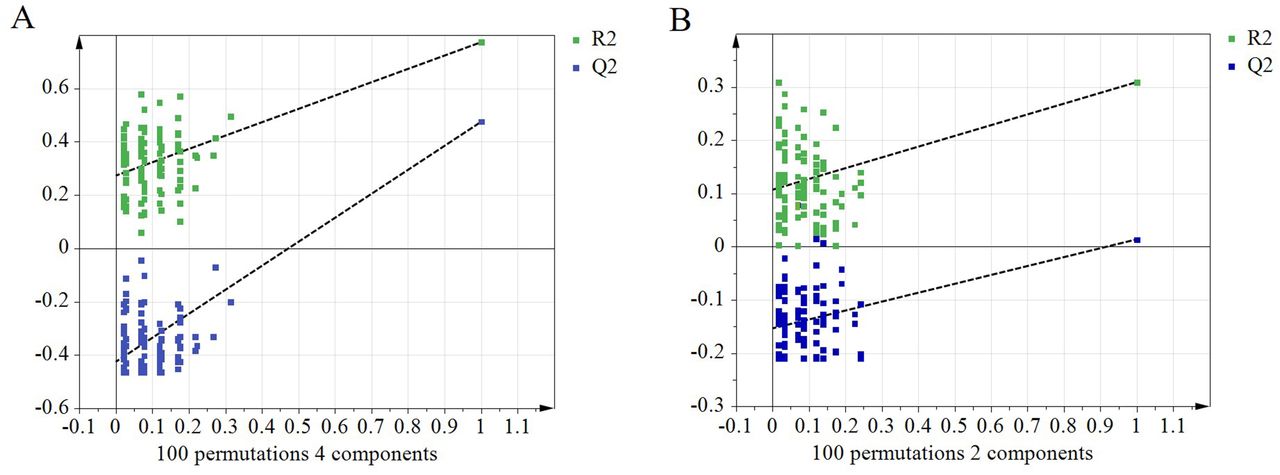
PLS-DA was performed on all three groups, namely, T2DM, T2DM+HBP and HC. As illustrated by the PLS-DA score plot (figure 2), scores t1, t2, etc, were new variables summarizing the X-variables. By a two-dimensional score plot, SIMCA drew the tolerance ellipse based on Hotelling’s T2. Observations placed far outside the ellipse were outliers. The parameters of PLS-DA models included the values of R2Y and Q2 (for the first four components, R2Y=0.721 and Q2=0.467 in ESI+; for the first two components, R2Y=0.39 and Q2=0.2 in ESI−). The permutations plot helped to evaluate the likelihood that the current PLS or PLS-DA model was bogus; that is, the model just fit the training set well but did not predict Y well for new observations. The idea of this validation was to compare the goodness of fit (R2 and Q2) of the original model with the goodness of fit of several models based on data where the order of the Y-observations had been randomly arranged while the X-matrix had been kept complete. The permutation test for PLS-DA showed that all R2Y and Q2 values to the left were lower than the original points to the right of the blue regression line of the Q2 points, which intersected the vertical axis (on the left) at or below zero (figure 3), showing that the PLS-DA model was valid. Furthermore, clinical individuals are not as stable as the data shown in animal models, and the sample size is also relatively small, also resulting in a lower Q2. The results of the permutation test show that this PLS-DA model has a good ability to explain and predict the variations in the X and Y matrices (figure 3 intercepts R2=0.0, 0.272, Q2=0.0,–0.426 in ESI+; R2=0.0, 0.107, Q2=0.0,–0.154 in ESI−).

Score plot with partial least squares-discriminant analysis (PLS-DA) of serum metabolites in type 2 diabetes mellitus (T2DM; n=34, blue), T2DM combined with high blood pressure 1 year later (T2DM+HBP; n=34, green), and healthy controls (HC; n=30, red) in ESI+ (A) and ESI− (B). For the first four components, R2Y=0.721 and Q2=0.467 in ESI+; for the first two components, R2Y=0.39 and Q2=0.2 in ESI−. ESI, electrospray ionization.

Permutation test results of the PLS-DA model in the positive (A) and negative ion modes (B). The R2Y value represents the goodness of fit of the model. The Q2 value represents the predictability of the models. All R2Y and Q2 values to the left were lower than the original points to the right of the blue regression line of the Q2 points, which intersects the vertical axis (on the left) at or below zero, showing that the PLS-DA model was valid. Permutation test plot for the PLS-DA model (number of permutations, 100; intercepts R2=0.0, 0.272, Q2=0.0,–0.426 in ESI+; R2=0.0, 0.107, Q2=0.0,–0.154 in ESI−). ESI, electrospray ionization; PLS-DA, partial least squares-discriminant analysis.
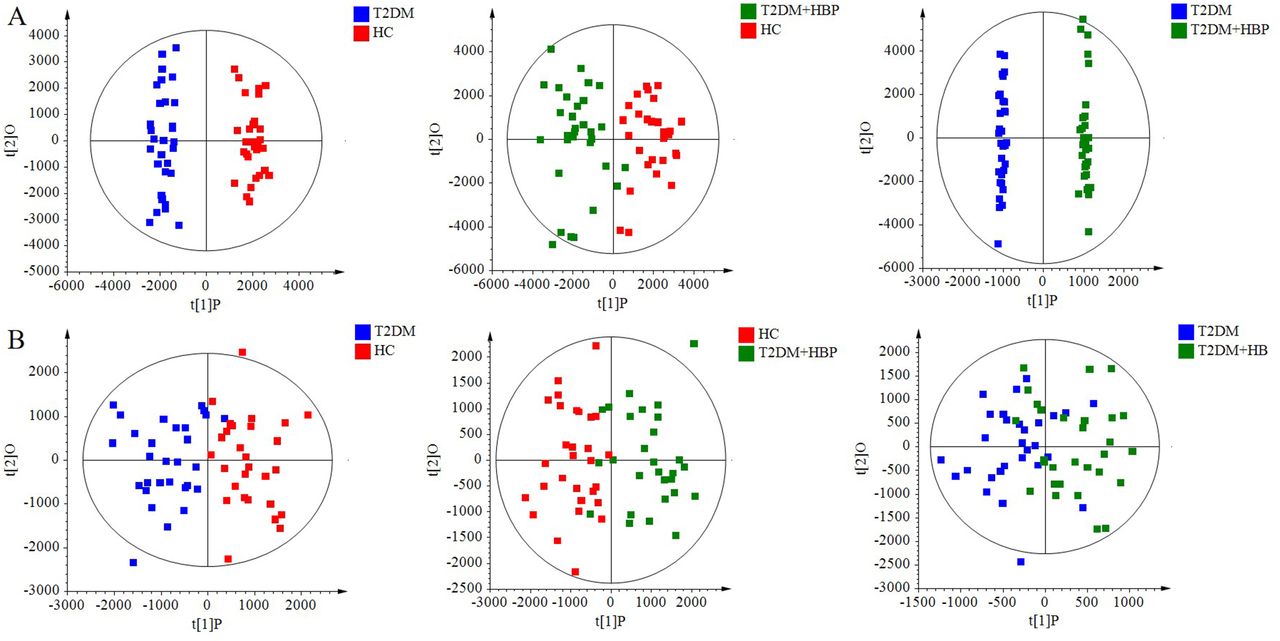
To further confirm the significant serum metabolomics differences among the three different groups, pairwise comparative OPLS-DA analyses were conducted with one orthogonal and one predictive component calculated for each of the models, as shown in figure 4. The results are demonstrated in the form of score plots. The OPLS-DA score plot indicated clear separation (with R2Y=0.964, Q2=0.834 in ESI+; R2Y=0.709, Q2=0.528 in ESI−) between the T2DM and HC, between T2DM+HBP and HC (with R2Y=0.801, Q2=0.685 in ESI+; R2Y=0.7, Q2=0.545 in ESI−), and between T2DM patients and T2DM+HBP patients (with R2Y=0.996, Q2=0.694 in ESI+; R2Y=0.435, Q2=−0.162 in ESI−). In the OPLS-DA plots, each pair of groups could be separated clearly. The high values of R2Y and Q2 showed that these models could explain and predict metabolic variations between the two groups. The parameters of the OPLS-DA models, including the values of R2Y and Q2, were >0.5, indicating these models were fit for these recognition analyses.
Scores plot of the OPLS-DA model built to discriminate between patients diagnosed with T2DM and those diagnosed with HBP. (A) ESI + and (B) ESI−. ESI, electrospray ionization; HBP, high blood pressure; HC, healthy control; OPLS-DA, orthogonal projection to latent structure with discriminant analysis; T2DM, type 2 diabetes mellitus.
Principal changes in metabolites among T2DM, T2DM+HBP and HC
According to the importance of parameter variables in the projection, the important components for separation are selected. Analysis of these data using PLS-DA and OPLS-DA revealed these three groups were associated with significant changes in several compounds in ESI+and ESI−. There were significant differences in these metabolites among the three study groups based on ANOVA (p<0.05). The Bonferroni correction was used to account for multiple hypothesis testing.25 The principal ions that changed were m/z 131.094, 147.055, 301.301, 539.529, and 567.56 in positive ion mode and m/z 129.043, 192.028, and 280.22 in negative ion mode. These eight ions eluted at 3.73, 1.11, 7.54, 10.11, 10.83, 1.55, 1.42 and 9.76 min and were identified as L-isoleucine, L-glutamic acid, sphinganine, Cer(d18:0/16:0), Cer(d18:0/18:0), pyroglutamic acid, citric acid and linoleic acid, respectively.
Discussion
Our experimental population came from a community physical examination based on bulk data files. Only 34 patients who originally had T2DM and then developed HBP within 1 year were enrolled due to strict screening criteria. A metabolomics analysis of serum from these 34 patients was conducted with an overall approach based on non-targeted UHPLC-QTOF/MS. Such an approach is also serviceable to identify the important metabolic pathways that may play important roles in the development of T2DM with HBP. Eight differential metabolites associated with amino acid, lipid and carbohydrate metabolism had specific differences between groups, as illustrated in table 2. During the development of HBP in T2DM patients, serum levels of L-isoleucine, L-glutamic acid, pyroglutamic acid, and linoleic acid decreased, while sphinganine, Cer(d18:0/16:0), Cer(d18:0/18:0), and citric acid increased. The above results may provide fresh insights into the pathophysiological mechanisms underlying the development of metabolic diseases and their complications.
Serum differential metabolites among T2DM, T2DM+HBP and HC
In this study, one of the most dramatic findings is the obvious elevation of citric acid level in T2DM and T2DM+HBP in comparison with HC. The concentration of citric acid kept increasing during the progression from T2DM to T2DM+HBP. This displays the metabolic disorders of tricarboxylic acid cycle (TCA cycle) in T2DM and T2DM+HBP groups and the severity of such disturbance increased from T2DM to T2DM+HBP. Citric acid is an intermediate in the TCA cycle and an essential donor for protein acetylation. Citrate restrains glycolysis and the TCA cycle.31 32 When these pathways are inhibited, monosaccharide conversion to TG is distributed in each organ. This event is the pathogenic mechanism of metabolic disorders in insulin resistance, metabolic syndrome and T2DM.33 Moreover, insulin resistance and insufficient insulin secretion often attenuate glycolysis and subsequently glucose elevate and citrate reduce. Insulin resistance is related with disturbed metabolism of glucose and TCA cycle.34 A study has shown that the TCA cycle continues its activation after HBP develops.35 The activation of TCA cycle leads to the accumulation of intermediate, which further inhibits the circulation process. A similar phenomenon also occurred in the variation of L-isoleucine concentration, but the trend was opposite. L-isoleucine is link with insulin resistance: higher levels of L-isoleucine have always been easily observable in the blood of diabetic mice, rats, and humans.36 37 The levels of L-isoleucine is proportional to blood glucose levels. L-isoleucine is both a glucogenic and ketogenic amino acid, which can participate in the TCA cycle. After transamination with alpha-ketoglutarate, the carbon skeleton can be transformed into either succinyl CoA and imported into the TCA cycle for oxidation or turned into oxaloacetate for gluconeogenesis. The carbon skeleton can also be transformed into acetyl CoA and imported into the TCA cycle by condensing with oxaloacetate to form citrate.38 Although no studies shown an association between L-isoleucine and blood pressure, the reduction of L-isoleucine proves that it plays a positive role in preventing the progression from T2DM to T2DM+HBP.
Of greatest concern, however, is sphinganine decreases and then increases during the T2DM patients developed with HBP. Sphingosine is the product of ceramide hydrolysis, and sphinganine is a pivotal precursor in its de novo synthesis pathway.39 Previous data suggest that increased concentrations of sphingosine and sphinganine in the blood could contribute to the deterioration in cell function in diabetes.40 So the serum sphinganine level was inversely proportional with changes in blood pressure. Lipids are the richest metabolites found in human serum. Ceramide, also called N-acylsphingosine, is one of the byproducts of the hydrolysis of sphingomyelin by the enzyme sphingomyelinase. Cer (d18:0/18:0) and Cer (d18:0/16:0) pertain directly to ceramide metabolism and their concentration increases on T2DM complicated with HBP. Despite this increase, the concentration of ceramides was still lower than HC. The ceramide signaling pathway is activated in response to myocardial ischemia/infarction.41 Sphingolipid sphingomyelin is the mother compound of the sphingomyelin transmembrane signaling pathway. Sphingomyelin is hydrolyzed to ceramide and phosphocholine by the enzyme sphingomyelinase.42 According to the experimental results, lipid metabolites increased in the course of HBP and perhaps played a possible contributor to the accelerated HBP complications in T2DM.
In addition, our research has thrown up some interesting facts, the change trend of some metabolites is opposite to that of ceramides metabolites. Linoleic acid in foods is important for human body to maintain many physiological functions such as the synthesis of phospholipids and other lipid metabolism, being capable of significantly lower the effect of serum cholesterol.43 Pyroglutamic acid can alleviate diabetes by reducing insulin resistance and lipid levels of serum and liver and by regulating the gene expression of glycolipid metabolism.44 The levels of these three metabolites were all lower than those of the HC and increased during the development of HBP. Their effect on blood pressure has not crystallized enough and which would be a focus of our future research.
Conclusions
In this study, a metabolomics strategy based on UHPLC-Q-TOF MS was established in conjunction with modern multivariate statistical techniques to find clusters of T2DM related metabolite changes. The previous metabolites were associated with TCA cycle, ceramide metabolism, and γ-glutamyl cycle and their changes reflected the differences of metabolism between HC and T2DM, who then had T2DM+HBP 1 year later. These metabolic changes may be crucial factors for future clinical diagnosis, treatment, and assessment of the therapeutic effect of interventions for T2DM combined with HBP.
Data availability statement
Data sharing not applicable as no datasets generated and/or analysed for this study. All data relevant to the study are included in the article.
Ethics statements
Patient consent for publication
Ethics approval
This study was approved by the Ethics Committee at the Institute of Basic Research in Clinical Medicine, China Academy of Chinese Medical Sciences and was conducted according to the standards of the Declaration of Helsinki. All the procedures were performed in accordance with the ethical standards of the institutional and/or national research committee and with the 1964 Declaration of Helsinki. This article does not contain any animal-based studies performed by none of the authors.
References
Footnotes
Contributors CL, JY and LL conceived the study. YZ designed the research and took full responsibility for the overall content as guarantor. YZ and HZ conducted the experiments. YZ collected clinical data. YZ and BL analyzed the data. YZ wrote the manuscript. The other authors worked together to revise the manuscript. All authors approved this submission.
Funding This research was supported by the National Key R&D Program of China (2020YFE0205100), the TCM Inheritance and innovation project of Henan province (2021-8), the National Science andTechnology Major Project (2018ZX10101001-005-003), the Fundamental Research Funds for the Central Public Welfare Research Institutes (No. Z0600), the National Natural Science Foundation of China (Nos. 81673773 and 81703949), and the Science and Technology Project of Jiangxi Provincial Department of Education (GJJ150853).
Competing interests None declared.
Provenance and peer review Not commissioned; externally peer reviewed.