Article Text

Abstract
Introduction Impaired awareness of hypoglycemia, clinically reflected by the inability to timely detect hypoglycemia, affects approximately 25% of the people with type 1 diabetes. Both altered brain lactate handling and increased cerebral blood flow (CBF) during hypoglycemia appear to be involved in the pathogenesis of impaired awareness of hypoglycemia. Here we examine the effect of lactate on CBF during hypoglycemia.
Research design and methods Nine people with type 1 diabetes and normal awareness of hypoglycemia underwent two hyperinsulinemic euglycemic-hypoglycemic (3.0 mmol/L) glucose clamps in a 3T MR system, once with sodium lactate infusion and once with sodium chloride infusion. Global and regional changes in CBF were determined using pseudocontinuous arterial spin labeling.
Results Lactate (3.3±0.6 vs 0.9±0.2 mmol/L during lactate infusion vs placebo infusion, respectively) suppressed the counter-regulatory hormone responses to hypoglycemia. Global CBF increased considerably in response to intravenous lactate infusion but did not further increase during hypoglycemia. Lactate also blunted the hypoglycemia-induced regional redistribution of CBF towards the thalamus.
Conclusions Elevated lactate levels enhance global CBF and blunt the thalamic CBF response during hypoglycemia in patients with type 1 diabetes, mimicking observations of impaired awareness of hypoglycemia. These findings suggest that alteration of CBF associated with lactate may play a role in some aspects of the development of impaired awareness of hypoglycemia.
Trial registration number NCT03730909.
- diabetes mellitus, type 1
- clinical study
- hypoglycemia
- awareness
Data availability statement
Data are available on reasonable request. The datasets generated and/or analyzed during the current study are available from the corresponding author on reasonable request. No applicable resources were generated or analyzed during the current study.
This is an open access article distributed in accordance with the Creative Commons Attribution Non Commercial (CC BY-NC 4.0) license, which permits others to distribute, remix, adapt, build upon this work non-commercially, and license their derivative works on different terms, provided the original work is properly cited, appropriate credit is given, any changes made indicated, and the use is non-commercial. See: http://creativecommons.org/licenses/by-nc/4.0/.
Statistics from Altmetric.com
Significance of this study
What is already known about this subject?
Altered brain lactate handling and increased cerebral blood flow (CBF) during hypoglycemia may be involved in the pathogenesis of impaired awareness of hypoglycemia in type 1 diabetes.
What are the new findings?
Intravenous lactate infusion increases the global CBF and blunts the hypoglycemia-induced regional redistribution of CBF towards the thalamus.
Lactate infusion enhances global CBF.
Lactate infusion blunts the thalamic CBF response during hypoglycemia in patients with type 1 diabetes.
This mimics observations of impaired awareness of hypoglycemia.
How might these results change the focus of research or clinical practice?
These results help to unravel the pathophysiology of impaired awareness of hypoglycemia; our findings suggest that local alterations of CBF associated with lactate contributes to the development of impaired awareness of hypoglycemia.
Introduction
Hypoglycemia is the most frequent adverse effect of insulin therapy in people with type 1 diabetes treated with insulin. If glucose levels drop, a hierarchically organized counter-regulatory response is initiated, which includes the release of counter-regulatory hormones and the appearance of hypoglycemic symptoms. The ventromedial hypothalamus is thought to be involved in the coordination of this sympathetic response to hypoglycemia.1 Indeed, studies using neuroimaging techniques have shown that hypoglycemia results in a redistribution of cerebral blood flow (CBF) towards the thalamic areas, as a reflection of increased brain activity in patients with type 1 diabetes and normal awareness of hypoglycemia (NAH) and in people without diabetes.2–5
About one in every four patients with type 1 diabetes is diagnosed with impaired awareness of hypoglycemia (IAH), a reduced ability to detect the onset of hypoglycemia.6 In patients with IAH, the glucose threshold for the initiation of a counter-regulatory hormone and symptom response is shifted to lower glucose levels, creating a greater risk for severe, potentially hazardous, hypoglycemia that requires help from another person for recovery.7 Results of brain imaging techniques suggest that the hypoglycemia-induced relative increase in thalamic CBF is blunted in patients with IAH, indicating that hypoglycemia fails to activate brain areas that coordinate counter-regulatory responses.4 8 9
Altered CBF response and altered brain lactate handling have both been implicated in the pathogenesis of IAH, and both are probably aimed at protecting the brain from harm induced by hypoglycemia. First, in patients with IAH, moderate hypoglycemia increases global CBF,3 a response that usually requires deeper hypoglycemia.10 11 Second, altered lactate handling of the brain may be a key process in the development of IAH.12–14 Lactate can be oxidized by the brain during hypoglycemia as an alternative fuel source when glucose supply is low. Our previous studies have indicated that both the capacity to transport lactate across the blood-brain barrier15 and that of lactate oxidation are upregulated in patients with IAH.14 The role of lactate in the development of IAH is further supported by the observation that administration of lactate diminishes symptomatic and hormonal responses to hypoglycemia,16 17 similarly to the situation seen in IAH.
It is usually assumed that the excess of lactate in the brain is only used for oxidation.18 19 However, brain lactate may also regulate cerebral perfusion to maintain brain glucose metabolism.13 As such, lactate may be involved in the upregulation of global CBF to enhance the supply of nutrients (ie, glucose) to the brain. To test this hypothesis, we examined the effect of lactate infusion during hypoglycemia on both regional CBF and global CBF, measured by magnetic resonance () techniques, in people with type 1 diabetes and NAH.
Materials and methods
This was a randomized, single-blinded, placebo-controlled crossover study that was performed at the Radboud University Medical Center in Nijmegen. The study was approved by the Institutional Review Board of the Radboud University Medical Center (online supplemental file 1) and performed according to the principles of the Declaration of Helsinki. All participants gave written informed consent before participation.
Supplemental material
Study population
Patients with type 1 diabetes and NAH were recruited from the outpatient clinic of the Radboud University Medical Center and via advertisements on online diabetes platforms. The presence of NAH was assessed by a score of 0 or 1 on the Dutch-modified translation of the Clarke Questionnaire.20 Patients with type 1 diabetes were potentially eligible for participation if they were younger than 50 years, had a body mass index below 30 kg/m2 and HbA1c levels not exceeding 9.0% (75 mmol/mol). Exclusion criteria were the use of medication other than insulin, except for oral contraceptives and stable thyroxin supplementation therapy, the presence of any other medical condition, microvascular or macrovascular complications of diabetes and MRI contraindications, such as claustrophobia or the presence of metal parts in the body. All subjects were invited for a medical screening prior to the investigational days to determine eligibility.
Study procedure
Participants underwent two hyperinsulinemic euglycemic-hypoglycemic glucose clamps, once with concomitant sodium lactate infusion (600 mmol/L) and once with saline infusion (500 mL, 0.9%) as placebo. The experimental days were separated by at least 2 weeks. In female subjects, both experiments were performed during equal phases of the menstrual cycle.
On each experimental day, subjects came to the MR research facility in the morning in fasting condition, having abstained from alcohol, smoking and caffeine containing substances for 24 hours and from strenuous exercise for 48 hours. In addition, participants received specific instructions to avoid hypoglycemic incidents the day and night before and the morning of the experimental day. Experiments were rescheduled in case of hypoglycemia (ie, glucose levels <3.0 mmol/L) in the 24 hours before the clamp.
On arrival at the MR research facility, the brachial or radial artery of the non-dominant arm was cannulated under local anesthesia (Xylocaine 2%) for frequent blood sampling. We measured arterial plasma glucose and plasma lactate levels (Biosen C-line, EKF Diagnostics) at 5-min intervals. An intravenous catheter was inserted in the antecubital vein of the contralateral arm for infusion of insulin (insulin aspart; Novo Nordisk, Bagsvaerd, Denmark), glucose 20% (Baxter, Deerfield, Illinois, USA), and sodium lactate (600 mmol/L; Spruyt Hillen, IJsselstein, the Netherlands, and prepared by the Department of Pharmacy, Radboud University Medical Center, Nijmegen, the Netherlands) or sodium chloride (500 mL, 0.9%) as placebo.
Subsequently, the participants were placed, in supine position and headfirst, in the MR scanner and a hyperinsulinemic euglycemic-hypoglycemic glucose clamp was applied. Insulin was infused at a rate of 60 mU/m2/min, and glucose 20% was infused at a variable rate, aiming for stable plasma glucose levels of ~5.0 mmol/L during the euglycemic phase and ~2.8 mmol/L during the hypoglycemic phase. After the acquisition of anatomical images, baseline CBF data and baseline blood samples (~20 min after start of the euglycemic clamp), the infusion of sodium lactate, or an equivalent volume of sodium chloride, was started. Sodium lactate infusion was started in a dose of 40 µmol/kg/min for 15 min, and then continued in a dose of 25 µmol/kg/min for the remainder of the experiment. We aimed for plasma lactate levels of 3.5 mmol/L. Subsequently, after ~25 min, plasma glucose levels were allowed to fall to 2.8 mmol/L over approximately 30 min and were maintained at that level for another 45 min.
Prior to entering the MR and at the end of the hypoglycemic phase, symptoms of hypoglycemia were assessed on a linear analog scale with a validated questionnaire.20 Patients were asked to score 18 symptoms (autonomic, neuroglycopenic, general and dummy) from 0 to 6 (none to most severe). Additional blood was sampled for the measurement of plasma insulin, pH, glucagon, catecholamines, cortisol and growth hormone at several timepoints during the euglycemic and hypoglycemic phase, as indicated in figure 1A.

(A) Schematic overview of the study protocol, (B) Arterial glucose levels during lactate infusion (red circles) and placebo infusion (black circles) and (C) arterial lactate levels during lactate infusion (red circles) and placebo infusion (black circles). CBF, cerebral blood flow.
MRI protocol
MR measurements were performed at 3T (MAGNETOM Prisma-fit; Siemens, Erlangen, Germany) using a body coil for excitation and a 12-channel head coil for signal reception. After initial acquisition of localizer images, a T1-weighted magnetization-prepared rapid acquisition with gradient-echo MRI (3D MPRAGE) was acquired at 1 mm isotropic resolution. A time-of-flight angiogram was acquired to detect the brain-feeding internal carotid and vertebral arteries for accurate positioning of the 17-mm thick ASL labeling slab. The labeling slab was positioned perpendicularly to the feeding vessels, about 7–10 cm below the anterior commissure-posterior commissure line (AC-PC line).
The perfusion images were obtained with a pseudocontinuous arterial spin labeling (pCASL) MRI research sequence (Fraunhofer Institute for Digital Medicine MEVIS, Bremen, Germany). The postlabeling delay was set to 1800 ms, the labeling duration to 1800 ms and background suppression was applied with two hyperbolic secant pulses. A three-dimensional gradient and spin echo readout module was used (Field of View (FOV): 230×173 mm; in-plane resolution: 3.6 mm2 and slices of 4.5 mm thickness; partial-Fourier factor of 7/8; turbofactor 11). Echo time was 29.56 ms and repetition time (TR) was 4800 ms. We acquired 16 pairs of label and control images per timepoint, with a scan duration of 5:22 min. Subsequently, two reference images (proton density, TR: 7000 ms), with opposing in-plane phase-encoding directions were acquired without spin labeling and without background suppression for CBF quantification and distortion correction. The acquisition of pCASL MRI data and reference images was repeated continuously (every ~7 min) while the subjects stayed in the MR system.
At the end of euglycemic phase and at the beginning of hypoglycemia, a localizer and a time-of-flight angiogram was acquired to visually detect possible subject motion. If necessary, the pCASL MRI settings were readjusted accordingly to 7–10 cm below the AC-PC line.
Analytical methods
HbA1c was measured by the TOSOH G8 HPLC-analyzer, distributed by Sysmex. Plasma insulin was assessed by an in-house radioimmunoassay.21 Plasma glucagon was measured by radioimmunoassay (Eurodiagnostica, Malmö, Sweden). Plasma epinephrine and norepinephrine were analyzed by high-performance liquid chromatography combined with fluorometric detection.22 Plasma growth hormone and cortisol were determined using a routine analysis method with Electrochemiluminescent Immunoassay on a Modular Analytics E170 (Roche Diagnostics, Mannheim, Germany). pH was measured by routine arterial blood gas analysis on the RapidPoint 500 (Siemens Nederland, Den Haag, the Netherlands).
Processing of perfusion images
Images were processed using the FMRIB Software Library (FSL, V.6.0.0)22 and Advanced Normalization Tools (ANTs (2.2.0)).23 Reference images, label and control images were motion corrected using linear affine registration (MCFLIRT24). The motion-corrected label and control images were subtracted pairwise and averaged per timepoint. A susceptibility-induced off-resonance field was estimated25 from the averaged two proton density-weighted images (acquired with opposed phase-encoding directions), which was used to correct for susceptibility distortions in the proton density as well as in perfusion-weighted images.26 The CBF maps were registered with the subject’s anatomical T1-weighted images, which in turn were registered to the MNI152 atlas (MNI152_T1_0.5mm), using linear and non-linear registration (antsRegistration). Resampling the CBF maps to the MNI152 atlas allowed a voxel-wise comparison over all timepoints. CBF was quantified voxel-wise according to the guidelines from Alsop et al.27 Global CBF values were obtained by averaging the CBF values in the gray matter.
Statistical analysis
Differences between study conditions (lactate vs placebo) were analyzed with paired Student’s t-tests or Wilcoxon signed rank tests if data were not normally distributed. The difference in global CBF between periods of euglycemia and hypoglycemia within groups was calculated and expressed relative to baseline (ie, before the start of infusion of lactate or placebo started). Mean regional CBF values of caudate, cerebellum, putamen, insula and thalamus, as well as frontal, occipital, parietal and temporal lobes were extracted using region of interests from the MNI-maxprob-thr50-2mm atlas (fslmeants). These serial data, as well as average plasma glucose levels, counter-regulatory hormone responses and symptom scores, were compared with two-way repeated measure analysis of variance with a Bonferroni post hoc test using IBM SPSS Statistics 25. All data are expressed as mean±SD. Localized changes in CBF between the two infusion conditions was assessed with a voxel-wise analysis performed together with a parametric general linear model (fsl_glm). We generated a design matrix modeling infusion condition (lactate or placebo) and glycemic state (euglycemia or hypoglycemia). In addition, we controlled with covariates for the total gray-matter CBF individual and the subjects’ intercepts to account for the repeated measurements. We tested for glycemic effects between infusion conditions. Voxel-wise statistics were corrected at a cluster level (easythreshold) and are represented as color-coded thresholded z-statistics overlaid on the MNI template (MNI152_T1_0.5mm). A p value <0.05 was considered statistically significant.
Data and resource availability
The datasets generated and/or analyzed during the current study are available from the corresponding author on reasonable request. No applicable resources were generated or analyzed during the current study.
Results
A total of 10 patients with type 1 diabetes and NAH were recruited. One patient withdrew after the first MRI because of a lack of time to plan the second MRI, two were withdrawn, one because of inability to perform arterial cannulation and the other because of insufficient quality of CBF maps. These two participants were replaced. As a result, nine participants completed the study and were analyzed. Baseline characteristics of these patients are shown in table 1.
Baseline characteristics
Arterial blood glucose levels averaged at 4.7±0.5 mmol/L vs 4.8±0.4 mmol/L during the euglycemic phase (difference −0.09 mmol/L, p=0.66) and 3.0±0.0 mmol/L vs 3.0±0.1 mmol/L (difference −0.04 mmol/L, p=0.041) during the hypoglycemic phase for lactate and placebo days, respectively (figure 1B). Baseline plasma lactate levels were similar on both experimental conditions (0.7±0.2 mmol/L vs 0.6±0.2 mmol/L, lactate vs placebo, p=0.54). Plasma lactate levels increased within 15 min after start of lactate infusion to 3.8±0.5 mmol/L (p<0.001), but did not change when sodium chloride was infused (p=0.45 vs baseline levels) (figure 1C). Insulin levels were lower on the lactate infusion day at baseline (12.2±5.3 vs 18.1±9.3 mIU/L, p=0.049), but increased during the clamp to levels similar to those obtained on the placebo day (lactate vs placebo, p=0.51). Plasma pH increased from baseline to the end of hypoglycemia, but the increase was higher during lactate than during saline infusion (+0.09±0.03 vs +0.02±0.01, p=0.001). Among the three participants for whom such data were available, Pao2 (arterial oxygen tension) levels fell during lactate infusion when compared with placebo infusion (15±0.6 vs 14.5±0.4 kPa and 14.4±0.4 vs 15.1±0.5 kPa, respectively, p for interaction=0.018), whereas PaCo2 (arterial carbon dioxide tension) levels did not differ between the 2 infusion days (p=0.55). Glucose infusion rates during hypoglycemia were not significantly different between the 2 clamp days (3.7±2.8 vs 3.5±1.2 mg/kg/min, lactate vs placebo, p=0.75).
Hypoglycemic symptoms and counter-regulatory hormone responses
Lactate infusion significantly suppressed epinephrine, norepinephrine, cortisol and growth hormone responses to hypoglycemia as compared with placebo (figure 2), while glucagon levels did not differ. The increase in total symptom scores in response to hypoglycemia was similar during infusion with lactate (from 7.5 to 26.7, p=0.002) and saline (from 7.0 to 26.1, p=0.001). This was also the case when symptoms were broken down to autonomic and neuroglycopenic scores (data not shown). Clamp order (lactate first, placebo second or the other way around) did not affect hormonal or symptom responses to hypoglycemia.

Counter-regulatory hormone levels at baseline (Bsl), during euglycemia (Eu) and during hypoglycemia, with lactate infusion (red) and placebo infusion (black), *p<0.05.
Global cerebral blood flow
Global CBF did not differ at baseline between 2 experimental days. Global CBF increased significantly during lactate infusion as compared with saline infusion (17.4%±10.3% vs −2.0±6.5%, p=0.001), but global CBF did not change further in response to hypoglycemia during either lactate (15.2%±7.3% vs 17.4%±10.3%, euglycemia vs hypoglycemia, p=0.46) or saline infusion (2.6%±9.9% vs −2.0%±6.5%, euglycemia vs hypoglycemia, p=0.16) (figure 3A,B).
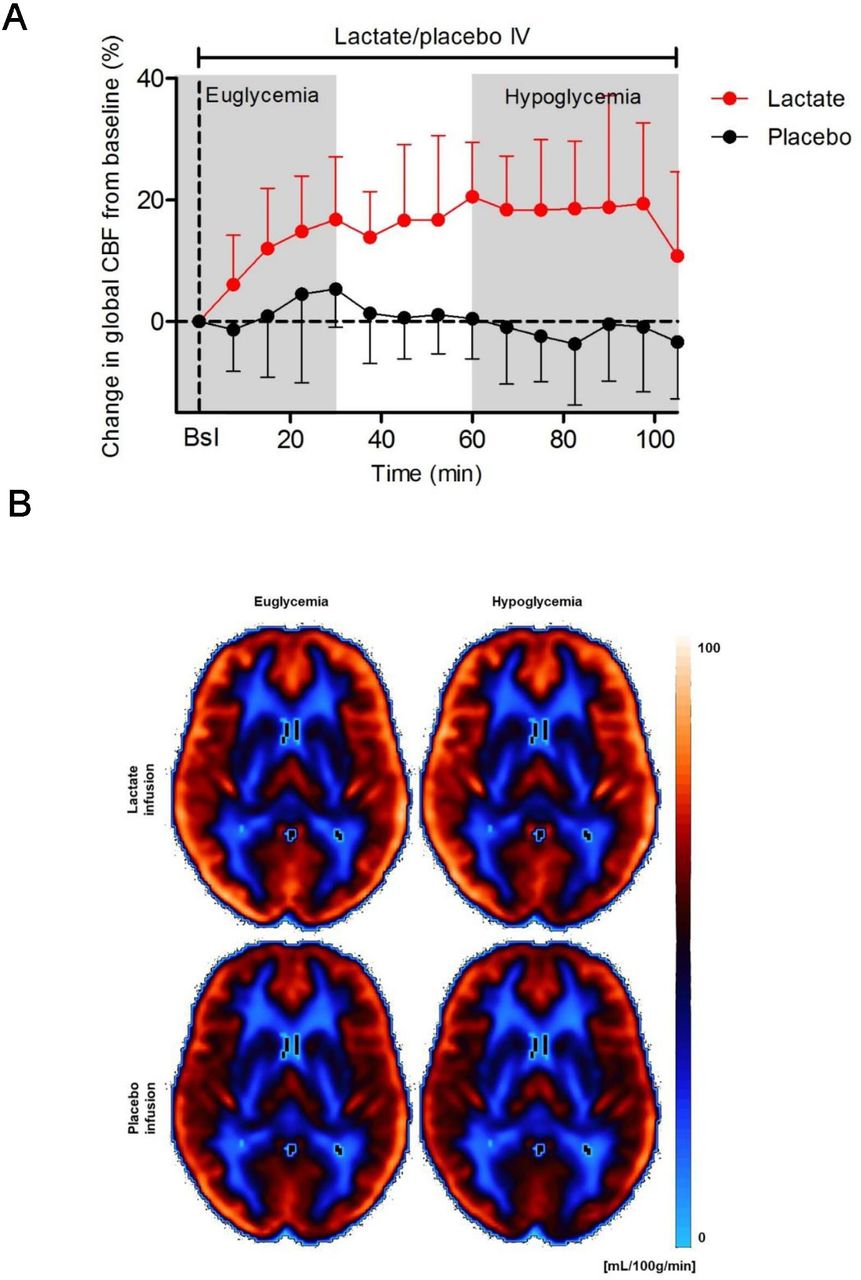
(A) Change in global cerebral blood flow (CBF) from baseline during lactate infusion (red circles) and placebo infusion (black circles). Bsl=baseline measurement; mean CBF value of three euglycemic CBF measurements without lactate/placebo infusion. (B) Quantitative CBF maps averaged over all subjects with type 1 diabetes mellitus and normal awareness of hypoglycemia during euglycemic and hypoglycemic state and during infusion of lactate and placebo. CBF values are color coded with the Flow(Brain colors) (iso) lookup table and range from 1 to 100 mL/100 g tissue/min.
Regional cerebral blood flow
To assess localized changes in CBF across the whole brain in association with glycemic state and/or infusion type, we leveraged a voxel-wise statistical analysis of the CBF maps. Because lactate infusion leads to overall elevated CBF levels (figure 3A,B) and to determine regional responses, global CBF was accounted as a covariate in our analysis. The increase in CBF in response to lactate infusion (figure 4) was specifically prominent in the posterior cingulate, precuneus and parietal cortex. Significant clusters overlap with the thalamus, denoting a decrease in regional CBF under lactate relative to placebo infusion, during hypoglycemia. These localized effects were only present when gray-matter CBF was present as a covariate, indicating that thalamic and cingulate CBF changes are only relative to the global CBF levels. Thus, in addition to elevating global CBF, lactate infusion leads to localized CBF redistribution specifically within the thalamus and cortical areas and is dependent on the glycemic status (hypoglycemia vs euglycemia).

Redistribution of cerebral blood flow (CBF) in response to hypoglycemia by type of infusion in subjects with type 1 diabetes mellitus and normal awareness of hypoglycemia. Z-scores of infusion-induced significant changes (p<0.05) in regional CBF are superimposed on the axial and sagittal views of the MNI-152 atlas and indicate a significant increase (red to yellow, 2 to 5 times SD) or decrease (dark to light blue, −2 to −5 times SD) in regional CBF in lactate relative to placebo infusion. The white underlay indicates the thalamus, and the black arrows point to the cingulate gyrus.
Discussion
This study shows that lactate infusion significantly increases global CBF, to similar extent under euglycemic and hypoglycemic conditions in people with type 1 diabetes and NAH. The regional CBF in the thalamus region is blunted during hypoglycemia while CBF in the cingulate, precuneus and parietal cortex is enhanced during infusion of lactate. Altogether these findings suggest that local alterations of CBF associated with lactate may play a role in some aspects of the development of IAH.
Previous studies have described an increase in CBF in the thalamic area in response to hypoglycemia in patients with type 1 diabetes and NAH and in healthy controls, as a reflection of stimulated brain activity that drives the autonomic response.2 3 28 This increase in thalamic CBF is reduced or absent in patients with type 1 diabetes and IAH,4 8 9 29 mirroring the reduced autonomic response to hypoglycemia in these people. Here, we used a lactate infusion to blunt the autonomic response to hypoglycemia in patients with type 1 diabetes, thus mimicking the situation seen in people with IAH. Pathogenetic involvement of thalamic blood flow is further supported by the fact that lactate infusion resulted in a similar blunting of thalamic activation during hypoglycemia. Interestingly, using [15O]water positron emission tomography, Arbelaez et al showed that antecedent hypoglycemia, a model for IAH, enhanced, rather than reduced, CBF response in the dorsal midline thalamus during subsequent hypoglycemia in healthy young adults.2 Whether this points towards different pathophysiological mechanisms underlying counter-regulatory failure or reflect differences in level of detail, neuroimaging technique used and/or study population is uncertain.
We also found an overall increase in global CBF in response to the infusion of lactate, which is in accordance with previous studies.30 For example, Stewart et al showed that infusion of a similar dose of lactate as used in the present study resulted in a comparable 20% increase in global CBF under otherwise physiological circumstances.31 The lactate-induced increase in global CBF might be caused by a shift in the NADH/NAD+ ratio and production of reactive oxygen species, making lactate a regulator of the cerebral microcirculation and thus of CBF.32 33 Previously, we found an increase of 8% in global CBF during hypoglycemia, in patients with type 1 diabetes and IAH.4 An increase in CBF could be seen as a neuroprotective response, as it enhances the supply of glucose and other energy nutrients to the brain. We speculate that the consequent maintenance of brain energy metabolism may contribute to the suppressed counter-regulatory hormone responses, symptoms of hypoglycemia and impeded hypoglycemic sensing by the brain, as seen in IAH. Similarly, the (twice as large) lactate-induced increase in global CBF may have contributed to the diminished counter-regulatory hormone responses to hypoglycemia, as seen in the current study.
It has been assumed that brain lactate functions primarily as an energy substrate and as a useful alternative for situations of glucose deprivation. Indeed, we previously showed that brain lactate levels fall in response to hypoglycemia in people with type 1 diabetes and IAH,14 probably as a result of lactate oxidation. Another study also showed increased brain transport and increased metabolism of non-glucose fuels (ie, acetate and lactate) in people with type 1 diabetes and IAH.34 Previous studies suggest that lactate also has a regulatory function with respect to brain perfusion.12 13 This may explain, at least in part, the increase in CBF during lactate infusion in our study and in turn the consequent greater capacity to transport lactate (and other energy substrates) over the blood-brain barrier, as we earlier observed in people with IAH.4 15 Whether the increase in pH contributed to the change in CBF cannot be derived from our study. However, the change was small and studies in people with traumatic brain injury show that respiratory alkalosis (through hyperventilation) reduces rather than increases CBF.35 Pao2 levels were somewhat lower during lactate infusion, which might have contributed to the increase in CBF.36 However, the clinical relevance is uncertain, since the difference with placebo was small, Pao2 levels remained within the physiological range and we were unable to measure Pao2 locally in the brain.
Our study has limitations. First, the sample size is rather small although this is typical for this type of study. Furthermore, while the hormonal response to hypoglycemia was clearly blunted on lactate infusion, surprisingly, hypoglycemic symptoms were not. Participants and personnel were blinded to the type of infusion, but participants were informed that hypoglycemia would be induced during both experimental days, although not when this would occur. However, this knowledge and the consequent expectations may have influenced the subjective reporting of symptoms. The discomfort of lying in the MR scanner may also have contributed to the experience of symptoms. Furthermore, previous studies have shown hormonal and symptom responses to hypoglycemia may not change in parallel in response to an intervention.37 Also, the difference in electrolyte concentration between the lactate and placebo solution needs to be considered, in that the sodium lactate solution is hypertonic and the sodium chloride is isotonic. Although hypertonic solutions may cause fluid shifts over the blood-brain barrier, this is unlikely to have had a major impact and since the glucose solution used for the clamp in both study arms is also hypertonic. Furthermore, saline loading has been shown to enhance rather than suppress hormonal responses (of particularly glucagon) to hypoglycemia.38 Infusion of lactate in our study increased plasma lactate to supraphysiological levels. Therefore, the effect on CBF and counter-regulatory hormones may not be comparable to the situation seen under physiological conditions. However, previous studies also administered pharmacological doses of lactate, making our results comparable to other studies. Finally, although we measured pH, Pao2 and PaCo2 in arterial blood, we did not measure other parameters that could explain the effect of lactate on CBF, such as cerebral perfusion pressure, cerebral metabolic rate of oxygen, nitric oxide, cardiac output, hematocrit or plasma electrolytes.
In conclusion, we found that lactate infusion increases global CBF and reduces the thalamic CBF response during hypoglycemia in patients with type 1 diabetes and NAH, which mimics previous findings in patients with IAH. These results strengthen the suggestion that alteration of CBF associated with lactate may play a role in some aspects of the development of IAH. Further studies are needed to explain mechanism(s) underlying this effect of lactate.
Data availability statement
Data are available on reasonable request. The datasets generated and/or analyzed during the current study are available from the corresponding author on reasonable request. No applicable resources were generated or analyzed during the current study.
Ethics statements
Patient consent for publication
Ethics approval
This study was approved by the Institutional Review Board of the Radboud University Medical Center (CMO Arnhem Nijmegen), reference no 2017-3968. All participants gave written informed consent before participation.
Acknowledgments
We are indebted to all participants for their time and willingness to participate, to the research nurses Karin Saini and Eveline Otters-van Bodegom for their help with conduction of the clamps and to Klaus Eickel from the Frauenhofer Institute (Fraunhofer MEVIS, Institute for Medical Image Computing, Bremen, Germany) for providing the pCASL research sequence.
References
Supplementary materials
Supplementary Data
This web only file has been produced by the BMJ Publishing Group from an electronic file supplied by the author(s) and has not been edited for content.
Footnotes
ECW and BEdG contributed equally.
Presented at Parts of this research have been presented at the Annual Meeting of the European Society for Magnetic Resonance in Medicine and Biology (ESMRMB) in 2019 (Rotterdam, the Netherlands) and at the Annual Dutch Diabetes Research Meeting in 2019 (Wageningen, the Netherlands).
Contributors LAvM, ECW and BEdG designed the study, with input from MvdG, CJT, AH, JJAvA and JG. LAvM recruited the participants and performed the glucose clamps. LAvM, JJAvA and ECW collected the data. ECW, JJAvA and JG analyzed the MRI data, with input from MvdG and AH. LAvM analyzed all other data, with input from BEdG and CJT. All authors discussed the results and implications and commented on the manuscript at all stages. BEdG is the guarantor of this work.
Funding The research was financially supported by the European Foundation for the Study of Diabetes.
Competing interests None declared.
Provenance and peer review Not commissioned; externally peer reviewed.
Supplemental material This content has been supplied by the author(s). It has not been vetted by BMJ Publishing Group Limited (BMJ) and may not have been peer-reviewed. Any opinions or recommendations discussed are solely those of the author(s) and are not endorsed by BMJ. BMJ disclaims all liability and responsibility arising from any reliance placed on the content. Where the content includes any translated material, BMJ does not warrant the accuracy and reliability of the translations (including but not limited to local regulations, clinical guidelines, terminology, drug names and drug dosages), and is not responsible for any error and/or omissions arising from translation and adaptation or otherwise.