Article Text

Abstract
Introduction Since the ratio of creatinine to cystatin C (Cre/CysC) can reflect muscle volume, it has been proven to be a predictor of sarcopenia in patients with or without diabetes. Here, we investigated the predictive value of Cre/CysC for the skeletal muscle composition and its correlations with glucose disposal ability and diabetic complications in patients with type 2 diabetes.
Research design and methods The skeletal muscle index (SMI) and mean skeletal muscle attenuation (MMA) values of 193 patients with type 2 diabetes were obtained through analyses of CT images at the lumbar 3 level.
Results Serum Cre/CysC was significantly correlated with both the SMI (r=0.375, p<0.001) and MMA (r=0.378, p<0.001). Multiple stepwise linear regression analysis demonstrated that Cre/CysC was the only biochemical predictor of the SMI (β=0.48 (95% CI 0.02 to 0.94)) and MMA (β=0.57 (95% CI 0.14 to 1.01)). Furthermore, the fat mass index (FMI) was significantly associated with the MMA (r=−0.481, p<0.001) but not the SMI (r=0.101, p=0.164). In the diabetic complications analysis, Cre/CysC was significantly lower in patients with cardiovascular disease (95% CI (−1.47 to –0.22), p=0.008) and lower extremity arterial disease (95% CI (−1.44 to –0.29), p=0.004). Moreover, in the 100 g steamed bun test, Cre/CysC was significantly correlated with glucose levels at 60 min (r=−0.162, p=0.045), 120 min (r=−0.287, p<0.001) and 180 min (r=−0.313, p<0.001).
Conclusions Cre/CysC may be a valuable predictor of skeletal muscle composition in type 2 diabetes. Patients with a higher Cre/CysC may have a better ability to dispose of postprandial glucose and are at a lower risk of macrovascular disease.
- type 2 diabetes
- diabetes complications
- nutritional sciences
- muscle weakness
Data availability statement
Data sharing not applicable as no datasets generated and/or analyzed for this study. The datasets generated and analysed during the current study are not publicly available but are available from the corresponding author on reasonable request.
This is an open access article distributed in accordance with the Creative Commons Attribution Non Commercial (CC BY-NC 4.0) license, which permits others to distribute, remix, adapt, build upon this work non-commercially, and license their derivative works on different terms, provided the original work is properly cited, appropriate credit is given, any changes made indicated, and the use is non-commercial. See: http://creativecommons.org/licenses/by-nc/4.0/.
Statistics from Altmetric.com
Significance of this study
What is already known about this subject?
The ratio of creatinine to cystatin C (Cre/CysC) can reflect muscle mass and has been proven to be a predictor of sarcopenia. However, patients with type 2 diabetes mainly present reduced muscle performance and strength, which correlates with lower muscle density.
What are the new findings?
Cre/CysC was an independent predictor of both muscle mass and muscle density in patients with type 2 diabetes.
Cre/CysC was significantly lower in patients with cardiovascular disease and lower extremity arterial disease.
Cre/CysC was negatively correlated with the level of postprandial glucose.
How might these results change the focus of research or clinical practice?
This study suggests that patients with type 2 diabetes with higher Cre/CysC values may have better muscle compositions and abilities to dispose of postprandial glucose and lower risks of macrovascular disease.
Background
Type 2 diabetes mellitus is a group of metabolic disorders characterized by hyperglycemia due to impaired insulin secretion and increased insulin resistance.1 In addition to common diabetic complications, vasculopathy and the accumulation of advanced glycation end-products can impair muscle mass and function, leading to sarcopenia.2 A recent systematic review including 1832 patients with type 2 diabetes and 4694 euglycemic subjects demonstrated that patients with type 2 diabetes have a higher risk of sarcopenia (OR: 1.55 (95% CI 1.25 to 1.91)). Considering its heavy impact on quality of life and increased risk of fracture, disability and mortality, sarcopenia is emerging as a third category of diabetic complication.3 4
Sarcopenia is defined as the presence of both low muscle mass and reduced muscle function (strength or performance).5 Several imaging modalities can be used to assess muscle mass and achieve the diagnosis of sarcopenia.5 6 Among these methods, magnetic resonance and CT are considered gold standards for the non-invasive assessment of muscle mass.7 In addition to muscle volume, CT can also assess muscle density because increased fat infiltration into muscle results in lower CT attenuation; in other words, higher CT attenuation indicates higher muscle density.8 However, in addition to the high cost, the equipment is not immediately accessible in primary care, and radiological technicians are required to operate it.
The ratio of creatinine to cystatin C (Cre/CysC) was first reported as a surrogate marker of muscle mass in 2013.9 On this basis, Cre/CysC has been proven to be an accurate and inexpensive predictor of sarcopenia in patients with chronic obstructive pulmonary disease, non-dialysis chronic kidney disease and diabetes.10–12 However, unlike other diseases, patients with type 2 diabetes mainly present reduced muscle performance and strength, which correlate with muscle density, but have no difference in muscle mass.13 14 A recent study showed that individuals with lower CT attenuation are associated with a higher risk of incident diabetes mellitus.15 Additionally, the muscles of obese subjects with diabetes mellitus show significantly lower CT attenuation than those of obese subjects with normal glucose tolerance.16 These studies indicated that muscle density plays an important role in the occurrence and development of diabetes. In the present study, we hypothesize that in addition to muscle mass, the Cre/CysC ratio can predict muscle density in patients with type 2 diabetes. Both muscle mass and muscle density were evaluated by CT scans. Considering that skeletal muscle is the main consumer of glucose as well as the association between sarcopenia and diabetic complications, we also evaluated the correlation of Cre/CysC with glucose disposal ability and diabetic complications.
Methods
Study patients
Type 2 diabetes patients hospitalized in the Department of Endocrinology, Affiliated Hospital of Jining Medical University, between January 2017 and December 2020 who underwent CT scans including the center plane of the third lumbar vertebra on axial images and had blood analyses determining creatinine and cystatin C levels were included in this study. The exclusion criteria were as follows: (1) patients missing anthropometric measures such as height and weight; (2) patients with malignant tumours, abnormal thyroid function, or stage V diabetic nephropathy; and (3) patients who were receiving hemodialysis or immunosuppressive drugs. Due to the retrospective nature of the study and the anonymity of the data, the requirement for informed consent was waived.
Laboratory measurements and complications assessment
All biochemical and immune indexes were measured at our hospital laboratory. Creatinine (mg/dL) was measured by the sarcosine oxidase method (Diacegene, Sichuan, China), and cystatin C was measured with a particle-enhanced turbidimetric assay (Zybio, Chongqing, China). The Cre/CysC ratio was calculated by dividing serum creatinine (mg/L) by serum cystatin C (mg/L). Patients underwent a 100 g steamed bun test, which is generally used as a simulation test to observe postprandial changes in blood glucose, islet function, and other biochemical indicators17 18 when they had good glucose control after intensive insulin therapy. Diabetic complications were assessed systematically according to the guidelines for the prevention and control of type 2 diabetes in China.19 20 The method of the 100 g steamed bun test and the diagnostic criteria for diabetic complications are shown in the online supplemental material.
Supplemental material
Body composition measurements
Two authors identified axial CT images at the L3 level in which the spinous process and the two transverse processes could be visualized. Image analysis included the skeletal muscle index (SMI), mean skeletal muscle attenuation (MMA) and fat mass index (FMI). Slice-O-Matic software (V.5.0, TomoVision, Montreal, Quebec, Canada) was used for image analysis by setting attenuation thresholds from −29 to 150 Hounsfield units (HU) for skeletal muscle, −150 to −30 HU for visceral adipose tissue and −190 to −30 HU for intramuscular/subcutaneous adipose tissue.21 Each type of tissue found in each L3 CT image was then shaded with a different colour, corresponding to these thresholds. Data outputs for the area in cm2 and the CT attenuation of each tissue type in each CT image were collected and used to calculate the SMI, MMA and FMI. The SMI, reflecting muscle mass, was calculated by normalizing the L3 cross-sectional skeletal muscle area in cm2 by height in m2.21 22 The MMA, reflecting muscle density, was shown as the CT attenuation of L3 cross-sectional skeletal muscle in HU and automatically calculated by the software.22 The FMI was first proposed by VanItallie et al as an indicator of nutritional status and calculated by normalizing fat mass in kg by height in m2.21 23 24
Statistical analysis
Continuous variables are summarized using the median and IQR if not normally distributed and the mean±SD if normally distributed. Categorical variables are summarized as the frequency count and per cent. These variables between the two groups were compared by an independent samples t-test or the Mann-Whitney U test. Categorical variables were analyzed by the χ2 test. Univariable correlations between variables were assessed by Pearson’s correlation coefficients. Multiple stepwise linear regression analysis was used to identify independent factors. Statistical analysis was performed using SPSS software (V.26.0). A p value less than 0.05 was considered statistically significant.
Results
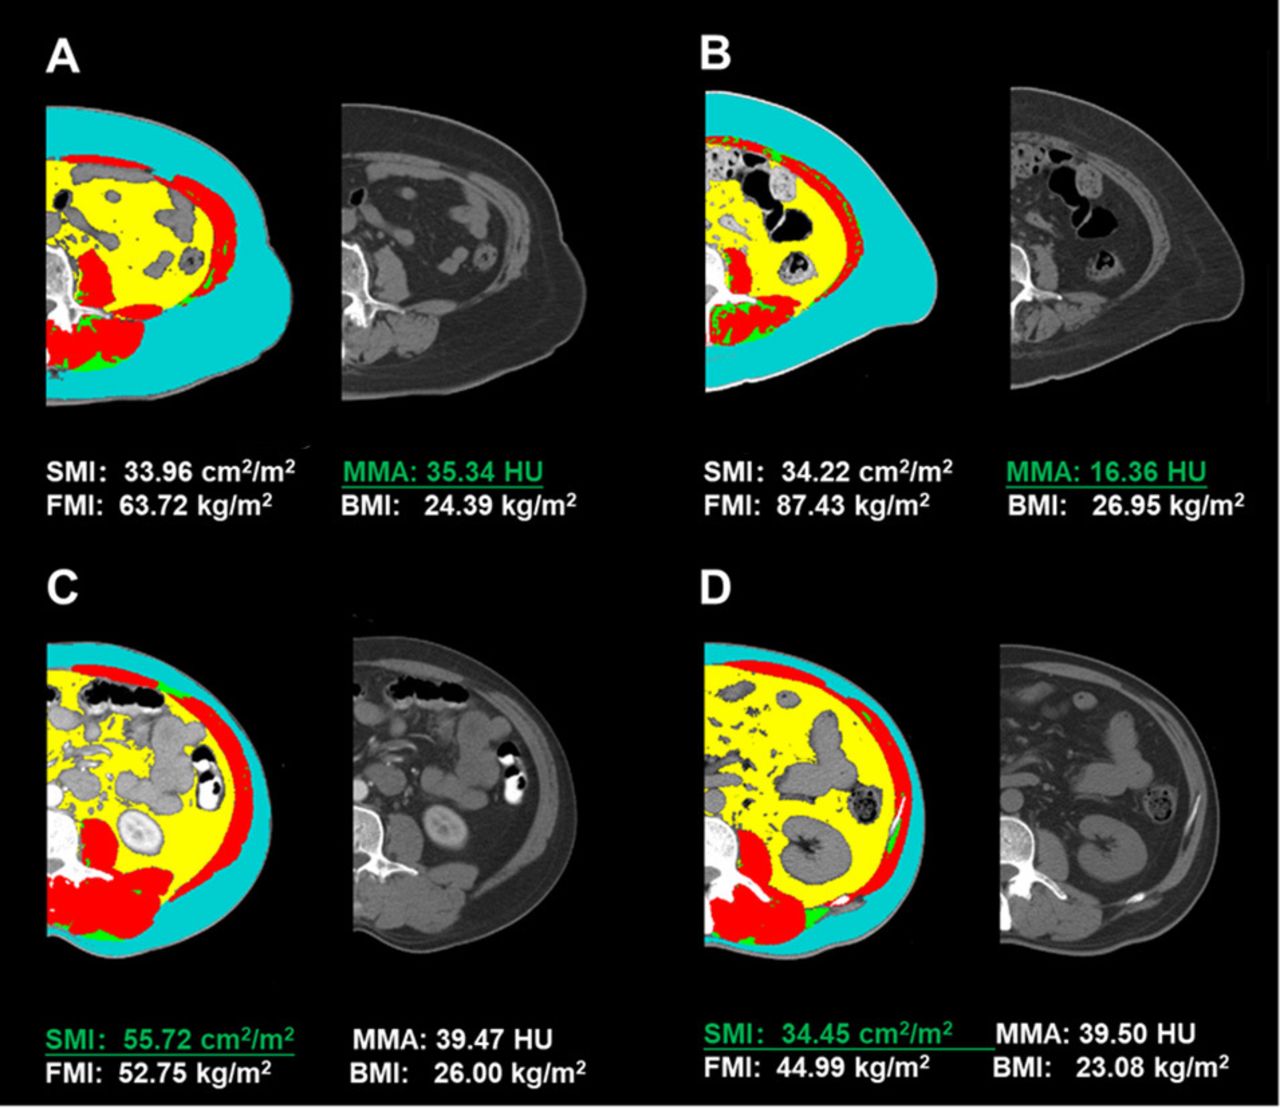
A total of 254 diabetic patients with axial CT images at the L3 level were found in the hospital management system. After screening the discharge diagnosis, patient state and biochemical information, 193 type 2 diabetes patients were included in the present study (see online supplemental figure 1). The SMI and MMA evaluated skeletal composition from different angles. Patients with similar muscle masses may have different muscle densities. As shown in figure 1, patient A had a similar SMI to patient B but a much higher MMA. In addition, patients with similar muscle densities may have different muscle masses. As shown in the same figure, patient C had a similar MMA to patient D but a much higher SMI.

CT image analysis at the lumbar 3 level using Slice-O-Matic software. Red: muscle; blue: subcutaneous adipose tissue; yellow: visceral adipose tissue; green: intermuscular adipose tissue; grey: unprocessed CT image. BMI, body mass index; FMI, fat mass index; MMA, mean skeletal muscle attenuation; SMI, skeletal muscle index.
Patient characteristics
The patient characteristics are presented in table 1. A total of 114 male patients and 79 female patients with a mean age of 55.45 years were enrolled in this study. Male patients had higher serum creatinine levels, Cre/CysC ratios, and SMI and MMA values than female patients.
Characteristics of patients included in this study
Correlations of the SMI and MMA with clinical factors
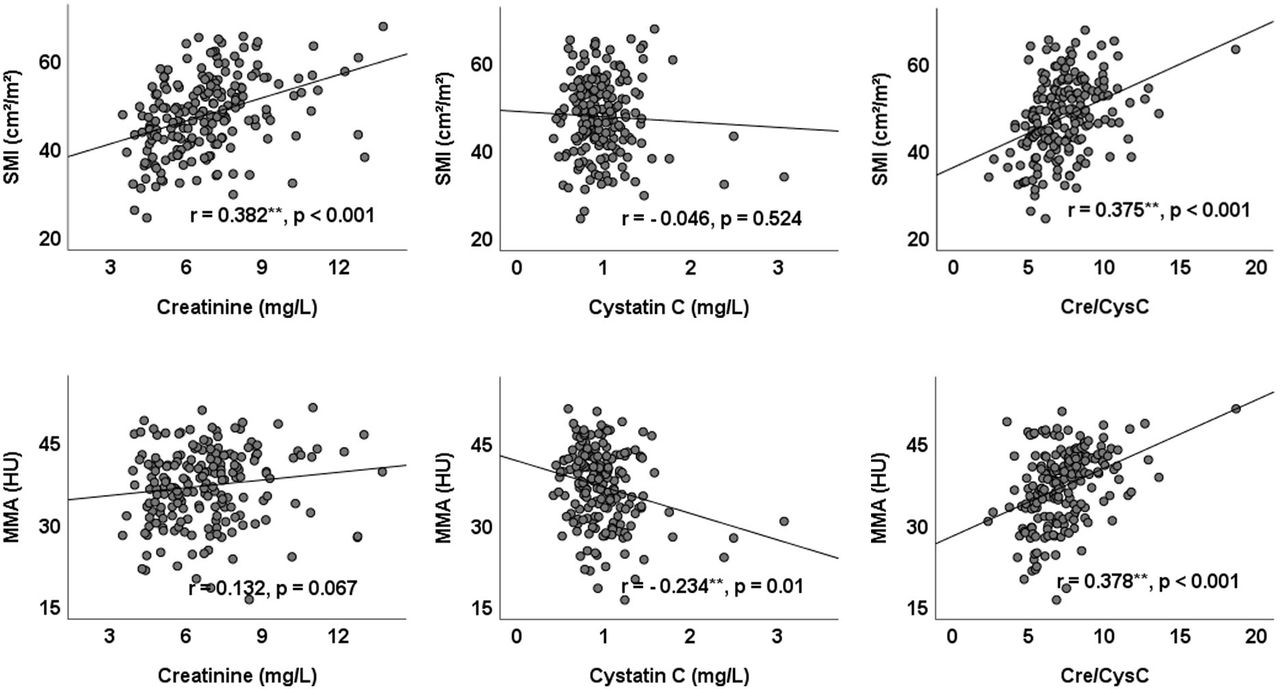
The correlations between the SMI and MMA and clinical factors are shown in online supplemental table 1. Both the SMI and MMA were significantly associated with the Cre/CysC ratio (SMI: r=0.375, p<0.001; MMA: r=0.378, p<0.001). Serum creatinine was associated with the SMI (r=0.382, p<0.001) but was not associated with the MMA (r=0.132, p=0.067). Serum cystatin was not associated with the SMI (r=−0.046, p=0.524) but was associated with MMA (r=−0.234, p=0.010). The scatter diagram of serum creatinine and cystatin C and their ratio with the SMI and MMA are shown in figure 2. Notably, the BMI and waist–hip ratio (WHR) were positively correlated with the SMI (BMI: r=0.505, p<0.001; WHR: r=0.286, p<0.001) but negatively correlated with the MMA (BMI: r=−0.178, p=0.013; WHR: r=−0.149, p=0.045). Furthermore, the FMI was significantly associated with the MMA (r=−0.481, p<0.001) but not with the SMI (r=0.101, p=0.164). Multiple stepwise linear regression analyses of variables related to the SMI and MMA are listed in table 2. After adjusting for confounding factors, Cre/CysC was the only biochemical predictor of the SMI (β=0.48, (95% CI 0.02 to 0.94)) and MMA (β=0.57 (95% CI 0.14 to 1.01)).
Multiple stepwise linear regression analysis of factors associated with the SMI and MMA
Scatter diagram of creatinine and cystatin C and their ratio Cre/CysC with the SMI and MMA. Cre/CysC, creatinine to cystatin C ratio; SMI, skeletal muscle index; MMA, mean skeletal muscle attenuation.
Since sex has a significant impact on the SMI and MMA, subgroup analyses were performed in the correlation (online supplemental table 1) and multiple stepwise linear regression (online supplemental table 2) analyses. The Cre/CysC ratio was significantly associated with both the SMI and MMA in males (SMI: r=0.234, p=0.012; MMA: r=0.337, p<0.001) and only significantly associated with the MMA in females (r=0.223, p=0.048). In the multiple stepwise linear regression analyses, Cre/CysC was an independent predictor of the MMA in males (β=0.60 (95% CI 0.11 to 1.09)).
Correlation of Cre/CysC with diabetic complications, glucose and C peptide
Considering the predictive value of Cre/CysC in muscle composition, its correlation with diabetic complications, glucose and C peptide was further evaluated. The details are listed in table 3. In the diabetic complications analysis, Cre/CysC was significantly lower in patients with cardiovascular disease (95% CI (−1.47 to –0.22), p=0.008) and lower extremity arterial disease (95% CI (−1.44 to –0.29), p=0.004). Moreover, in the 100 g steamed bun test, Cre/CysC was significantly correlated with glucose levels at 60 min (r=−0.162, p=0.045), 120 min (r=−0.287, p<0.001) and 180 min (r=−0.313, p<0.001). Multiple stepwise linear regression analyses of diabetic complications and glucose were further performed (the details are listed in online supplemental table 3). After adjusting for confounding factors, Cre/CysC was an independent predictor of the glucose level at 120 min (β=−0.23 (95% CI −0.41 to −0.05)) and 180 min (β = −0.31 (95% CI −0.51 to −0.11)).
Correlation of Cre/CysC with diabetic complications, glucose and C peptide
Discussion
Creatinine originates from skeletal muscle and is affected by renal function, while cystatin C, which is another serum marker of renal function, is a cysteine proteinase inhibitor that functions as a housekeeping protein excreted by all nucleated cells.25–27 Therefore, the ratio of Cre/CysC corrected for renal function can reflect the total muscle volume in the body. However, muscle function, another key diagnostic element of sarcopenia, is correlated with muscle density rather than muscle size. Moreover, patients with diabetes mainly present with reduced muscle performance and strength. To date, no study has evaluated the predictive value of Cre/CysC for muscle density.
This study first reported that Cre/CysC is an independent predictor of both the SMI and MMA. The predictive function of Cre/CysC for the MMA may be one of the main principles of Cre/CysC predicting sarcopenia in patients with type 2 diabetes. This result is also consistent with a previous study showing that Cre/CysC predicts muscle strength in patients with non-dialysis requiring chronic kidney disease.12 Moreover, both the SMI and MMA are independent predictors of the outcome in critically ill patients.22 Therefore, Cre/CysC has also been proven to be a predictor of outcomes in patients treated in the ICU.28 29 Based on the above evidence, Cre/CysC could be regarded as a more comprehensive indicator of skeletal muscle composition and thereby predict sarcopenia, muscle strength and the outcome of patients with critical illness.
In the subgroup analysis, Cre/CysC ratio was not significantly associated with SMI in females and was not an independent predictor for SMI in males and SMI and MMA in females. However, a tendency of positive correlation between Cre/CysC and SMI emerged in females in spite of without significance. The predicting abilities of Cre/CysC in different genders may be also concealed by the small patients’ number, especially in females. Therefore, large sample studies are required to further clarify the predictive value of Cre/CysC for muscle composition in different genders.
In addition to Cre/CysC, anthropometric characteristics, including sex, age and BMI, are independent predictors of the SMI and MMA. It is easy to understand that SMI and MMA values are higher in male patients than in female patients and decrease gradually with increasing age. Since overnutrition and lack of physical exercise are major inducers of type two diabetes, obesity, dyslipidemia and abnormal fat distribution are common comorbidities in these patients. This study indicated that BMI and WHR are positively correlated with the SMI but negatively correlated with MMA. Moreover, the FMI was negatively correlated with the MMA, even on controlling for the factor of age (r=−0.428, p<0.01). These results further demonstrated the adverse impact of obesity and fat tissue infiltration on muscle density.
Considering that skeletal muscle is the main consumer of glucose and the main target of insulin activity,30 this study further evaluated the correlation between Cre/CysC and the 100 g steamed bun test results. Our research showed that Cre/CysC is negatively correlated with postprandial blood glucose but has no correlation with C peptide release. Multiple stepwise linear regression analyses further demonstrated that Cre/CysC was an independent predictor of glucose at 120 min and 180 min. Interestingly, unlike the SMI, Cre/CysC did not show a correlation with homeostasis model assessment (HOMA2) indexes. The possible reason is that Cre/CysC is a comprehensive marker reflecting the SMI but also the MMA. Moreover, both creatinine and cystatin C showed correlations with these indexes in the same direction (positive or negative); therefore, the association of their ratio with HOMA2 indexes was partially counteracted. Nevertheless, these results indicate that patients with high levels of Cre/CysC may have better postprandial glucose disposal abilities, even though they showed no differences in pancreatic function and insulin sensitivity. The present study did not show a correlation between Cre/CysC and hemoglobin A1C (HbA1c), which is consistent with previous epidemiological studies showing that HbA1c is not associated with sarcopenia in individuals with type 2 diabetes.3 However, a relationship between glucose control and sarcopenia cannot be completely excluded. Our study indicates that postprandial glucose disposal ability may decrease in type 2 diabetes patients with sarcopenia.
There are some indications that low muscle mass and reduced function could be associated with diabetic complications.3 The present study has shown that Cre/CysC is negatively correlated with macrovascular diseases, including cardiovascular disease and lower extremity arterial disease, and this might be attributed to the impact of cystatin C. This study also showed that cystatin C is positively correlated with cardiovascular disease and lower extremity arterial disease (r=0.211, p=0.003 and r=0.164, p=0.023, respectively; data not shown). This is consistent with previous clinical studies indicating that cystatin C is positively associated with heart and peripheral arterial disease.31–35 Studies have also indicated that cystatin C increases in human obesity and is positively associated with body fat mass.36–38 However, in mechanistic studies, cystatin C was severely reduced in atherosclerotic lesions, and the absence of cystatin C resulted in larger plaque areas and increased obesity-associated adipose tissue inflammation and dysfunction.39–41 Therefore, cystatin C appears to be a protective factor that is stimulated to slow the progression of atherosclerosis and fat infiltration.
In adults, the normal range of cystatin C is 0.51–0.98 mg/L, which is independent of sex and age.42 The normal range of creatinine for males is 0.6–1.2 mg/dL, and for females, it is 0.5–1.1 mg/dL.43 Therefore, the ratio of Cre/CysC should be near 10. Some studies provided Cre/CysC values near 1 or 100 because they calculated the Cre/CysC ratio with different formulas, including Cre/CysC ratio=[(serum creatinine {mg/dl}/serum cystatin C {mg/l})×100] or (serum creatinine {mg/dl}/serum cystatin C {mg/l}).10–12 44–46 With more attention given to the ratio of Cre/CysC, a recognized and accepted formula should be proposed by an official institute.
Our study has some limitations. First, the Cre/CysC should be regarded as a supplementary indicator in predicting SMI and MMA because of the relative small coefficient r values and wide CIs. Second, the predicting abilities of Cre/CysC for muscle compositions in different genders need further clarification. Third, we did not assess muscle function (eg, handgrip strength and gait speed), which has recently been advised by the European Working Group on Sarcopenia in Older People as one of the referred criteria for severe sarcopenia.14 Fourth, as this was a retrospective study, we did not repeatedly assess the muscle composition and Cre/CysC; therefore, the predictive value of changes in Cre/CysC for muscle composition over time is unknown. Finally, this is a single-center study with a small sample population and large sample studies are needed to validate the findings in the present study and to verify the prognostic value of Cre/CysC for diabetic complications.
Conclusions
In conclusion, the present study indicated that the ratio of Cre/CysC may be a valuable predictor of skeletal muscle composition in type 2 diabetes. Additionally, patients with a higher Cre/CysC may have a better ability to dispose of postprandial glucose and are at a lower risk of macrovascular disease.
Data availability statement
Data sharing not applicable as no datasets generated and/or analyzed for this study. The datasets generated and analysed during the current study are not publicly available but are available from the corresponding author on reasonable request.
Ethics statements
Patient consent for publication
Ethics approval
This study was approved by the Ethics Committee of the Affiliated Hospital of Jining Medical University (No. 2021C041).
References
Supplementary materials
Supplementary Data
This web only file has been produced by the BMJ Publishing Group from an electronic file supplied by the author(s) and has not been edited for content.
Footnotes
QY and MZ contributed equally.
Contributors The manuscript was conceived by QY and FL, with manuscript questions and analytic plan designed by QY, MZ, BB and FL. FL wrote the manuscript, interpreted the data, critically reviewed and revised the manuscript. QY, MZ and BB contributed to writing, data analysis, data interpretation, critical review and revision. PS, YL, HX, KW and HS contributed to data interpretation, critical review and revision. All authors had access to the data and all authors agreed to submit the final manuscript. FL was supported by the doctoral founding. QY and FL are the guarantors of this work and as such had full access to all the data in the study and take responsibility for the integrity of the data and the accuracy of the data analysis.
Funding The study was supported by the Doctoral Foundation of the Affiliated Hospital of Jining Medical University (2020-BS-008).
Competing interests None declared.
Provenance and peer review Not commissioned; externally peer reviewed.
Supplemental material This content has been supplied by the author(s). It has not been vetted by BMJ Publishing Group Limited (BMJ) and may not have been peer-reviewed. Any opinions or recommendations discussed are solely those of the author(s) and are not endorsed by BMJ. BMJ disclaims all liability and responsibility arising from any reliance placed on the content. Where the content includes any translated material, BMJ does not warrant the accuracy and reliability of the translations (including but not limited to local regulations, clinical guidelines, terminology, drug names and drug dosages), and is not responsible for any error and/or omissions arising from translation and adaptation or otherwise.