Article Text

Abstract
Introduction Inadequate glycemic control among patients with type 2 diabetes mellitus (T2DM) poses an enormous challenge. Whether this uncontrolled T2DM population is a heterogenous mix of disease subtypes remains unknown. Identification of these subtypes would result in a customized T2DM management protocol thereby paving the way toward personalized therapy.
Research design and methods Electronic health records of 339 patients with uncontrolled T2DM patients followed up for a median period of 14 months were analyzed using Uniform Manifold Approximation and Projection followed by density-based spatial clustering of applications with noise. Baseline clinical features and final diagnoses with drug combinations were selected in the analysis. A 30 min oral glucose tolerance test was next performed for assessing the underlying insulin resistance and β cell dysfunction.
Results Three major clusters were identified. The first cluster characterized by recent onset T2DM had moderately preserved β cell function. The second cluster with a longer duration of T2DM and associated hypertension showed the best glycemic control with dual antidiabetic therapy. The third cluster with the longest history of T2DM and no history of hypertension had the worst glycemic control in spite of the highest percentage of patients on triple therapy (34.58%) and quadruple therapy (8.41%).
Conclusions Uncontrolled T2DM comprises a heterogeneous population with respect to disease duration, presence of co-morbidities and β cell function without significant difference in insulin resistance. Stratifying them on the basis of pathoclinical features is the first step toward a personalized management in T2DM.
- type 2 diabetes
- body mass index
- India
Data availability statement
Data are available on reasonable request. The dataset generated during the current study will be available on request from the corresponding authors. The following code used in the study is publicly available in the github repository - https://github.com/mra/clustering-workflow.
This is an open access article distributed in accordance with the Creative Commons Attribution Non Commercial (CC BY-NC 4.0) license, which permits others to distribute, remix, adapt, build upon this work non-commercially, and license their derivative works on different terms, provided the original work is properly cited, appropriate credit is given, any changes made indicated, and the use is non-commercial. See: http://creativecommons.org/licenses/by-nc/4.0/.
Statistics from Altmetric.com
Significance of this study
What is already known about this subject?
Type 2 diabetes mellitus (T2DM) is a heterogenous mix of disease subtypes. However, the guideline for T2DM management remains uniform for all patients. Inadequate glycemic control among a great majority of patients with T2DM calls for subtype identification in uncontrolled T2DM.
What are the new findings?
Unsupervised clustering was applied on the clinical data of 339 patients with uncontrolled T2DM followed up for a median period of 14 months.
Three clusters were obtained based on age, T2DM duration, comorbidity and β cell dysfunction. The cluster with obesity, hypertension and late age of T2DM onset showed the best control with dual antidiabetic therapy.
Interestingly, the cluster with the longest T2DM history without associated hypertension showed the worst glycemic control in spite of receiving triple therapy (34.58%) and quadruple therapy (8.41%).
How might these results change the focus of research or clinical practice?
Presence of pathoclinical clusters among patients with uncontrolled T2DM raises the need of a subtype specific antidiabetic therapy to achieve adequate glycemic control. Hence, patients with uncontrolled T2DM need to be stratified before starting personalized therapy.
Introduction
Type 2 diabetes mellitus (T2DM) has been considered as a homogeneous disease entity for long where insulin resistance (IR) is the primary pathology followed by eventual β cell dysfunction.1 However, recent studies report T2DM to be a heterogeneous mix of different pathological conditions with the contribution of IR and β cell dysfunction varying among T2DM subtypes.2 3 Precise determination of this underlying pathology is of prime importance as we look forward to entering the era of personalized medicine for management of diabetes.4–7
Adequate glycemic control is important to prevent diabetic complications namely retinopathy, nephropathy, neuropathy and other end organ damage. Despite the rapidly increasing diabetic population across the entire globe,8 inadequate glycemic control still poses an enormous challenge to the healthcare delivery system,8–11 especially in the low-income and middle-income countries, thereby contributing to an increase in prevalence of diabetic complications. In 2019, The Investigation of Glycosylated Haemoglobin on Therapy in Indian diabetics study conducted in India reported over 75% of the T2DM population to have inadequate glycemic control with a glycated hemoglobin (HbA1c) level over 7%.11 However, whether this uncontrolled T2DM population is a heterogenous mix of disease subtypes still remains unknown. Heterogeneity among the uncontrolled T2DM population challenges the efficacy of a uniform treatment protocol12 13 recommended for all patients with T2DM.
Hence, the aim of this study was to investigate whether the uncontrolled T2DM population is a heterogenous mix of disease subtypes and to further identify the pathoclinical features underlying the heterogeneity. Identification of patient subtypes among uncontrolled T2DM would result in a more customized T2DM management protocol thereby paving the way toward personalized therapy.
Research design and methods
Data source and collection
Anonymized electronic health records from March 2016 to December 2020 were collected from a community based primary health clinic located in the district of North 24 Parganas of West Bengal, India. The clinic is run as a vertical of the community-based metabolic health screening program ‘From Food to Nutrition Security’14 with a focus on rendering clinical services in non-communicable diseases including T2DM, hypertension, ischemic heart disease (IHD), dyslipidemia, etc. A detailed clinical history of each patient including present illness, history of past illness, family history, operative history, personal history, menstrual and pregnancy history, allergy history and past investigations are recorded during the first visit. Enrolled patients are then regularly followed up, and examination data (height, weight, pulse and blood pressure), investigation data (blood and imaging investigations) and management data (preventive advice and drugs with dosage) are entered into the digital database during each visit.
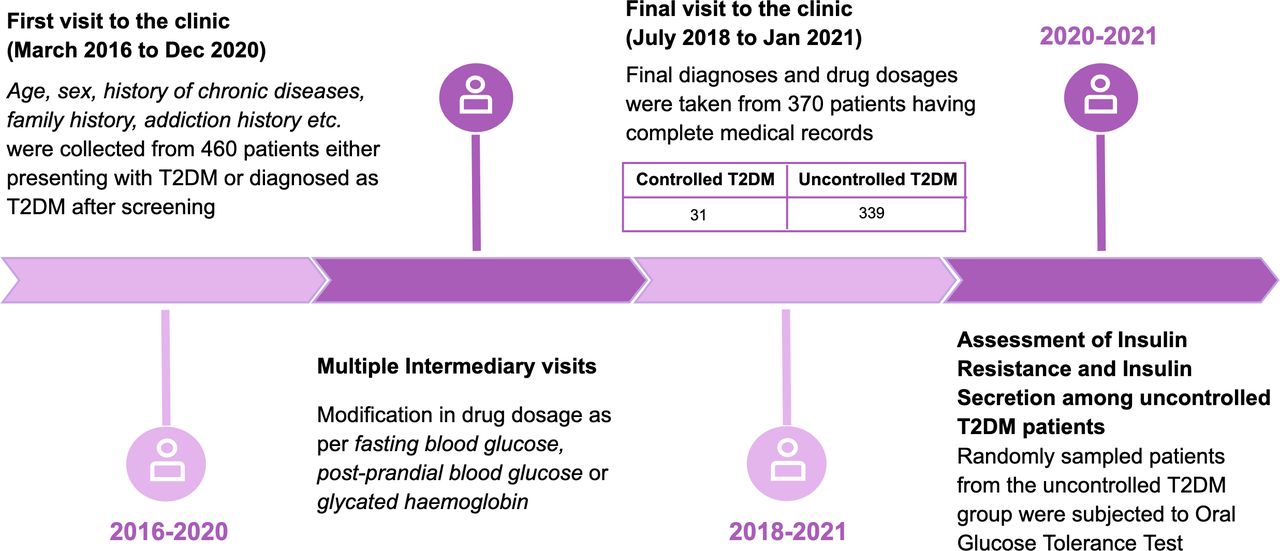
Four hundred and sixty patients with T2DM either presenting with a known history of T2DM or diagnosed as T2DM during screening were initially selected among whom 370 patients were followed up regularly and had complete medical records. During the last visit, these patients were screened for glycemic control out of which 339 patients were found to have uncontrolled T2DM (diagnosed by fasting plasma glucose over 126 mg/dL, postprandial plasma glucose over 180 mg/dL or HbA1c) over 7%. Data of these 339 patients were taken for clustering. The study design with the timeline is represented in figure 1.

Study design. Timeline diagram of the prospective study design of type 2 diabetes mellitus (T2DM). Patients were recruited from the primary health clinic.
For all the patients with T2DM, antidiabetic drugs were modified by a clinician following the American Diabetic Association guideline.13 The antihypertensive drug dosage for those diagnosed with hypertension was modified according to the measured blood pressure value during each visit. Comorbidities like dyslipidemia and IHD were also managed. For management of all these comorbid conditions, the American Diabetic Association Standard of Medical Care in Diabetes 2016 was followed. All the features from the first clinic visit combined with the diagnoses (including all the comorbid conditions) and drug combinations from the final visit were used in the final analysis. A total of 339 patients with uncontrolled T2DM followed up for a median duration of 14 months (25th percentile: 7 months, 75th percentile: 24 months) were used in this study.
Data preparation
Both continuous and categorical variables were present in the dataset. The continuous variables in the dataset were age, duration of known hypertension (in months) and known T2DM (in months), systolic and diastolic blood pressure, body mass index (BMI) and body fat percentage. The categorical variables were sex, education, occupation (shopkeepers, farmers and homemaker), diseases (IHD, dyslipidemia, hypertension and hypothyroid) and prescribed drugs (metformin, glimepiride, amlodipine, etc), family history of diabetes and hypertension. The dosage of a particular drug was added up and combined to a single column to calculate total intake of the drug. For example, if a patient was taking ‘Glimepiride (2) 1-0-1/2 tab AC’, then the dosage of 3 mg was added under the column glimepiride. BMI was calculated from the height and weight of each patient (kg/m2) and included as a feature. The body fat percentage was calculated using the formula developed by Gallagher et al.15
Identification of clusters using dimensionality reduction techniques followed by density-based spatial clustering of applications with noise (DBSCAN)
Dimensionality reduction was applied first on the data followed by clustering. This strategy was used because the performance of clustering algorithms can degrade in the presence of a large number of input features. Several dimensionality reduction algorithms, principal component analysis (PCA), t-distributed stochastic neighbor embedding (t-SNE) and Uniform Manifold Approximation and Projection (UMAP) were used for this purpose.16 The dimensionality reduction technique with the best silhouette score was finally accepted. After the data were visualized in lower dimension and reasonable patterns were observed, the non-parametric clustering algorithm, DBSCAN was applied to this dimensionally reduced data. Number of clusters need not be specified explicitly in DBSCAN as it finds non-linear structures based on density, which may be of arbitrary size and shape.
Assessment of IR and β cell dysfunction among clusters
Oral glucose tolerance test (OGTT) was done in 100 randomly selected patients from the obtained clusters. Blood samples were collected at fasting and 30 min after intake of 75 g of anhydrous glucose dissolved in 200 mL of water. Only those patients who were available during the final period of 2020–2021 were recruited for the OGTT. All the patients gave proper informed consent. homeostasis model assessment-estimated insulin resistance (HOMA-IR),17 Insulinogenic Index and Matsuda Index18 were reported as indices of IR, HOMA beta-cell function (HOMA-B)17 and disposition index (DI)19 were reported as indices of β cell dysfunction. Plasma was used for glucose measurement using the glucose oxidase method with reagents from Randox Laboratories Ltd (County Antrim, UK). Plasma insulin level was measured by ELISA (Merck Millipore, Massachusetts, USA).
Statistical analysis
The continuous features are summarized as mean with SE and the categorical features as count with percentage contribution for all the clusters separately. The postclustering features for all the clusters obtained from OGTT are summarized as mean with SE. Comparison among the clusters was done using analysis of variance. Variables with non-normal distribution were log transformed before comparison.
Results
Cluster identification using UMAP
UMAP outperformed all the other dimensionality reduction techniques in the given dataset shown by comparing the silhouette score obtained after performing DBSCAN. On applying PCA and DBSCAN (epsilon, eps=0.08), the silhouette score was 0.42, whereas for t-SNE with DBSCAN (eps=4), it was 0.28 (online supplemental figure 1). Application of UMAP on the entire dataset did not yield any well-defined clusters. However, application of UMAP separately on continuous and categorical features followed by DBSCAN yielded well-defined clusters. In the later strategy, the UMAP algorithm was applied to continuous and categorical variables separately to reduce their overpowering effect. It was applied on the continuous variables with the Euclidean metric (min_dist=0.05), the most commonly used measure, which is the square-root of the sum of the squared differences between the pair of points. The Canberra metric (min_dist=0.1) was used for categorical variables where the distance between pairs of points in a vector space that in a way sort the points into groups that are more closely or distantly related to each other.16 Both are represented in two dimensions. Finally, UMAP was again applied on the four dimensional reduced representation of the dataset using the Euclidean metric (min_dist=0.005) to obtain two dimensional reduced representation of whole data (online supplemental figure 2). The entire clustering workflow is detailed in figure 2. DBSCAN algorithm (eps=1.3) was performed on this UMAP reduced data, and three main clusters are obtained with a silhouette score of 0.74. Once the clusters were obtained (assigned as C1, C2 and C3), the clinical features were summarized next for each cluster (table 1).
Supplemental material
The postclustering subject characteristics of the uncontrolled T2DM subgroups
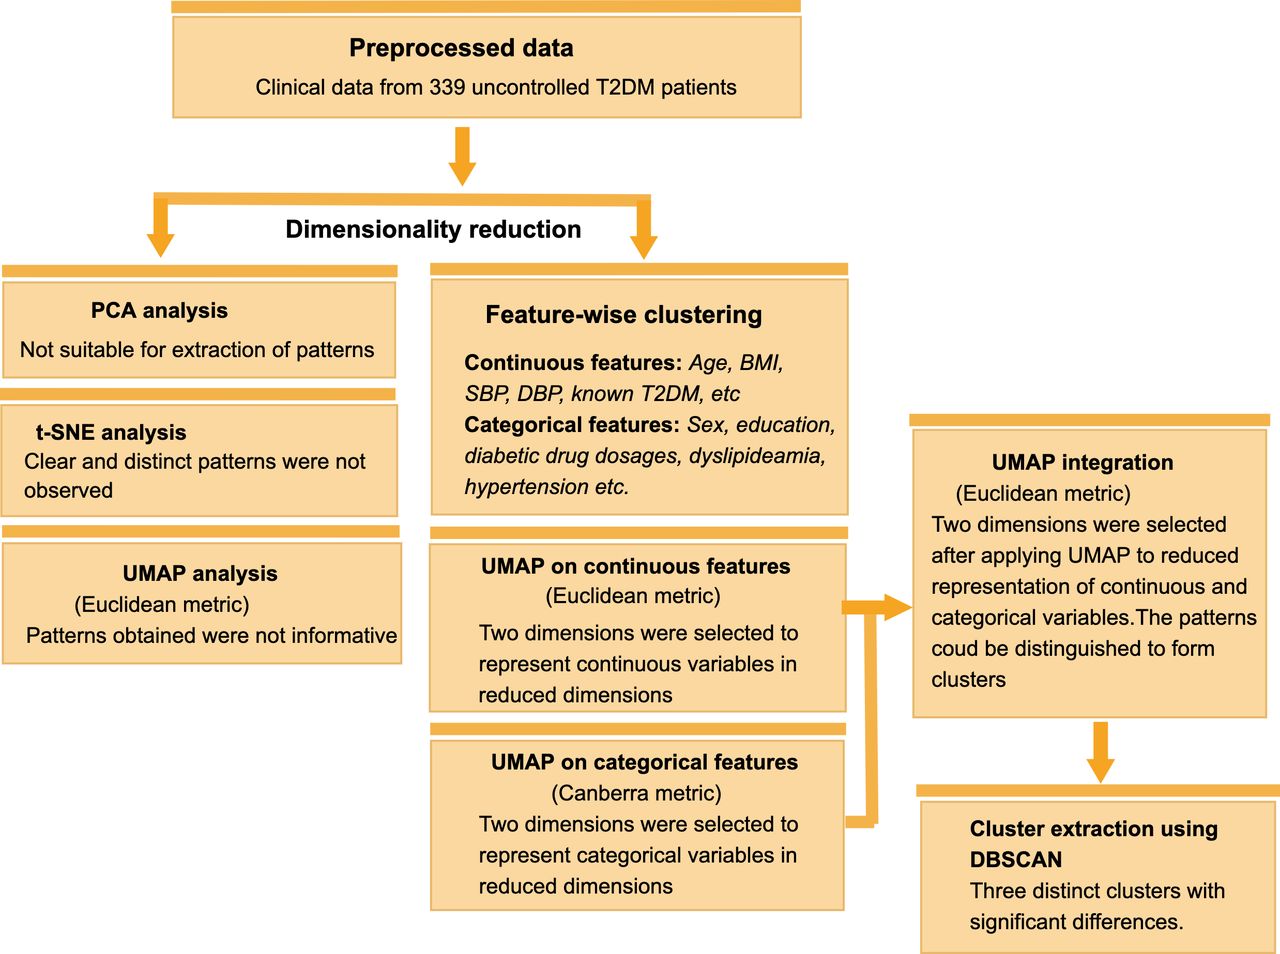
Clustering workflow with clinical data from 339 patients with uncontrolled T2DM. BMI, body mass index; DBP, diastolic blood pressure; DBSCAN, density-based spatial clustering of applications with noise; PCA, principal component analysis; SBP, systolic blood pressure; T2DM, type 2 diabetes mellitus; t-SNE, t-distributed stochastic neighbor embedding; UMAP, Uniform Manifold Approximation and Projection.
Cluster characterization
Cluster 1 (C1)
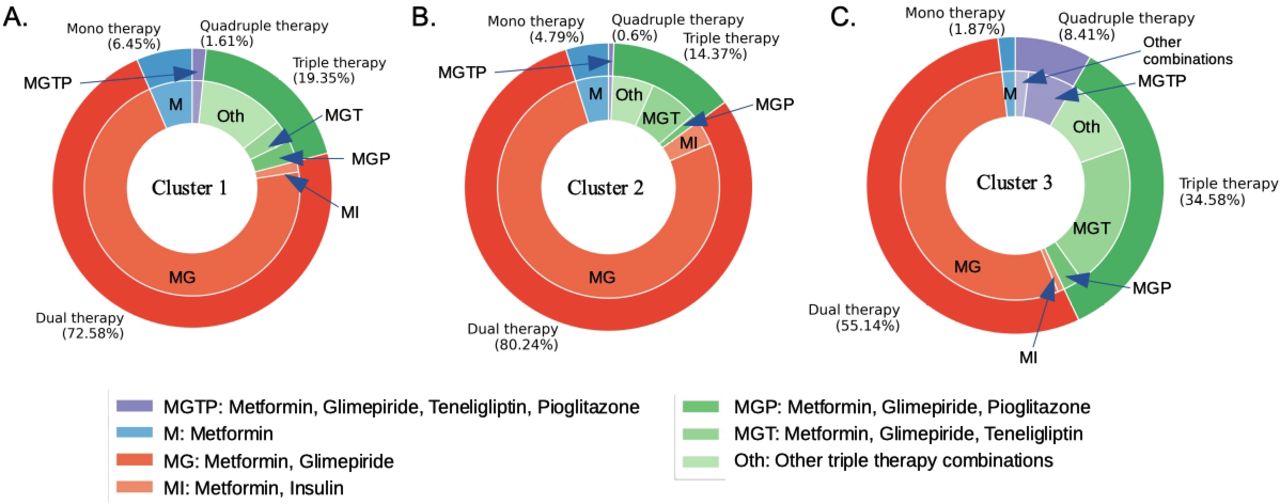
C1 was the cluster with recent onset T2DM (diagnosed with T2DM within the last 2 months). None of the patients in this cluster presented with hypertension at the first visit with only one patient from this group becoming hypertensive at the final visit. This cluster had the lowest average age (43.56 years) but the highest percentage of patients having T2DM parents (37.1%). Considering the duration of T2DM, the age of T2DM onset in this group is around 43 years. Per cent distribution of patients from this cluster receiving monotherapy, dual therapy, triple therapy and quadruple therapy for T2DM was found to be 6.45%, 72.58%, 19.35% and 1.61%, respectively (figure 3A).

Antidiabetic drug combinations and the percentage of patients receiving them in three clusters. Percentage of patients in cluster 1 (A), cluster 2 (B) and cluster 3 (C) receiving monotherapy, dual therapy, triple therapy and quadruple therapy along with the specific antidiabetic drug combinations for each therapy group.
Cluster 2 (C2)
C2 had the highest average age (51 years), BMI (≥25) and body fat percentage (20.2 %) with history of T2DM and hypertension for around 21 and 28 months, respectively. Considering the duration of both the diseases, this group had the onset of T2DM and hypertension between 48 and 50 years. Per cent distribution of patients from this cluster receiving monotherapy, dual therapy, triple therapy and quadruple therapy for T2DM was found to be 4.79%, 80.24%, 14.37% and 0.6% respectively (figure 3B). This group had the most patients (71.86%) receiving antihypertensive therapy in the final visit among whom 48.5% received mono therapy, 22.16% received dual therapy and 1.2% received triple therapy. (online supplemental figure 3C).
Cluster 3 (C3)
C3 was found to have a relatively long history of T2DM of over 6 years compared with the other clusters and no history of hypertension at initial presentation. With a mean age of 49 years, the age of T2DM onset for this group is around 43 years, which is similar to that of cluster 1. Per cent distribution of patients from this cluster receiving monotherapy, dual therapy, triple therapy and quadruple therapy for T2DM was found to be 1.87%, 55.14%, 34.58% and 8.41%, respectively (figure 3C). Though the mean systolic blood pressure (SBP) and diastolic blood pressure (DBP) in this group was higher than that of cluster 1 (SBP: 131.15 mm Hg in C3 vs 119.38 mm Hg in C1, DBP: 81.4 mm Hg in C3 vs 78.72 mm Hg in C1), the values at presentation did not reach the cut-off for hypertension. A percentage of 41.12 of the patients from this cluster turned out to be hypertensive at the final visit. Per cent distribution of patients receiving antihypertensive therapy in the final visit was: monotherapy received by 23.36%, dual therapy by 14.95% and triple therapy by 1.87% (online supplemental figure 3C).
Assessment of IR and β cell dysfunction within the clusters
To assess the degree of IR and β cell dysfunction in all the clusters, 100 patients (17 from C1, 49 from C2 and 34 from C3) were randomly selected out of 339 patients with uncontrolled T2DM and subjected to OGTT. These were the only patients for whom the requisite attributes were on record. Cluster 1 had the maximal β cell function (HOMA-B=52.29%, DI=1.55), whereas C3 was found to have the worst revival with HOMA-B value of 26.7% and DI of 0.55. Cluster 2 had a moderate revival in β cell function with HOMA-B value of 40.27% and DI of 0.77. Interestingly, both the IR indices were found to be similar for all the clusters (table 2). Among the three clusters, C3 had the worst glycemic control (HbA1c=8.41%) and C2 had the best glycemic control (HbA1c=7.46%), while C1 had a moderate glycemic control (HbA1c=7.74%).
Summary statistics of the postclustering features of all the T2DM clusters
Discussion
Using an unsupervised clustering workflow on a clinical dataset of patients with uncontrolled T2DM, we discover three subtypes of T2DM with respect to disease duration, presence of hypertension and severity of β cell dysfunction. Interestingly, we find that the degree of IR remains similar across all the three clusters though β cell function is different among them. Thus, the ability of antidiabetic drugs to recover the pancreatic β cell function remains critical toward achieving glycemic control in T2DM.
Our analysis reveals that cluster 1 consisting of patients with recent onset T2DM with no history of hypertension represents an early onset of T2DM group where majority of the patients (72.58%) received dual therapy (glimepiride and metformin). As β cell function remains relatively preserved in the earlier stage of T2DM,20 21 this cluster had the best β cell function among the three clusters. However, standard dual therapy could not help achieve the HbA1c target of 7% thereby suggesting the need for a more aggressive protocol for glycemic control. In contrast, cluster 2 had the highest age and BMI, the two most important risk factors for T2DM22 23 and was the only group presenting with hypertension. Thus, cluster 2 represents the classical form of obesity associated T2DM. Interestingly, this cluster showed the best glycemic control (HbA1c=7.46%) with 80.24% patients having received dual therapy (glimepiride and metformin). Cluster 3 had the longest history of T2DM with an age of onset similar to that of cluster 1 (around 43 years) and no complaint of hypertension and displayed the most severe defect in β cell function. Though cluster 3 had the maximum number of patients receiving triple therapy (34.58% in C3 vs 14.37% in C2 vs 19.35% in C1) and quadruple therapy (8.41% in C3 vs 0.6% in C2 vs 1.61% in C1), it showed the worst recovery in β cell function and thereby had the worst glycemic control (HbA1c=8.41%).
The study conducted by Anjana et al3 reported four clusters among diagnosed T2DM individuals: severe insulin deficient diabetes (SIDD), insulin-resistant obese diabetes (IROD), combined insulin resistant and deficient diabetes and mild age-related diabetes (MARD). Interestingly, the SIDD subtype had the lowest age of diagnosis (42.5 years) and BMI (24.9) along with the worst glycemic control (10.7%), which is similar to cluster 1 and cluster 3 in our study. Similarities in the age of T2DM onset, BMI and comorbid condition between cluster 1 and 3 suggest that patients in cluster 3 represents a subgroup of cluster 1 at a later stage of life. However, cluster 2 having a late age of T2DM onset (48–50 years), higher BMI and the best glycemic control displays similarity with both IROD and MARD.
Our dataset including the antidiabetic drug combinations for all patients also reveal a differential ability of the three clusters to revive the β cell function. The cluster with recent onset T2DM had a modest ability to increase β cell function in response to anti diabetic drugs. However, among the other two clusters with long standing T2DM, the cluster with accompanying hypertension showed better glycemic control with dual antidiabetic therapy, whereas the other one with no clinical history of hypertension had the worst glycemic control even with triple antidiabetic therapy. β cell dysfunction progresses with time in untreated T2DM.20 21 As expected, cluster 1 in our study with recent onset T2DM was found to have the best β cell reserve compared with the other clusters. However, the difference in β cell reserve between both the clusters with long-standing T2DM may be explained by their obesity status. Obesity has been shown to positively associate with β cell function24 with obese patients with T2DM found to have relatively higher levels of fasting14 and postprandial insulin25 at diagnosis compared with non-obese T2DM patients. The cluster exhibiting greater revival in β cell function as well as better glycemic control was the most obese with highest body fat percentage. Though both the clusters had similar degree of IR, the obese T2DM cluster was found to have a greater β cell reserve compared with the non-obese cluster.
The age of onset of T2DM was 43 years for both the recent onset and the long-standing non-obese cluster, while it was 49 years for the obese cluster. Though T2DM occurs mainly in the fifth decade of life, studies have reported an early age of onset in the fourth decade of life among Asian Indians.26 Similarity of the obese T2DM cluster to obesity-associated T2DM in terms of age of onset (fifth decade of life) indicates that T2DM manifests in this subgroup as a component of metabolic syndrome. Expectedly, this subtype presents with the comorbidity of hypertension. However, it is observed that achieving glycemic control is relatively easier in this subgroup. However, the long-standing non-obese subtype with no history of hypertension is caused in the early fourth decade of life and shows similarity to the metabolically unhealthy non-obese phenotype.27 As seen in our study, achieving the glycemic target is difficult for this subtype even with triple and quadruple antidiabetic therapy.
Cellular and molecular underpinnings for the differential age of onset, β cell function and consequent therapeutic outcome needs further examination. Somewhat positive impact of obesity on glycemic control may be due to the presence of protective adipokines28–30 that play important role in maintaining the β cell function. Absence of those protective adipokines among the non-obese T2DM individuals could render them resistant to standard antidiabetic therapy. Since ageing positively contributes to an increased IR31 and decreased β cell function,23 32 the paradoxical role of age in achieving better glycemic control also entails separate examination.
The primary goal of diabetes treatment is to prevent the long-term complication of chronic hyperglycemia. Accordingly, our study suggests that cluster 2 patients (representing the obesity associated diabetes) had relatively adequate glycemic control with oral drugs but have associated hypertension. Patients in cluster 1 and 3 conversely seems to have an initial period of adequate control but later on develop beta cell dysfunction and worsening hyperglycemia. However, these patients did not have associated hypertension. Thus, it would be important to prioritize glycemic control in these patients either by using oral drugs or phasing them to insulin therapy. They might also be encouraged to perform self-monitoring of blood glucose, especially in postprandial states, as the first sign of beta cell failure is postprandial hyperglycemia.
The strength of the study is defined by the regular clinical follow-up of the patients with T2DM. However, there were several limitations. First of all, only those patients who were available during the final phase (2020–2021) could be recruited for OGTT. Also the analysis was done on a cross-sectional dataset, which is a limitation to investigate a causal relationship. Another limitation of this study is its dependence on the rural population from a single clinic. This may be overcome by making the present study multicentric and multiethnic.
Conclusions
Uncontrolled T2DM comprises of three heterogeneous clusters with respect to duration of disease, comorbid condition and β cell function. While obesity-associated T2DM patients are relatively amenable to standard therapeutic regimen, achieving glycemic control in the early-onset non-obese T2DM becomes difficult with increase in disease duration. Stratification of uncontrolled T2DM patients on the basis of pathoclinical features remains the first step toward personalized management in T2DM. In addition, specific therapeutic strategies are to be devised for early and rapid glycemic control for non-obese T2DM patients.
In summary, following conclusions can be drawn from our study: cluster 2 and cluster 3, respectively, represent the obesity associated and Asian-Indian diabetic variant, whereas considerable number of cluster 1 patients might transit to cluster 3 following significant damage of beta cells. Cluster 2 patients should be prioritized for management of associated diseases, while clusters 1 and 3 must have a tighter glycemic control. Current therapy in management of diabetes and its associated comorbidities is based on the classical obesity-associated T2DM. However, there is a need to revisit antidiabetic therapy in the context of Asian-Indian variant.
Data availability statement
Data are available on reasonable request. The dataset generated during the current study will be available on request from the corresponding authors. The following code used in the study is publicly available in the github repository - https://github.com/mra/clustering-workflow.
Ethics statements
Patient consent for publication
Ethics approval
This study involves human participants and was approved by Institutional Human Ethics Committee of CSIR-IICB, Kolkata. Ethics committee approval letter for the study is available with us. However, it is without the reference number or ID. Participants gave informed consent to participate in the study before taking part.
Acknowledgments
The authors would like to acknowledge Professor Pabitra Mitra and Dr Arnab Sengupta for their guidance in interpreting the clustering results.
References
Supplementary materials
Supplementary Data
This web only file has been produced by the BMJ Publishing Group from an electronic file supplied by the author(s) and has not been edited for content.
Footnotes
MRA, SKM and JS contributed equally.
Contributors SKM and JS recruited subjects and performed clinical experiments. SKM and AP did all the biochemical assays. MRA, CM and JS analyzed the data. PC, CM and JS contributed to the study concept, design and writing of the manuscript. PC, CM and JS are the guarantors of this work and have full access to all the data in the study and take responsibility for the integrity of the data and the accuracy of the data analysis. All authors approved the final version of the article, including the authorship list.
Funding This work has been supported by a grant to PC by the Indian Council of Medical Research (5/4/5–6/Diab./2021-NCD-III). MRA received a research fellowship from MHRD (IMP/2018/000471). JS received a research fellowship from ICMR (No.3/1/3/JRF-2017/HRD-LS/56429/54).
Competing interests None declared.
Provenance and peer review Not commissioned; externally peer reviewed.
Supplemental material This content has been supplied by the author(s). It has not been vetted by BMJ Publishing Group Limited (BMJ) and may not have been peer-reviewed. Any opinions or recommendations discussed are solely those of the author(s) and are not endorsed by BMJ. BMJ disclaims all liability and responsibility arising from any reliance placed on the content. Where the content includes any translated material, BMJ does not warrant the accuracy and reliability of the translations (including but not limited to local regulations, clinical guidelines, terminology, drug names and drug dosages), and is not responsible for any error and/or omissions arising from translation and adaptation or otherwise.