Article Text

Abstract
Introduction Type 2 diabetes mellitus (T2DM) has traditionally been considered a coronary heart disease ‘risk equivalent’ for future mortality, but significant heterogeneity exists across people with T2DM. This study aims to determine the risk of all-cause mortality of patients with cardiovascular disease (CVD) and T2DM in UK and Hong Kong, with stratifications for hemoglobin A1 (HbA1c) concentrations, compared with those without CVD and diabetes mellitus.
Research design and methods This is a retrospective cohort study of 3 839 391 adults from Hong Kong and a prospective cohort study of 497 779 adults from the UK Biobank. Individuals were divided into seven disease groups: (1) no T2DM and CVD, (2) T2DM only with HbA1c <7%, (3) T2DM only with HbA1c 7%–7.9%, (4) T2DM only with HbA1c 8%–8.9%, (5) T2DM only with HbA1c ≥9%, (6) CVD only, and (7) T2DM and CVD. Differences in all-cause mortality between groups were examined using Cox regression.
Results After around 10 years of median follow-up, 423 818 and 19 844 deaths were identified in the Hong Kong cohort and UK Biobank, respectively. Compared with individuals without T2DM and CVD, the adjusted HR for all-cause mortality in the other six disease groups for the Hong Kong cohort was 1.25 (95% CI 1.23 to 1.27) for T2DM only with HbA1c <7%, 1.21 (95% CI 1.19 to 1.23) for T2DM only with HbA1c 7%–7.9%, 1.36 (95% CI 1.33 to 1.39) for T2DM only with HbA1c 8%–8.9%, 1.82 (95% CI 1.78 to 1.85) for T2DM only with HbA1c ≥9%, 1.37 (95% CI 1.36 to 1.38) for CVD only, and 1.83 (95% CI 1.81 to 1.85) for T2DM and CVD, and for the UK Biobank the HR was 1.45 (95% CI 1.33 to 1.58), 1.50 (95% CI 1.32 to 1.70), 1.72 (95% CI 1.43 to 2.08), 2.51 (95% CI 2.05 to 3.08), 1.67 (95% CI 1.59 to 1.75) and 2.62 (95% CI 2.42 to 2.83), respectively. This indicates that patients with T2DM had an increased risk of mortality compared with those without T2DM and CVD, and in those with HbA1c ≥9% an even higher risk than people with CVD.
Conclusions Patients with T2DM with poor HbA1c control (8%–8.9% and ≥9%) were associated with similar and higher risk of mortality compared with patients with CVD, respectively. Optimal HbA1c, controlled for risk reduction and prevention of mortality and complications in diabetes management, remains important.
- Type 2 Diabetes
- Mortality
- Glycemic Control
Data availability statement
No data are available.
This is an open access article distributed in accordance with the Creative Commons Attribution Non Commercial (CC BY-NC 4.0) license, which permits others to distribute, remix, adapt, build upon this work non-commercially, and license their derivative works on different terms, provided the original work is properly cited, appropriate credit is given, any changes made indicated, and the use is non-commercial. See: http://creativecommons.org/licenses/by-nc/4.0/.
Statistics from Altmetric.com
WHAT IS ALREADY KNOWN ON THIS TOPIC
Type 2 diabetes mellitus (T2DM) is often regarded as a mortality risk equivalent to cardiovascular disease (CVD); however, large heterogeneity among those with T2DM complicates the comparison.
WHAT THIS STUDY ADDS
This study compared all-cause mortality risk between patients with T2DM at different glycemic levels and those with and without CVD.
The findings identified T2DM with poor glycated hemoglobin (HbA1c) control (8%–8.9%) to be associated with a similar risk of mortality as CVD, while HbA1c ≥9% was associated with an even higher risk of mortality.
HOW THIS STUDY MIGHT AFFECT RESEARCH, PRACTICE OR POLICY
This study suggests that optimizing glycemic control in people with T2DM may be beneficial in reducing the risk of mortality.
Introduction
Type 2 diabetes mellitus (T2DM) is associated with all-cause mortality, particularly in relation to a wide range of cardiovascular conditions, collectively comprising the leading cause of death in people with T2DM.1 2 Indeed, mortality risk due to cardiovascular disease (CVD) in people with T2DM is two to four times higher than in those without diabetes.3 Previous studies have demonstrated that people with diabetes without prior cardiovascular conditions are at a similar absolute risk of CVD as people without diabetes but with established CVD.4 While these studies shed light on people with T2DM being at the highest risk category for cardiovascular events, there is little information on whether diabetes alone has a similar baseline risk of all-cause mortality as CVD.5 People with T2DM exhibit significant heterogeneity in disease progression and incidence of disease complications, which are related in part to the intensity of disease management strategies, concomitant risk factors and sociodemographic factors. This heterogeneity further indicates a differentiated excess risk of mortality from all causes, among people with T2DM, based on modifiable risk factor levels. Among the various risk factors, hemoglobin A1 (HbA1c) is routinely used for assessing glycemic control in subjects with T2DM, and its level is a strong predictive indicator of diabetes complications.6 7 Early observations in people with T2DM in the UK Prospective Diabetes Study (UKPDS) showed a linear relationship between mean HbA1c and T2DM-related endpoints, where for every 1% reduction in HbA1c there was a 21% lower risk of all-cause mortality.6 Hence, HbA1c is one of the key indicators for measuring T2DM control. However, limited evidence to date has compared all-cause mortality from CVD with all-cause mortality from T2DM in subjects at different levels of glycemic control, reflected by their HbA1c concentrations. This study sought to evaluate the risk of all-cause mortality in people with T2DM by stratified HbA1c concentrations, in comparison with those without diabetes with CVD at baseline, using well-defined data from the UK Biobank and a population-based cohort in Hong Kong. We hypothesize that the risk of all-cause mortality in people with T2DM with high HbA1c concentrations would increase similarly or higher than those with CVD alone.
Methods
Study design
In this study, we used a retrospective cohort recruited from the electronic health records of the Hong Kong Hospital Authority in Hong Kong and a prospective cohort from UK Biobank.
The Hong Kong Hospital Authority is a regulatory body for public healthcare service providers in Hong Kong, including 42 hospitals, 47 specialist outpatient clinics and 73 primary care clinics. Clinicians and related healthcare professionals have received training on using the electronic health records to record clinical information and patient demographics. The validity and coding accuracy of the electronic health records were well established and evaluated in previous high-quality, population-based epidemiological studies.8–10 The majority of the population in Hong Kong is Chinese, accounting for 95%, 93.6% and 92% of the population in 2006, 2011 and 2016, respectively.11 The Hong Kong cohort includes patients with at least one attendance of public clinical services, including general/specialist outpatient clinic and hospitalization, dated between January 2008 and December 2017. The earliest appointment dates available were used as the baseline and all patients were followed until the occurrence of an outcome event, death or December 31, 2018.
The UK Biobank was a prospective study on over 500 000 participants (over 90% were Caucasian), aged 40–69 at the time of recruitment, between 2006 and 2010. The data set consisted of various baseline measurements, disease status, health-related behaviors, participants’ socioeconomic status and health-related outcomes from more than 10 years of follow-up. Details of the study protocol have been described elsewhere.12–14
In both cohorts, people who were less than 18 years old at baseline or patients with T2DM without HbA1c records at baseline were excluded from the study.
Patient groups
Patients were classified into one of the following groups according to their T2DM and CVD status at baseline: (1) no T2DM and CVD, (2) T2DM only with HbA1c <7%, (3) T2DM only with HbA1c 7%–7.9%, (4) T2DM only with HbA1c 8%–8.9%, (5) T2DM only with HbA1c ≥9%, (6) CVD only, and (7) T2DM and CVD. The group without either T2DM or CVD was used as the reference group to estimate HR and life expectancy. CVD was defined as having coronary heart disease (CHD), heart failure or stroke. Both T2DM and diabetes mellitus (DM) were defined as diagnosis of T2DM using the International Classification of Primary Care-2 (ICPC-2) codes or the International Classification of Diseases, Ninth Edition, Clinical Modification (ICD-9-CM), International Classification of Diseases 10th Revision, use of antidiabetic drugs or self-reported outcomes (for the UK Biobank only) on or before baseline. The details of the ICPC-2 and ICD-9-CM diagnosis codes for each individual event are shown in online supplemental tables 1 and 2. In the Hong Kong cohort, a previous study showed high coding accuracy in the diagnoses of myocardial infarction (MI) and stroke, with positive predictive values of 85.4% (95% CI 78.8% to 90.6%) and 91.1% (95% CI 83.2% to 96.1%), respectively.9 In the UK Biobank, the coding accuracy in the diagnosis of stroke was found to be at a positive predictive value of 79% (95% CI 73% to 94%).15
Supplemental material
Outcomes
All-cause mortality was the primary outcome of the study. Information on deaths in the Hong Kong cohort was obtained from the Hong Kong Deaths Registry, which is a governmental body for recording deaths of Hong Kong residents. In the UK Biobank, death records of the participants were collected from the National Health System (NHS) Digital in England and Wales or from the NHS Central Register in Scotland. The secondary outcome studied is life expectancy.
Baseline covariates
Covariates included sex, age, smoking status (non-smoker/smoker), obesity, hypertension, hyperlipidemia and other comorbidities (including atrial fibrillation, peripheral vascular disease, amputation, dementia, chronic lung disease, connective tissue disease, peptic ulcer disease, liver disease, chronic kidney disease, hemiplegia and cancer) at baseline for the Hong Kong cohort as well as for the UK Biobank. The details of the ICPC-2 and ICD-9-CM diagnosis codes for obesity, hypertension, hyperlipidemia and each comorbidity are shown in online supplemental tables 1 and 2. The Townsend Deprivation Index, which reflects material deprivation, was also included as a covariate in the UK Biobank analysis.
Data analysis
Baseline covariates in each patient group in both cohorts were summarized using descriptive statistics. The incidence rate of all-cause mortality was reported. Multivariable Cox proportional hazard regression adjusted for baseline covariates was conducted to evaluate the effect of T2DM/CVD and the risk of all-cause mortality. Proportional hazard assumptions were verified using scaled Schoenfeld residuals plot, and multicollinearity was examined with variance inflation factor. Several sensitivity analyses were conducted. First, complete case analysis with additional baseline covariates, including systolic and diastolic blood pressure, body mass index (BMI), low-density lipoprotein cholesterol and estimated glomerular filtration rate, was performed. Second, multiple imputation was used to replace missing data in additional baseline covariates in the sensitivity analysis. Third, we conducted a Cox regression to evaluate the association between T2DM/CVD and CVD-related mortality. Fourth, due to the mechanistic differences in the occurrence of heart failure from events of stroke and CHD, we further identified only CHD and stroke events and included them as atherosclerotic cardiovascular diseases (ASCVD) to estimate the association between T2DM/ASCVD and all-cause mortality. Five sets of imputations were produced using chained equation method. The 95% CI of the pooled estimates was generated based on Rubin’s rule. Fifth, smoking status in the UK Biobank was further categorized into (1) never smoker, (2) current smoker with pack years <24.5 (median of pack years), (3) current smoker with pack years ≥24, (4) previous smoker with quit years <19 (median of quit years) and (5) previous smoker with quit years ≥19. Subgroup stratifications by sex, age, smoking status, Charlson index, Townsend Deprivation Index (UK Biobank only), duration of T2DM, oral antidiabetic drugs (metformin, sulfonylurea and other oral antidiabetic drugs for the Hong Kong cohort; DM drugs or non-DM drugs for the UK Biobank due to unavailability of drug-specific records for patients in the database) and insulin (bolus and basal bolus; Hong Kong cohort only) were employed to examine differences in HR among each subgroup relative to the reference group. Two-tailed tests with a p value significance level of 0.05 were adopted by the study. All statistical analyses were executed using Stata V.15.1.
Results
A total of 3 839 391 and 497 779 people with T2DM were included in the Hong Kong and UK Biobank cohorts, respectively. In the Hong Kong cohort, 44.6% were male, with a mean age of 50.5 years. There were 3 396 417 people without DM and CVD, 59 105 people with HbA1c less than 7% (1.53%), 55 648 with HbA1c of 7%–7.9% (1.45%), 33 413 with HbA1c of 8%–8.9% (0.87%), 40 860 with HbA1c ≥9% (1.06%), 179 974 with CVD only (4.68%) and 73 974 with both T2DM and CVD (1.93%). In the UK Biobank, 45.5% were male and the average age was 56.5 years. The number of patients for each of the above patient groups was 449 936, 8207 (1.65%), 3556 (0.71%), 1429 (0.29%), 999 (0.20%), 29 138 (5.85%) and 4514 (0.91%). Descriptive statistics of the baseline characteristics of each patient group from the two cohorts are summarized in tables 1 and 2, respectively. The baseline characteristics of complete cases analysis and multiple imputation analysis are summarized in online supplemental tables 3–6.
Baseline characteristics of subjects by patient group in the Hong Kong cohort
Baseline characteristics of subjects by patient group in the UK Biobank
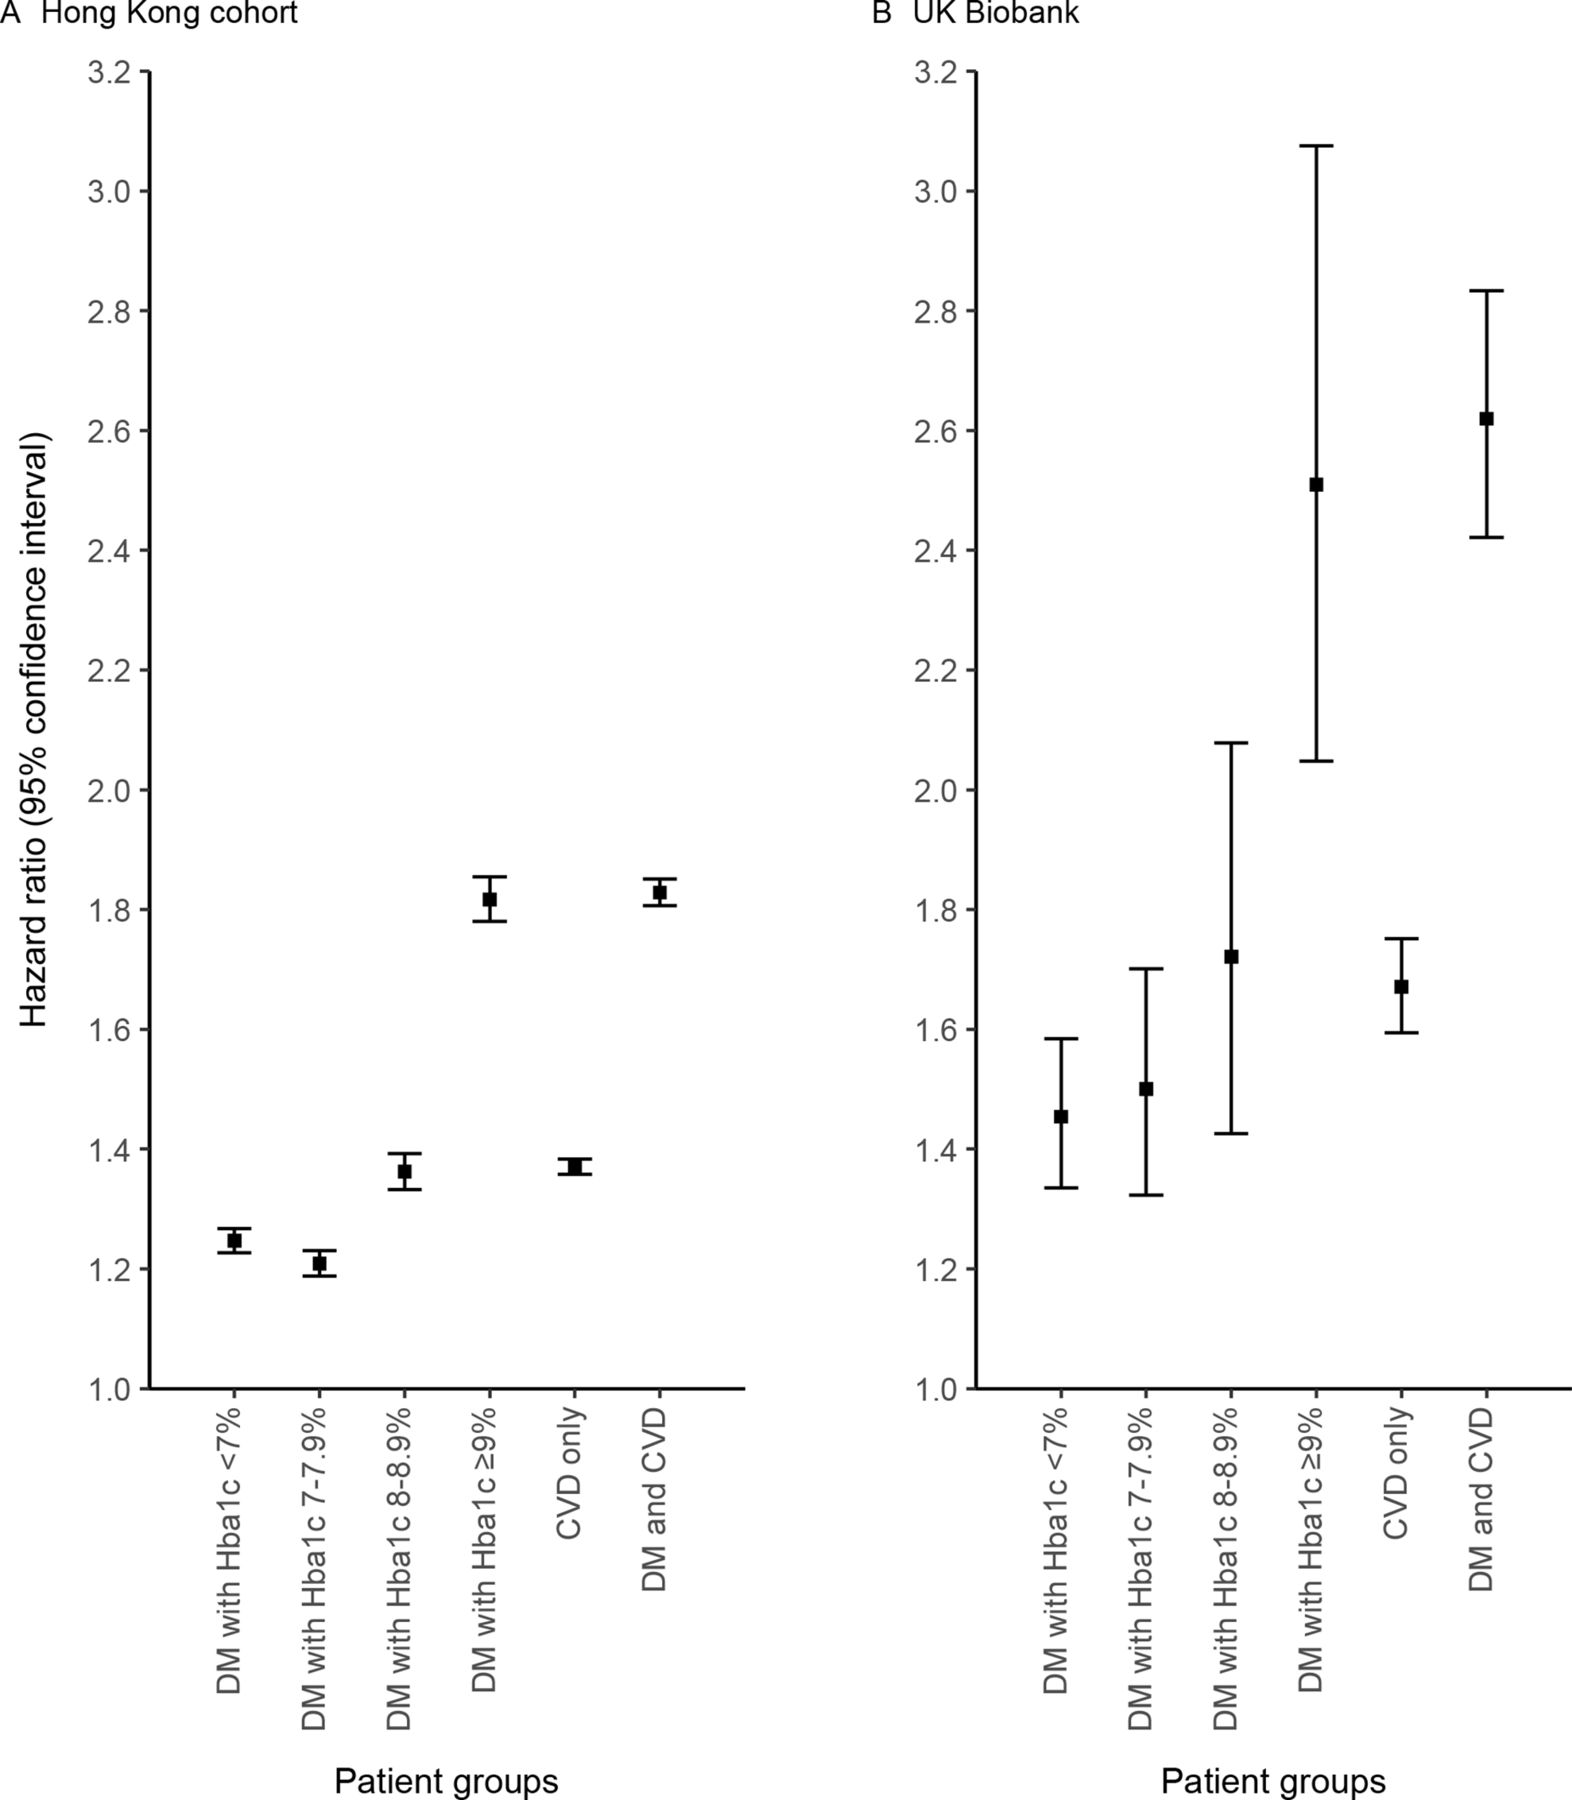
The number and incidence rate of deaths for each patient group are listed in table 3. The median follow-up was 9.1 years (a total of 30 million person-years) and 11.4 years (a total of 5.6 million person-years) in the Hong Kong cohort and UK Biobank, respectively. The incidence rate of death for people without DM and CVD was 9.82 cases per 1000 person-years for the Hong Kong cohort and 2.97 cases per 1000 person-years for the UK Biobank during the follow-up period. Further, for the Hong Kong cohort, the incidence rates of death were similar among the four DM-only groups (25.9–30.5 cases/1000 person-years). Having CVD only or both DM and CVD resulted in larger incidence rates, which were 56.7 cases per 1000 person-years and 75.6 cases per 1000 person-years, respectively. The incidence rate of death for subjects with diabetes was comparable when HbA1c was <9% in the UK Biobank (6.56–7.10 cases/1000 person-years) and significantly higher when HbA1c was ≥9% (8.80 cases/1000 person-years). The incidence rate for CVD-only patients was similar to subjects with diabetes with high HbA1c (9.20 cases/1000 person-years). Having both T2DM and CVD approximately doubled the incidence rate (17.0 cases/1000 person-years). The HRs for patients with DM and/or CVD compared with patients with neither the condition are illustrated in figure 1. The HR increased with HbA1c values among subjects with DM. When HbA1c is equal to or higher than 9%, the HR was 1.82 (95% CI 1.78 to 1.85) in the Hong Kong cohort and 2.51 (95% CI 2.05 to 3.08) in the UK Biobank. For CVD-only patients, the HR was 1.37 (95% CI 1.36 to 1.38) in the Hong Kong cohort and 1.67 (95% CI 1.59 to 1.75) in the UK Biobank. Having both DM and CVD resulted in higher HR at 1.83 (95% CI 1.81 to 1.85) in the Hong Kong cohort and 2.62 (95% CI 2.42 to 2.83) in the UK Biobank. Online supplemental figure 1A, B demonstrates that sensitivity analysis results from adding clinical indicators and further dividing smoking into different levels showed a similar trend compared with the main analysis.

HR of patients with DM and/or CVD compared with patients without DM and CVD. Cox regressions were adjusted with sex, age, smoking status, disease status of atrial fibrillation, peripheral vascular disease, amputation, dementia, chronic lung disease, connective tissue disease, peptic ulcer disease, liver disease, chronic kidney disease, hemiplegia, cancer, obesity, hyperlipidemia and hypertension at baseline in the Hong Kong cohort (A). In the case of UK Biobank (B), HR was adjusted with the above variables, as well as ethnicity and Townsend Deprivation Index. CVD includes coronary heart disease, heart failure and stroke. CVD, cardiovascular disease; DM, diabetes mellitus; HbA1c, hemoglobin A1c.
Incidence rate and HR of all-cause mortality of the patient groups
The HRs for patients divided into subgroups are illustrated in figure 2A,B. In general, similar to figure 1, the HRs in both data sets increased with HbA1c level among people with DM, and the HRs for the CVD-only group were approximately between those of DM with HbA1c 7%–7.9% and DM with 8%–8.9% in all subgroups. In the Hong Kong cohort, being female, less than 65 years old, non-smoker, Charlson index less than 2, a DM duration of 5 years or less, and drug prescription of sulfonylurea or basal bolus insulin generally led to a larger increase in HR relative to the reference group than in their respective counterparts. In the UK Biobank, significant difference in deprivation between the subgroups was only found among subjects with DM with HbA1c 7%–7.9%, or among age groups in CVD-only patients, or those with both DM and CVD. The association between CVD/T2DM and CVD-related mortality is shown in online supplemental table 7. There is a rising trend in risk as HbA1c increases, and people with T2DM and CVD were associated with the highest risk of CVD-related mortality compared with the other groups. Online supplemental table 8 shows the sensitivity analysis of the association between ASCVD/T2DM and all-cause mortality, with the results mainly consistent with the main analysis.

(A) Subgroup analysis on HR of all-cause mortality of patients with DM and/or CVD in the Hong Kong cohort. HR was adjusted by age, sex, smoking status, disease status of atrial fibrillation, peripheral vascular disease, amputation, dementia, chronic lung disease, connective tissue disease, peptic ulcer disease, liver disease, chronic kidney disease, hemiplegia, cancer, obesity, hyperlipidemia and hypertension at baseline. (B) Subgroup analysis on HR of all-cause mortality of patients with DM and/or CVD in the UK Biobank (UKB). HR was adjusted by age, sex, smoking status, disease status of atrial fibrillation, peripheral vascular disease, amputation, dementia, chronic lung disease, connective tissue disease, peptic ulcer disease, liver disease, chronic kidney disease, hemiplegia, cancer, obesity, hyperlipidemia and hypertension, as well as ethnicity and TDI at baseline. CVD includes coronary heart disease, heart failure and stroke. CVD, cardiovascular disease; DM, diabetes mellitus; HbA1c, hemoglobin A1c; NA, not applicable; TDI, Townsend Deprivation Index.
Discussion
This analysis of two large population-based cohorts from the UK Biobank and Hong Kong demonstrated that the presence of CVD was associated with similar or lower risk of all-cause mortality compared with T2DM alone, only when HbA1c was below 9%. The risk of mortality in T2DM with HbA1c ≥9% was higher relative to CVD, indicating that poorly controlled HbA1c is associated with an excess risk of mortality, to a similar or greater extent as CVD. T2DM with concomitant CVD was associated with approximately double the mortality risk compared with individuals with neither of the two conditions. Our findings suggest that implementation of glycemic control may potentially be beneficial for diabetic management by reducing the likelihood of premature mortality.
The excess mortality associated with T2DM alone was 25%–45% higher among patients with controlled glycemia (HbA1c <7%), but increased substantially to approximately 82%–151% with HbA1c values equal to or beyond 9%. Mortality risks in people with CVD were 37%–67% greater than in those without CVD and DM, and similar to those with HbA1c between 8% and 8.9%. It has been well established that diabetes is associated with increased risk of CVD and a greater likelihood of death following that. Many studies have focused on CVD risk in subjects with diabetes being comparable with those without diabetes with established CVD. A large study in a Danish cohort of over 3.3 million individuals first reported that patients with T2DM but without prior MI had similar risk of death from CHD (HR 2.42–2.45) as those with prior MI (HR 2.44–2.62).16 A study using pooled data from four USA-based cohort studies with 27 730 subjects demonstrated that people with diabetes but without prior CVD and with either a longer duration of diabetes (≥10 years) or with high HbA1c (≥9%) showed an increase in risk of CVD incidence by 20% and 35%, respectively, compared with those with prior CVD but without DM.17 18 However, fewer studies have explored whether diabetes alone confers a risk of all-cause mortality at a magnitude equivalent to the risk associated with CVD alone. In a prospective cohort study of 12 866 men, all-cause mortality was lower in those with only diabetes (HR 1.49) than in those with only non-fatal CVD (HR 1.92), relative to neither diabetes nor CVD.19 The British Regional Heart Study of older men aged 60–79 stratified subjects with diabetes by duration of diabetes and reported that those with early onset of diabetes alone showed a higher risk of all-cause mortality (OR 1.68, 95% CI 1.19 to 2.38) than those with prior MI but without diabetes (OR 1.48, 95% CI 1.22 to 1.78), indicating the heterogeneity in risk by diabetes severity and/or other risk factors.20 The present study further expanded these observations, showing that a subgroup comprising people with T2DM and poorly controlled HbA1c has a risk of mortality approximating that of people with CVD. The findings suggest that T2DM is associated with a lower risk of mortality than CVD; however, the mortality risk becomes equivalent or higher if DM is poorly controlled (indicated by higher HbA1c concentrations, ≥8%). Further, this finding of diabetes demonstrating CVD ‘risk equivalent’ features may be relevant to physicians for consideration of the use of newer (and older) treatment approaches for diabetes management, associated with the added benefits of improving cardiovascular outcomes and/or providing cardiovascular protection to users.21
In the analysis stratified by HbA1c concentrations, we confirmed that glucose control may strongly modify the magnitude of risk of mortality. The UKPDS reported a linear association between HbA1c concentrations and mortality, where the risk of all-cause mortality increased by 21% for each 1% greater HbA1c concentration.6 Similarly, a retrospective study of 71 092 people with T2DM (≥60 years) reported the risk of any diabetes-related complications or death to be significantly higher (28%–43%) only when HbA1c exceeded 8%.22 Data from the Third National Health and Nutrition and Examination Survey additionally suggested that the mortality rate could be lowered by 15.3% if HbA1c is reduced from ≥8% to <6%, compared with 5.7%–5.9%, if the initial values of HbA1c are between 6% and 7.9%.23 A meta-analysis of seven studies with a total of 147 424 participants reported that both low and high HbA1c levels are associated with increased risk of mortality, illustrating a J-shaped curve; we observed a similar trend in the Hong Kong cohort. From the curve, the risk of all-cause mortality increases with a higher rate of HbA1c, at >9.5%, than at any other lower HbA1c values.24 These observations, along with the present study, indicate that any improvement in HbA1c concentration is likely to reduce the risk of mortality, emphasizing the importance of controlling HbA1c in people with T2DM, especially among those with very high levels (≥9%).
The current results showed that the magnitude of mortality risk across the groups in the UK Biobank was higher than that in the Hong Kong cohort. A previous study using a population-based cohort study in Canada reported 50% and 42% lower risks of CVD and mortality in Chinese people with diabetes than in European people with diabetes.25 Another study using Clinical Practice Research Datalink data in the UK also demonstrated that South Asian people with diabetes were at 30% lower risk of mortality compared with their Caucasian counterparts.26 A systematic review of two randomized controlled trials including 19 439 people with T2DM showed higher risks for both all-cause and CVD mortality in those from Western than Asian countries.27 The observation may be attributable to different genetic, biological or lifestyle factors, such as smoking and BMI, in Hong Kong compared with the UK. Additionally, diabetes management approaches differ, which may result in different impacts of diabetes on mortality. Moreover, the individuals in the Hong Kong cohort were extracted from the electronic health records from hospitals and clinics, whereas the participants in the UK Biobank were recruited from the general population. The difference in setting may affect the risk between the Hong Kong cohort and the UK Biobank, and thus a direct comparison may be inappropriate and out of the scope of this study. Nevertheless, the findings from the UK Biobank and Hong Kong cohorts are comparable, illustrating the same overall trend in risks.
The current results showed the effect of age and sex on the association of DM/CVD with mortality risk in the Hong Kong cohort. Prior studies have similarly reported on the influence of sex and age on modifying CVD mortality associated with T2DM.20 28–30 The risk of mortality associated with T2DM or CVD appeared to be higher among women, younger patients (<65 years), non-smokers and those with a disease duration of 5 years or less, but the pattern of mortality across these disease subgroups remained relatively similar to the overall population. Mortality risks of women with T2DM and HbA1c at 8%–8.9% were similar to those with CVD at baseline (39% vs 38%) and were consistently higher than those observed in men (31% vs 34%). A 10-year follow-up of the Hoorn Study likewise reported similar risks of CVD events between T2DM and prior CVD, only in women and not in men.31 Age may also modify the risk of CVD mortality; the relative risk of CVD is generally higher in younger than in older people with T2DM.20 Moreover, the coexistence with other comorbidities in most older patients could mask the effect of DM/CVD on mortality. This may also explain the weakened associations observed in smokers and patients with more comorbidities. Further, adoption of healthier lifestyle practices, such as initiation of regular physical activity, reduced sedentary behavior, intake of nutritious diet and getting adequate sleep, is also associated with lowering the risk of all-cause mortality as well as cause-specific mortality from cancer, CVD, respiratory and digestive diseases in patients with T2DM.32 33 This may explain why those with a disease duration of more than 5 years are associated with lower mortality risks in this study, as they may have already adopted such changes and be benefitting from a healthier lifestyle for a longer duration of time (acquiring the benefits of lowered mortality risks) than those who are relatively newly diagnosed (duration of diabetes ≤5 years), who may be at the initial stages of making this change and/or benefitting from them. Meanwhile, no significant difference in associations between subgroups was observed in the UK Biobank. This may be possibly attributed to the smaller sample size with insufficient power for subgroup analyses. Moreover, the discrepancy between the UK Biobank and the Hong Kong cohort may be related to the different types of sampling. The individuals in the UK Biobank and Hong Kong cohorts were from the general population and electronic health records, respectively. While the inconsistent findings between the two cohorts were observed in the subgroup analyses, the main analysis showed consistent results in both cohorts to conclude that not all people with T2DM can be treated as CVD ‘risk equivalent’. Further studies are warranted to confirm these associations in populations with different characteristics.
This study combined large and comprehensive data sets in Hong Kong and the UK Biobank, which included over 4 million adults and 36 million person-years in total. The study population in Hong Kong recruited people receiving public healthcare services, representative of the general population due to the highly subsidized medical system in Hong Kong. The UK Biobank data set is well defined and reliable, highlighting the generalizability of our results across a wide age range, both genders and race/ethnicities. However, disease diagnoses in the Hong Kong cohort were retrieved from the Clinical Management System, in which the method for CVD ascertainment cannot be validated. Nonetheless, the use of ICD-9-CM codes has previously been shown to have high coding accuracy in diagnosing cardiovascular conditions such as MI and stroke, with positive predictive values of 85.4% and 91.1% (95% CI 83.2% to 96.1%), respectively.9 In addition, we complemented the Hong Kong data set with that from the UK Biobank and observed similar results, proving the reliability of the Hong Kong data set. A comprehensive set of confounders, including disease history and use of medications for DM or overall CVD risk management, were accounted for in this study. However, other factors such as duration of diabetes, drug adherence and other lifestyle factors (eg, physical activity and diet), and time-varying factors were not available, and particularly for the UK Biobank data set medications prescribed to patients for DM treatment were unavailable. In addition, information on the intensity of cardiovascular risk factor-reducing treatment available to patients could not be found in both databases. Finally, the retrospective design of this study does not imply any causal relationship between glycemic control and mortality in patients with T2DM.
Conclusion
This large population-based study demonstrated a graded association between higher HbA1c values and all-cause mortality in patients with T2DM. Poorly controlled T2DM (HbA1c ≥8%) conferred similar or higher mortality risks than patients with CVD. The findings suggest that T2DM with adequate control may not be CVD risk equivalent of mortality. However, the mortality risk becomes equivalent or higher if DM is poorly controlled. Optimal HbA1c, controlled for risk reduction of preventing mortality and complications in diabetes management, remains important.
Data availability statement
No data are available.
Ethics statements
Patient consent for publication
Ethics approval
This study involves human participants. For the Hong Kong cohort, the ethical approval was granted by the Institutional Review Board of the Hong Kong Hospital Authority under the reference code UW 19-362. The UK Biobank received ethics approval from the North West Multi-centre Research Ethics Committee. This research has been conducted using the UK Biobank Resource under application number 65688. Participants gave informed consent to participate in the study before taking part. Participants who withdrew from the study were removed from the analysis.
Acknowledgments
The authors wish to acknowledge the contributions of the Hong Kong Hospital Authority and the UK Biobank for data extraction. The authors also wish to acknowledge the UK Biobank participants and patients in the Hong Kong Hospital Authority who provided the sample that made the data available; without them the study would not have been possible. The computations were performed using research computing facilities offered by Information Technology Services, The University of Hong Kong.
References
Supplementary materials
Supplementary Data
This web only file has been produced by the BMJ Publishing Group from an electronic file supplied by the author(s) and has not been edited for content.
Footnotes
Contributors EYFW contributed to the study design and acquisition of data, researched the data, contributed to the statistical analysis and interpretation of the results, and wrote the manuscript. EYFW, EYTY, ILM, HMY and KSC contributed to the statistical analysis and interpretation of the results and wrote the manuscript. All authors contributed to the review and editing of the manuscript. EYFW is the guarantor of this work and as such had full access to all the data in the study and takes responsibility for the integrity of the data and the accuracy of the data analysis.
Funding The study received funding from the Start-Up Fund of The University of Hong Kong. No funding organization had any role in the design and conduct of the study; collection, management, analysis and interpretation of the data; and preparation of the manuscript.
Competing interests EYFW has received research grants from the Food and Health Bureau of the Government of the Hong Kong SAR and the Hong Kong Research Grant Council, outside the submitted work. CLKL has received research grants from the Food and Health Bureau of the Government of the Hong Kong SAR, the Hong Kong Research Grant Council, the Hong Kong College of Family Physicians and Kerry Group Kuok Foundation, outside the submitted work. EYTY has received research grants from the Food and Health Bureau of the Government of the Hong Kong SAR, outside the submitted work. EWYC has received research grants from the Hong Kong Research Grant Council, Narcotics Division of the Security Bureau of the Government of the Hong Kong SAR, Research Fund Secretariat of the Food and Health Bureau, National Natural Science Fund of China, National Health and Medical Research Council in Australia, Wellcome Trust, Bayer, Bristol Myers Squibb, Pfizer, Janssen, Amgen and Takeda, outside the submitted work. ICKW has received research funding from Amgen, Bristol Myers Squibb, Pfizer, Janssen, Bayer, GSK, Novartis, Hong Kong Research Grant Council and Hong Kong Health and Medical Research Fund, National Institute for Health Research in England, European Commission, and National Health and Medical Research Council in Australia, and also received speaker fees from Janssen and Medice, outside the submitted work.
Provenance and peer review Not commissioned; externally peer reviewed.
Supplemental material This content has been supplied by the author(s). It has not been vetted by BMJ Publishing Group Limited (BMJ) and may not have been peer-reviewed. Any opinions or recommendations discussed are solely those of the author(s) and are not endorsed by BMJ. BMJ disclaims all liability and responsibility arising from any reliance placed on the content. Where the content includes any translated material, BMJ does not warrant the accuracy and reliability of the translations (including but not limited to local regulations, clinical guidelines, terminology, drug names and drug dosages), and is not responsible for any error and/or omissions arising from translation and adaptation or otherwise.