Article Text

Abstract
Objective Women with a history of gestational diabetes mellitus (GDM) have an exceptionally high risk for type 2 diabetes (T2D). Yet, little is known about genetic determinants for T2D in this population. We examined the association of a genetic risk score (GRS) with risk of T2D in two independent populations of women with a history of GDM and how this association might be modified by non-genetic determinants for T2D.
Research design and methods This cohort study included 2434 white women with a history of GDM from the Nurses’ Health Study II (NHSII, n=1884) and the Danish National Birth Cohort (DNBC, n=550). A GRS for T2D was calculated using 59 candidate single nucleotide polymorphisms for T2D identified from genome-wide association studies in European populations. An alternate healthy eating index (AHEI) score was derived to reflect dietary quality after the pregnancy affected by GDM.
Results Women on average were followed for 21 years in NHSII and 13 years in DNBC, during which 446 (23.7%) and 155 (28.2%) developed T2D, respectively. The GRS was generally positively associated with T2D risk in both cohorts. In the pooled analysis, the relative risks (RRs) for increasing quartiles of GRS were 1.00, 0.97, 1.25 and 1.19 (p trend=0.02). In both cohorts, the association appeared to be stronger among women with poorer (AHEI <median) than better dietary quality (AHEI ≥median), although the interaction was not significant. For example, in NHSII, the RRs across increasing quartiles of GRS were 1.00, 0.99, 1.51 and 1.29 (p trend=0.06) among women with poorer dietary quality and 1.00, 0.83, 0.81 and 0.94 (p trend=0.79) among women with better dietary quality (p interaction=0.11).
Conclusions Among white women with a history of GDM, higher GRS for T2D was associated with an increased risk of T2D.
- type 2 diabetes
- gestational diabetes
- genetic risk score
- dietary quality
- prospective cohort studies
This is an open access article distributed in accordance with the Creative Commons Attribution Non Commercial (CC BY-NC 4.0) license, which permits others to distribute, remix, adapt, build upon this work non-commercially, and license their derivative works on different terms, provided the original work is properly cited, appropriate credit is given, any changes made indicated, and the use is non-commercial. See: http://creativecommons.org/licenses/by-nc/4.0/.
Statistics from Altmetric.com
Significance of this study
What is already known about this subject?
Genetic risk factors have been associated with type 2 diabetes (T2D) risk in the general population.
What are the new findings?
In this study based on two independent population of white women with a history of gestational diabetes mellitus (GDM) followed over long period, the genetic risk score was positively associated with the risk of T2D.
The excess risk appeared to be mitigated by better dietary quality after the pregnancy affected by GDM.
How might these results change the focus of research or clinical practice?
These findings advance our understanding of the genetic risk for T2D among women with a history of GDM. It also offers further evidence to support public health efforts of encouraging a healthful diet to prevent T2D among this high-risk population—women with a history of GDM.
Introduction
Gestational diabetes mellitus (GDM) is a common pregnancy complication affecting 6%–15% of pregnancies across world regions.1 Although the condition resolves after delivery in most cases, women with a history of GDM have a more than sevenfold increased risk of developing type 2 diabetes (T2D) compared with women with a normoglycemic pregnancy2; 14%–41% of women with a history of GDM develop T2D within 10 years of the pregnancy affected by GDM,3–5 and the cumulative incidence of T2D continues to increase afterwards.3 5 As such, women with a history of GDM constitute a high-risk population for T2D, and the period after a pregnancy complicated by GDM presents a unique window of opportunity for prevention. To inform such prevention strategies, understanding the genetic and environmental factors associated with T2D among women with a history of GDM is critical.
Individual single nucleotide polymorphisms (SNPs) and genetic risk scores (GRSs) capturing the cumulative risk conferred by these SNPs have been associated with T2D risk in the general population.6 7 However, as women with a history of GDM already have an elevated baseline genetic risk for T2D compared with the general population,8 9 the role genetic factors play in the development of T2D among women with a history of GDM may differ from that in the general population. So far, few studies have examined the association of genetic factors including individual SNPs and GRSs with the risk of T2D among women with a history of GDM10–13; inferences from these studies are hindered by small numbers of T2D cases (n<150), and relatively short follow-up periods (<5 years). Lastly, no study has examined how non-genetic factors may modify the genetic risk for T2D among women with a history of GDM, although such knowledge may guide targeted T2D prevention among this high-risk population.
In the present study, we examined the association of a GRS for T2D with the risk of T2D among two independent population of women with a history of GDM followed over long period. We further investigated how this association might be modified by non-genetic factors of T2D.
Materials and methods
Study population
The current study included women from the Diabetes & Women’s Health (DWH) Study, a prospective cohort study of 4457 women with a history of GDM who were enrolled from two prospective cohorts, the Nurses’ Health Study II (NHSII) and the Danish National Birth Cohort (DNBC).14 All participants of the DWH Study provided written informed consent.
A total of 3667 NHSII participants who developed GDM were included in the DWH Study. The NHSII is an ongoing prospective US cohort study that enrolled 116 430 female registered nurses aged 25- to 42-year old in 1989.15 Questionnaires were administered at enrollment and every other year thereafter. Women who developed GDM were primarily identified from the main biennial NHSII questionnaire, where women reported physician’s diagnoses of GDM up until 2001. Additional GDM cases were identified in the 2009 pregnancy questionnaire, which recorded about women’s recall of physicians’ diagnoses of GDM in all previous pregnancies. The pregnancy during which GDM was diagnosed was referred to as the index pregnancy. Self-reported GDM status in the biennial questionnaire was previously validated using medical records with confirmation among 94% of the cases.16 Women who participated in the DWH Study were largely comparable to women with GDM in the overall NHSII.14 The NHSII part of the DWH Study was approved by the institutional review boards of Brigham and Women’s Hospital and the Harvard T. H. Chan School of Public Health.
A total of 790 DNBC participants who developed GDM during a pregnancy captured by the DNBC study were included in the DWH Study. The DNBC is a prospective Danish cohort study of 91 827 pregnant women enrolled between 1996 and 2002.17 Women with GDM were identified from two sources: the Danish National Patient Register and/or telephone interviews at 30 weeks of gestation or 6 months postpartum.18 Validation using hospital records revealed high sensitivity (96%) and specificity (99%) for GDM diagnoses.18 Characteristics of the women who participated in the DWH Study were largely comparable with the eligible DNBC women.14 The DNBC part of the DWH Study was approved by the Regional Scientific Ethical Committee of the Capital Region of Denmark (record no. H-4-2013-129). Study procedures were followed in accordance with the Declaration of Helsinki.
Outcome assessment
In the NHSII, incident T2D was initially identified in the biennial questionnaires by women’s reports of physician diagnoses and confirmed in a supplementary questionnaire, which included details of the diagnosis. Confirmed T2D events were updated through 2017. T2D was defined by the National Diabetes Data Group (NDDG) criteria19 up to 1997. The cut-off for plasma glucose levels was lowered for T2D cases identified after 1997 in accordance with the American Diabetes Association (ADA) guideline.20 In a previous validation study among a similar cohort of US nurses, 98% of the T2D cases identified using this procedure were confirmed by the medical record review performed by an endocrinologist.21
In the DNBC, 607 participants had a clinical examination including an oral glucose tolerance test (OGTT) and biospecimen collection in 2012–2014 (9–16 years after the index pregnancy). At the clinical exam, women reported physician diagnoses of T2D (WHO recommended the NDDG criteria cutoffs before 1999, and the ADA criteria cutoffs after 1999). Incident T2D was also identified from the OGTT or HbA1c in accordance with the ADA guidelines.20
Covariates assessment
In the NHSII, information on women’s age, smoking status, family history of diabetes and self-reported height and weight were recorded in the 1989 questionnaire and updated in the biennial questionnaires. Body mass index (BMI) was calculated from self-reported height and weight; self-reported weight was highly correlated with weight measured by a technician in a validation study (r=0.97).22 Dietary information was collected in 1991 and updated every 4 years thereafter using a semiquantitative food frequency questionnaire (FFQ) assessing dietary intake in the past year. The alternate healthy eating index (AHEI) was derived as the sum of scores of 11 dietary components.23 We used the AHEI score derived from the earliest dietary assessment after the index pregnancy and before T2D diagnosis to reflect dietary quality after the index pregnancy.
In the DNBC, information on women’s age, pre-pregnancy smoking status, family history of diabetes, and self-reported height and weight were recorded in the questionnaire administered during the index pregnancy. Pre-pregnancy BMI was calculated from self-reported height and weight. Dietary information was also collected in a questionnaire in the clinical exam using a semiquantitative FFQ assessing dietary intake in the past year. The AHEI score was derived using similar approach as in the NHSII.23
Genotyping
Genotyping was performed using the TaqMan quantitative PCR method (Applied Biosystems, Foster City, CA, USA)9 in 1855 DWH Study participants from the NHSII and 603 from the DNBC. In all, 112 candidate SNPs were selected based on previous genome-wide association studies (GWAS) of T2D.9
An additional 208 DWH Study participants from the NHSII has genome-wide data from previous nested case–control studies of kidney stones, ovarian cancer, post-traumatic stress disorder, venous thromboembolism, endometriosis and breast cancer24 25; none of these conditions have known risk SNPs that overlap with the targeted SNPs in the current study. Genotyping was performed using high-density SNP markers platforms, including Illumina (San Diego, CA, USA), HumanHap, Infinium (Natick, MA, USA), OncoArray or Infinium HumanCoreExome.9 24–26 Genotypes were imputed with the Michigan Server27 using the 1000 Genomes Project ALL Phase I Integrated Release v3 haplotypes.28 Accurate genotype results were obtained for most SNPs, as measured by a sample call rate of 97% or a high imputation quality score (r2 ≥0.8) estimated using the MACH software (Cincinnati, OH, USA). The minor allele frequency and the imputation quality scores of all genotyped SNPs were similar across different platforms.9
GRS of T2D
In all, 78 out of the 112 T2D SNPs were identified in the European populations based on information obtained from the recent GWAS catalog (https://www.ebi.ac.uk/gwas/). After excluding 18 SNPs in high linkage disequilibrium and one SNP (HLA-B, rs2244020) with low genotyping call rate, 59 SNPs were retained. An unweighted GRS was constructed as the sum of the number of T2D risk alleles (ie, 0, 1, 2) across the 59 T2D SNPs, assuming an additive genetic model and that each SNP contributed to the disease risk equally and independently. We did not construct a weighted GRS as weights for the T2D SNPs are not available among women with a history of GDM. Furthermore, unweighted GRS has been shown to be more robust to errors arising from differences in effect size and population structure.29 GRS for participants with missing genotype data were standardized to those with complete genotype data (standardized GRS = [total number of risk alleles/number of non-missing genotype ×2]×59), as previously described.30
Among all DWH Study participants with genetic data (n=2063 from the NHSII; n=603 from the DNBC), self-reported non-white women (n=77) in the NHSII were excluded to minimize population stratification; all DNBC participants were self-reported white. Participants with poor sample quality9 (ie, where genotyping failed for >53 SNPs) were also excluded (n=102 in the NHSII and n=53 in DNBC). As a result, the final analytic sample included 1884 participants from the NHSII and 550 from the DNBC. Individuals in the final analytic sample have an average genotyping rate of 97% in the NHSII and 98% in the DNBC across the 59 SNPs.
Statistical analysis
The association of the GRS with the risk of T2D was estimated separately in the NHSII and DNBC using log-binomial models, adjusting for women’s year of birth. The results of the two cohorts were meta-analyzed using fixed effects models weighted by inverse variance of the estimates; no significant heterogeneity between the results from the two cohorts was observed (all p values for Q-statistic ≥0.05, I2 was 0%–42%). We estimated the relative risks (RRs) of T2D by quartiles of the GRS and tested for a linear trend of the association over increasing quartiles using the median GRS value of each quartile. We also estimated the per five allele RR using the GRS as a continuous variable. To provide insights into the specific SNPs contributing to the GRS-T2D associations, we examined individual SNPs in relation to T2D risk and estimated the RRs for each additional copy of the risk allele, assuming an additive genetic model. Both the original p value and the p value corrected for false discovery rate (FDR) were presented for the pool results.
To test the robustness of our findings to SNP selection criteria, we conducted a sensitivity analysis using an alternative GRS based on 42 of the 59 SNPs confirmed to be T2D risk SNPs in recent GWAS meta-analysis among European populations.31 32 To explore biological pathways of the potential genetic effects, we also constructed additional GRSs based on a subset of 34 SNPs postulated to be related to beta cell function (GRSBC) and a subset of 11 SNPs postulated to be related to insulin resistance (GRSIR).33 34 To investigate whether the GRS-T2D association was modified by non-genetic risk factors of T2D, we stratified the main analysis in each cohort by women’s age at GDM diagnosis (≤35,>35 years), pre-pregnancy BMI (<25, 25–29,≥30 kg/m2), family history of diabetes (yes, no), dietary quality after the index pregnancy (AHEI <median, ≥median) and physical activity after the index pregnancy. Interactions were tested using a multiplicative term between the GRS as a continuous variable and each potential effect modifier. All statistical analyses were performed using SAS (V.9.4, SAS Institute, Cary, NC, USA).
Results
The characteristics of the study participants in the NHSII and the DNBC are presented in table 1. Women on average were followed for 21.3 years (SD=5.6) in the NHSII and 12.7 years (SD=1.5) in the DNBC after the index pregnancy. During the follow-up period, a total of 601 women developed T2D: 446 (23.7%) in the NHSII and 155 (28.2%) in the DNBC. Women in the NHSII were of a similar age at the index pregnancy but older at the last follow-up compared with women in the DNBC. Women in the NHSII were also less likely to have a family history of diabetes, less likely to smoke, and leaner than women in the DNBC.
Characteristics of study participants among women with a history of gestational diabetes in the NHSII and the DNBC
Cutpoints for the quartiles of GRS in the study population were 64.0, 68.0 and 72.0 in NHSII and 63.1, 67.7 and 71.0 in DNBC, which were slightly higher than in the entire background population of the respective cohorts (63.6, 67.2 and 71.0 in NHSII; 63.0, 66.1 and 70.0 in DNBC; data not shown). Median AHEI after the index pregnancy in the study population was 46.5 (IQR: 39.5–54.0) in NHSII and 51.9 (IQR: 45.2–58.4) in DNBC. In NHSII, median AHEI at the first dietary assessment in 1991 was slightly lower in the study population (46.5, IQR: 39.5–54.0) than in the entire background population of NHSII (47.5, IQR: 40.0–55.0). Distributions of GRS, BMI and AHEI by T2D status are presented in online supplementary table S1.
Supplemental material
The GRS was positively associated with the risk of developing T2D. In the pooled analysis, the RRs (95% CI) of T2D for increasing quartiles of the GRS were 1.00 (ref), 0.97 (0.79 to 1.21), 1.25 (1.03 to 1.52) and 1.19 (0.97 to 1.45) (p trend=0.02). Every five risk alleles increase in the GRS was associated with a 7% (95% CI: 1.01 to 1.14) increased risk of T2D (p=0.02) (table 2). Associations were in general similar in the cohort-specific analyses. Each five alleles increase in the GRS was associated with a 7% (95% CI: 1.00 to 1.15) increased risk of T2D in the NHSII and a 9% (95% CI: 0.96 to 1.23) increased risk of T2D in the DNBC (table 2).
Relative risks (95% CI)* of type 2 diabetes associated with the genetic risk scores (GRS) for type 2 diabetes among women with a history of gestational diabetes in the NHSII (n=1884) and the (n=550)
In total, 11 individual SNPs were nominally significantly (p≤0.05) associated with the risk of T2D in the pooled analysis, although none of the associations was significant after FDR correction (see online supplementary table S2 and figure S1). Specifically, eight SNPs (KCNQ1 [rs231356], AP3S2 [rs2028299], ARF5/PAX4/SND1 [rs10229583], WFS1 [rs1801214, rs4689388], GPSM1 [rs11787792], HNF1B [rs4430796] and CDKAL1 [rs7766070]) were positively associated with T2D risk, whereas three SNPs (CDKN2A/B [rs10811661, rs7020996] and GLIS3 [rs7041847]) were inversely associated with the risk of T2D. In sensitivity analysis repeating the main analysis recoding the alternative alleles in CDKN2A/B [rs10811661, rs7020996] and GLIS3 [rs7041847] as the risk alleles, the RRs of T2D across increasing quartiles of the GRS became monotonic (data not shown).
The alternative GRS constructed based on 42 SNPs yielded similar results. The pooled RRs (95% CI) for increasing quartiles of the GRS were 1.00 (ref), 1.15 (0.94 to 1.42), 1.15 (0.94 to 1.41) and 1.26 (1.03 to 1.54) (p trend=0.03). Higher GRSIR, but not GRSBC, was significantly associated with increased T2D risk in NHSII; the RRs for increasing quartiles of GRSIR 1.00 (ref), 1.47 (1.14 to 1.89), 1.48 (1.18 to 1.85) and 1.34 (1.05 to 1.71), respectively (p trend=0.01). However, such findings were not observed in the DNBC (online supplementary table S3).
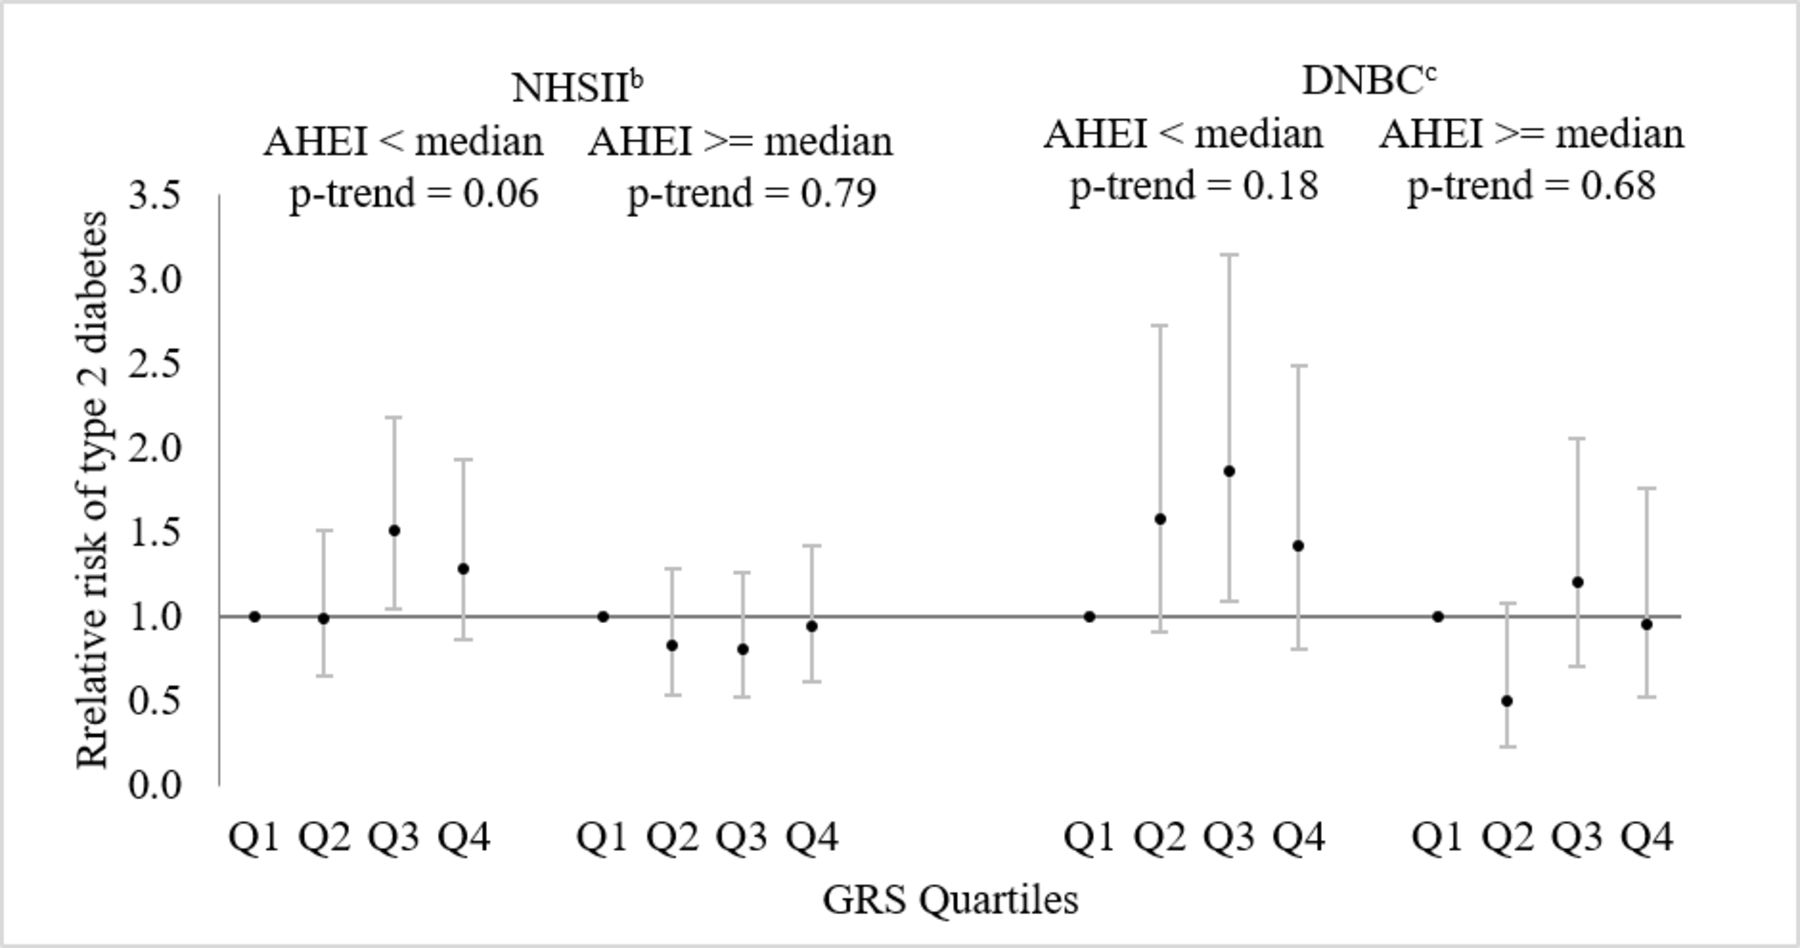
Although tests of interactions were not statistically significant, the association of GRS with T2D appeared stronger among women with poorer dietary quality after the index pregnancy (AHEI <median) than those with better dietary quality (AHEI ≥median) (figure 1). Similar patterns were observed in both cohorts. In the NHSII, among women with poorer dietary quality, the RRs of T2D across increasing quartiles of the GRS were 1.00, 0.99, 1.51 and 1.29 (p trend=0.06), and the RR for every five risk alleles increase in the GRS was 1.13 (95% CI: 1.00 to 1.27), whereas among women with better dietary quality, RR across increasing quartiles of the GRS were 1.00, 0.83, 0.81 and 0.94 (p trend=0.79), and the RR for every five risk alleles increase in the GRS was 0.97 (95% CI: 0.85 to 1.11) (p interaction=0.11). In the DNBC, among women with poorer dietary quality, the RRs of T2D across increasing quartiles of the GRS were 1.00 (ref), 1.58, 1.86 and 1.42 (p trend=0.18), and the RR for every five risk alleles increase in the GRS was 1.10 (95% CI: 0.94 to 1.28), whereas, among women with better dietary quality, and RR across increasing quartiles of the GRS were 1.00 (ref), 0.50, 1.21 and 0.96 (p trend=0.68), and the RR for every five risk alleles increase in the GRS was 1.05 (95% CI: 0.86 to 1.30) (p interaction=0.75). The association of GRS with T2D risk did not differ materially by other risk factors of T2D including age at the index pregnancy, pre-pregnancy BMI, family history of diabetes and physical activity after the index pregnancy.
Relative risks and 95% CIsa of T2D associated with the GRSs for T2D among women with a history of GDM in the NHSII (n=1206) and the DNBC (n=538), stratified by AHEI above and below median after pregnancy. aEstimated in log-binomial models adjusting for women’s year of birth. bAHEI was derived from the earliest dietary assessment after the index pregnancy; included 588 women with AHEI score below median and 618 women with AHEI scores above median. cAHEI was derived from the dietary assessment at the follow-up clinical exam; included 269 women with AHEI score below median and 269 women AHEI score above median. Q1—first quartile; Q2—second quartile; Q3—third quartile; Q4—fourth quartile. AHEI, alternate healthy eating index; DNBC, Danish National Birth Cohort; GDM, gestational diabetes mellitus; GRS, genetic risk scores; NHSII, Nurses’ Health Study II; T2D, type 2 diabetes
Discussion
In the present study, based on two independent populations with a long follow-up of white women with a history of GDM, a higher GRS was significantly associated with a higher risk of T2D, and the findings were largely consistent across the two populations in the USA and Denmark. We also found suggestive evidence that the association may be modified by dietary quality after the index pregnancy; the association was stronger among women with poorer dietary quality after the index pregnancy than among women with a better dietary quality.
Although women with a history of GDM have a greatly increased risk for T2D, not all develop T2D. Few studies have examined genetic factors of T2D in this high-risk population.10–13 A higher GRS for T2D was significantly associated with a higher risk of T2D in several studies of women with a history of GDM.10–12 However, inferences from these studies are hindered by small numbers of T2D cases (n<150), and relatively short follow-up periods (<5 years). In addition, among a subgroup of 218 women in the Diabetes Prevention Programme (DPP) diagnosed with GDM 12 years earlier, a higher GRS for T2D was marginally associated with a greater T2D risk (HR: 1.04; 95% CI: 1.00 to 1.08).13 Of note, some studies used weighted GRS where the weights were derived using the same study population,11 12 raising concerns for model overfitting.35 Given the differences in GRS construction, the number of SNPs included to construct the GRS and the characteristics of the study populations, comparison of results across these studies is challenging. One important contribution of the present study is that a much larger sample of women with a history of GDM (2428 women with a history of GDM, of which 600 developed T2D) were followed for a minimum of 9 years (mean 21 years in the NHSII and 13 years in DNBC), providing more complete outcome adjudication.
Our estimate of RR of T2D associated with every five alleles increase in the GRS among women with a history of GDM was slightly weaker than that in the general population.7 As most of the GDM risk SNPs identified in GWAS were also associated with T2D risk,8 36 the smaller effect size among women with GDM likely reflects an already higher baseline genetic risk for T2D than the general population, as we have demonstrated.
Among the SNPs included in the GRS, eight SNPs showed nominally significant (p≤0.05) positive associations with T2D risk, although none of the associations was significant after FDR correction. Interestingly, only one of the SNPs—CDKAL1 (rs7766070)—is among the 10 SNPs with the strongest association with T2D risk in the general population31 (all 10 SNPs or their proxies were included in this study). Most of the eight SNPs are related to beta-cell function.33 34 On the other hand, three SNPs (CDKN2A/B [rs10811661, rs7020996] and GLIS3 [rs7041847]) showed significantly inverse associations with T2D risk, and the direction was consistent across the two cohorts. CDKN2A/B (rs7020996) was not confirmed as a T2D SNP in the recent GWAS meta-analyses in the general population.31 37 Whereas evidence supporting the T allele of CDKN2A/B (rs10811661)31 38 and the A allele of GLIS3 (rs7041847)37 as T2D risk alleles in the general population is strong; both SNPs are implicated in beta-cell function.33 34 Our sensitivity analyses showed that the inverse association of the three SNPs with T2D risk accounted for the non-monotonic appearance of RRs of T2D across the GRS quartiles. To our knowledge, this is the first study examining a set of candidate SNPs in relation to the risk of T2D in women with a history of GDM. Future studies of larger size are needed, which may require consortium efforts.
Of note, we observed suggestive evidence that the GRS-T2D association was potentially modified by women’s dietary quality. The association appeared stronger among women with a poor dietary quality after pregnancy than among women with a better one. Although the interaction was not significant, the findings were consistent in both cohorts. We are unaware of previous studies on gene-lifestyle interactions and the risk of T2D among women with a history of GDM. These findings were in parallel to those reported in several studies in general population. For instance, in the DPP, intensive lifestyle interventions mitigated the excess T2D risk associated with a higher GRS for T2D.39 Furthermore, in both DPP40 and the Finnish Diabetes Prevention Study,41 intensive lifestyle interventions also mitigated the excess T2D risk associated with polymorphisms in TCF7L2—a leading T2D risk loci in general population. Our findings suggest that even among women at substantially high risk, that is, women with a history of GDM, a healthier diet may help to mitigate the excess genetic risk of T2D.
This study has several unique strengths. First, this is the largest study on GRS and the risk of developing T2D among women with a history of GDM,11 conferring stronger statistical power than previous studies. Second, including two independent populations increased the robustness of our findings. Third, the DWH Study and the constituting cohorts collected extensive data on non-genetic risk factors of T2D, which allowed us to examine potential effect modification by non-genetic risk factors of T2D—the first of such investigations among women with a family history of GDM. Lastly, the long study follow-up, an average of 21 years in the NHSII and 13 years in DNBC, presumably allowed us to capture a larger proportion of women who would eventually develop T2D. In comparison, existing studies either had less than 5 years of follow-up after the GDM pregnancy10–12 or missed T2D cases which occurred within the first decade after the GDM pregnancy.13
Our study also has a few potential limitations. First, because our T2D SNPs were selected and genotyped a few years ago using the best evidence present at that time, our GRS may not capture all the SNPs confirmed in the most recent GWAS meta-analysis.31 However, 42 out of the 59 SNPs were either directly confirmed in the more recent GWAS meta-analyses31 37 or are strongly linked with a confirmed SNP. Sensitivity analysis using a GRS including these 42 SNPs yielded similar results as the GRS including the 59 SNPs. Second, despite being the largest genetic study by far on T2D among women with GDM, our study may be not sufficiently powered to examine the associations of individual T2D SNPs in relation to the risk of developing T2D. Third, due to lack of information on the date of GDM or T2D diagnosis in a fraction of our sample, we were not able to perform time-to-event analysis. Among women with data on time to event available, adjustment for duration of follow-up did not alter the association between the GRS and T2D risk in either cohort. In addition, in DNBC, dietary data were collected only once at a clinical exam 9–16 years after the index pregnancy, which may not necessarily reflect habitual diet from the index pregnancy to T2D. Lastly, the generalizability of our findings to non-white populations warrants further investigation. However, the homogeneity of our population minimized potential bias due to population stratification.
Conclusions
In this study based on two independent populations with a long follow-up period, we observed a significant association of genetic risk factors with the development of T2D. The magnitude of association, however, was modest. There was also suggestive evidence that a healthful dietary pattern might mitigate the excessive risk of T2D related to greater genetic susceptibility, which supports public health efforts of encouraging a healthful diet to prevent T2D among the high-risk population—women with a history of GDM.
References
Footnotes
ML and MLR contributed equally.
Contributors CZ obtained the funding, designed the Diabetes & Women’s Health Study and oversighted the study. JEC, AL, SFO, LGG, ACBT, JLM, EY, AV, FBH and CZ made substantial contribution to the acquisition of data. ML and JW conducted data analysis. ML and MLR drafted the manuscript. ML, MLR, JW, MD, JEC, YL, SHL, WB, LGG, SNH, ACBT, EY, REG-L, SS, LH, FBK, AAB, PD, FT-A, AL, JLM, AV, SFO, FBH and CZ contributed to the interpretation of data and revised the article critically for important intellectual content. All authors gave final approval of the version to be published. CZ and ML are responsible for the integrity of the work as a whole.
Funding This work was supported by the Intramural Research Program of the Eunice Kennedy Shriver National Institute of Child Health and Human Development (NICHD) at the National Institutes of Health (contract numbers HHSN275201000020C, HHSN275201500003C, HHSN275201300026I, HSN275201100002I). The Nurses’ Health Study II cohort is supported by the National Institutes of Health (grant number R01 CA67262, UM1 CA176726, R01 CA50385, and NICHD contract HHSN275201000020C). Financial support for the Danish component was received from: March of Dimes Birth Defects Foundation (6-FY-96-0240, 6-FY97-0553, 6-FY97-0521, 6-FY00-407), Innovation Fund Denmark (grant number 09-067124 and 11-115923, ‘Centre for Fetal Programming’), the Health Foundation (11/263-96), the Heart Foundation (96-2-4-83-22450) and EU (FP7-289346-EarlyNutrition). The content is solely the responsibility of the authors and does not necessarily represent the official views of the National Institutes of Health.
Competing interests None declared.
Patient consent for publication Not required.
Provenance and peer review Not commissioned; externally peer reviewed.
Data availability statement We have enforced a restriction on the data used in our analysis to protect the identity of the participants involved in the analysis. Please contact the corresponding author to access the data.