Article Text

Abstract
Objective The voltage-gated proton channel Hv1 has been proposed to mediate NADPH oxidase (NOX) function by regulating intracellular pH during respiratory bursts. In our previous work, we showed that Hv1 is expressed in pancreatic β cells and positively regulates insulin secretion. Here, we investigated the role of Hv1 in adipose tissue differentiation, metabolic homeostasis and insulin sensitivity using Hv1 knockout (KO) mice.
Design Mice with genetic deletion of Hv1 are treated with high-fat diet (HFD) similar to wild-type (WT) mice. Body weight gain, adiposity, insulin sensitivity and gene expressions in both adipose tissue and liver were analyzed.
Results Mice with genetic deletion of Hv1 display overt obesity with higher body weight gain and accumulation of adipose tissue compared with similarly HFD-treated WT. Hv1-deficient mice develop more glucose intolerance than WT, but no significant difference in insulin resistance, after fed with HFD. Deficiency of Hv1 results in a remarkable increase in epididymal adipocyte weight and size, while the gene expressions of proinflammatory factors and cytokines are obviously enhanced in the HFD-fed mice. Furthermore, the gene expression of Hv1 is increased in the HFD-fed mice, which is accompanied by the increase of NOX2 and NOX4. In addition, there is more severely diet-induced steatosis and inflammation in liver in KO mice.
Conclusion Our data demonstrated that lacking of Hv1 results in diet-induced obesity in mice through inflammation and hepatic steatosis. This study suggested that Hv1 acts as a positive regulator of metabolic homeostasis and a potential target for antiobesity drugs in therapy and may serve as an adaptive mechanism in cooperating with NOX to mediate reactive oxygen species for adipogenesis and insulin sensitivity.
- hepatic steatosis
- inflammation
- obesity
- adipogenesis
This is an open access article distributed in accordance with the Creative Commons Attribution Non Commercial (CC BY-NC 4.0) license, which permits others to distribute, remix, adapt, build upon this work non-commercially, and license their derivative works on different terms, provided the original work is properly cited, appropriate credit is given, any changes made indicated, and the use is non-commercial. See: http://creativecommons.org/licenses/by-nc/4.0/.
Statistics from Altmetric.com
Significance of this study
What is already known about this subject?
The voltage-gated proton channel Hv1 mediates NADPH oxidase (NOX) function by regulating intracellular pH during respiratory bursts.
In adipocytes excess nutrients activate pentose phosphate pathway, which is a major source of cellular NADPH and leads to NOX activation.
What are the new findings?
Hv1 deletion results in a marked body weight gain and adipose accumulation when nutrients are sufficient.
Hv1-deficient mice develop more glucose intolerance but no significant difference in insulin resistance compared with WT by nutritional challenge.
Hv1 deficiency contributes to hepatic steatosis and inflammation.
How might these results change the focus of research or clinical practice?
Hv1 as a regulator of metabolic homeostasis in adipose tissue plays an antiadipogenesis role in vivo.
Introduction
Obesity is caused by excess energy from glucose or fatty acids deposited as triglycerides (TG) in adipocytes and featured by adipocyte hypertrophy and macrophage accumulation, which is associated with inflammatory occurrence and insulin resistance.1–3 Previous study has shown that excess glucose and palmitate activate NADPH oxidase (NOX) and the pentose phosphate pathway (PPP), which is a major source of cellular NADPH and leads to NOX activation, instead of metabolized by mitochondrial oxidation in adipocytes.4 NOXs as membrane-bound enzyme complexes transfer electrons from NADPH to oxygen to generate superoxide.
Activities of NOXs are regulated by the self-feedback mechanisms through their electrogenic activities and sensitivities to intracellular pH.5–9 Henderson et al5–7 reported that the intracellular pH changes are associated with the activities of NOXs, which sustain the superoxide generation and can be limited by the movement of a compensating charge in human neutrophils, and they defined them as an H+-conducting channels. Furthermore, Morgan et al10 provided the first direct and strongest evidence that the voltage-gated proton channel Hv1 is essential for pHi regulation in individual cells, which is the first transporter to regulate pH during the phagocyte respiratory burst.9–11
Recently, reactive oxygen species (ROS) have been implicated as an important contributor to the pathogenesis of obesity-associated insulin resistance,12 which have a key role in the intracellular insulin signal transmission and exert a protective effect against the onset of diet-induced insulin resistance.13 14 Despite the close link between obesity, ROS production and NOX activity, the role of Hv1 in the onset of insulin resistance, adipocyte inflammation and recruitment of macrophages to adipose tissue during the development of obesity has not yet been explored.
Here, we investigated the metabolic phenotype of mice with genetic ablation of Hv1 and their response to high-fat diet (HFD) challenge. Our data demonstrated that on HFD feeding, Hv1-deficient mice were more sensitive to the development of diet-induced obesity and liver steatosis with the molecular signature of inflammation and NOX. We found, for the first time, that Hv1-deficiency sensitizes towards the development of metabolic disorders on nutritional challenge, and leads to obesity. Our data suggested that Hv1 may mediate NOX to regulate adipose tissue function and protect against obesity.
Experimental procedures
Animals and diets
Mice bearing a targeted disruption in the Hv1/VSOP (Hv1−/−/VSOP, backcrossed eight times) were kindly provided by Dr Y Okamura (School of Medicine, Osaka University), as previously described.15 WT mice (Hv1+/+/VSOP) were of the same genetic background (C57BL/6J). Animals were kept in a pathogen-free facility under a 12-hour light–dark cycle with access to water and a standard mouse diet (Lillico Biotechnology) at constant temperature (23°C). Genotyping was performed by PCR as described by Ramsey et al.11 For diet-induced obesity, mice were fed by an HFD containing 45% fat calories, 35% carbohydrate calories and 20% protein calories (4.73 kcal/g) (D12451; Research Diets) from 5 weeks of age for 16 weeks. Body weight was measured weekly.
Serum biochemistry
Blood glucose levels were measured from blood obtained from the tail vein after fasting 6 hours using an automated glucometer (One Touch, Johnson & Johnson, USA), and serum TG and total cholesterol (TC) concentrations were measured (BOMEI biotechnology, China), according to the manufacturer’s instructions. Serum insulin levels were measured using ELISA (Mercodia, Uppsala) according to the manufacturer’s instruction.
Insulin tolerance test (ITT) and glucose tolerance test (GTT)
ITT and GTT were performed after a 6-hour fast. Mice were injected intraperitoneally (ip) with biosynthetic human insulin (0.75 U/kg body weight) (Novo Nordisk A/S) or sterile 20% glucose in PBS (2 g/kg body weight). Plasma glucose levels were monitored at specified times after injection (One Touch, Johnson & Johnson, USA). Meanwhile, venous blood was collected after glucose ip injection at 0, 2, 5, 15 and 30 min in chilled heparinized tubes, immediately centrifuged, and the serum was stored at −80°C.
Tissue collection and histology
All animal tissues of liver and epididymal adipose were removed and weighed immediately. For Oil Red O (ORO) analysis, a portion comprising approximately one-fifth of each liver was embedded in optimum cutting temperature compound (Tissue-Tek, Sakura Finetek, USA), frozen on dry ice and stored at −80°C for future sectioning. Subsequently, serial 7 μm thick sections were collected on poly-D-lysine-coated slides. The sections were stained with ORO and hematoxylin (BASO) according to the manufacturer’s instruction. For histology, samples of liver and epididymal adipose were fixed in 4% buffered formalin, embedded in paraffin and cut into 5 µm sections for H&E. Adipocyte size was measured using ImageJ software. Epididymal adipose tissues for RNA extraction were snappily frozen in liquid nitrogen at the time of collection and later ground to a fine powder using a sterile pestle and mortar on liquid nitrogen.
Immunohistochemistry
Sections of formalin-fixed, paraffin-embedded tissue were incubated overnight at 4°C with CD68 rabbit polyclonal antibody (1:500 dilution; Proteintech). Sections were washed three times in PBS, incubated with a biotinylated goat antirabbit secondary antibody (Sigma-Aldrich) for 1 hour, and then added peroxide and peroxidase substrate. Macrophages were quantified by counting CD68-positive area. Stained slices were viewed under an inverted microscope (eclipse Ti, Nikon), using a digital imaging system (NIS-Elements, Nikon).
Quantitative real-time PCR
Total RNA was isolated from epididymal adipose using RNeasy Mini columns (Qiagen). Complimentary DNA was generated from 600 ng of RNA using One-Step gDNA removal and cDNA synthesis super mix (Transgen) in a 20 µL reaction mixture. Reactions were run in duplicate for each sample and quantified in a ViiA 7 real-time PCR system (Applied Biosystems). Ct values were normalized to the reference gene GAPDH, and the relative gene expression was calculated with the 2-△△Ct method.16 Gene-specific mouse primers were used as indicated in table 1.
Primer pairs sequences
Statistical analysis
All statistics were performed using SPSS V.20.0 software. Measurement data were represented as means±SEM. Comparison of the mean between groups was performed by t test. P values <0.05 were considered significant.
Results
Hv1 deficiency results in HFD-induced obesity in mice
To assess the effects of deletion of Hv1 on adipose tissue function and metabolic homeostasis in mice fed a HFD, we measured the body weight, glucose tolerance (GTT) and insulin tolerance (ITT) in several cohorts of WT (Hv1+/+) and KO (Hv1−/−) mice kept under HFD fed for a period of 16 weeks after 4 weeks normal-chow-diet (NCD) fed (figure 1A). Increased body size and adiposity after 16 weeks of HFD were clearly evident from anatomical examinations (figure 1B,C). There was no difference in body weight between KO and WT mice fed with NCD (figure 1D). However, on HFD challenge, KO mice displayed significantly elevated body weight as early as 3 weeks after the initiation of the HFD (figure 1D,E). The change in body weight in mice fed an HFD was increased twofold in KO mice compared with WT mice (figure 1E,F). Although HFD-fed KO mice presented slightly higher food intake than that of HFD-fed WT mice (figure 1G), the energy efficiency, which represents the ability to convert food into body mass and is defined as the ratio of the total weight gain to the total calorie intake during HFD feeding, was significantly increased in KO mice (figure 1H).
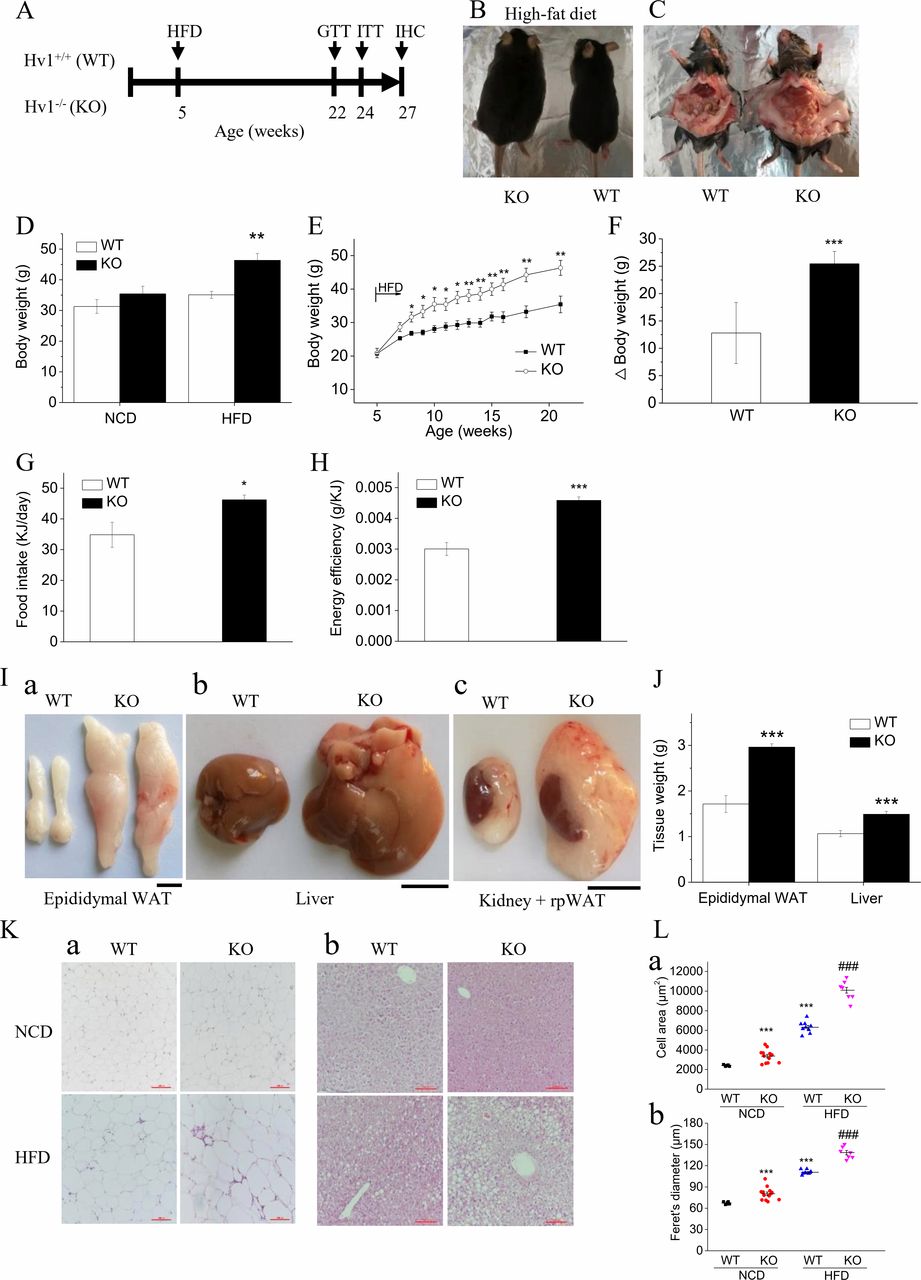
Deletion of Hv1 results in diet-induced obesity. (A) Experimental design. (B and C) Representative images of body size (B) and intra-abdominal fat (C) following 16 weeks of HFD feeding. (D) Body weight of WT and KO mice under 21 weeks of NCD (WT: n=15; KO: n=18) and under 5 weeks of NCD following with 16 weeks of HFD (WT: n=16; KO: n=12). (E) Time course of body weight for WT (n=16) and KO (n=12) littermates following 16 weeks of HFD feeding. (F) Body weight gain in WT and KO mice over the course of 16 weeks being fed high fat. (G) Food intake after introduction of 16 weeks HFD (WT: n=6; KO: n=6). (H) Energy efficiency in WT (n=6) and KO (n=7) mice being fed HFD. It expresses the ratio of the total weight gain to the total calorie intake during the 16 weeks experimental period on HFD feeding. (I) Representative images of separate epididymal white adipose depots (a), livers (b) and kidney+renal white adipose depots (c) from WT and KO mice following 16 weeks HFD feeding. Scale bars: 1 cm. (J) weight of epididymal white adipose tissue and livers, weighed immediately after dissection from WT (n=5) and KO mice (n=6) fed the HFD for 16 weeks. (K) Representative images of H&E staining of histological sections for epididymal white adipose tissue (a) and livers (b) from WT (NCD: n=5; HFD: n=5) and KO mice (NCD: n=6; HFD: n=7) fed the diets for 16 weeks after 5 weeks of normal chow feeding. Scale bars: 100 µm. (L) The area (a) and Feret’s diameter (b) of adipocytes were determined with H&E staining of histological sections. Results represent means±SEM. *P<0.05; **p<0.01; ***p<0.001 versus corresponding WT. ###P<0.001 versus WT mice fed with HFD. HFD, high-fat diet; NCD, normal chow diet; WT, wild type.
Consistent with the remarkable body weight gain, increased adipose accumulation after 16 weeks of HFD was clearly displayed by anatomical examinations of epididymal white adipose tissue (EWAT), liver and renal WAT (figure 1I). The EWAT and liver weight were increased 40% and 36% in KO mice compared with WT mice, respectively (figure 1I,J). The histological analyses revealed that KO mice had significant lipid droplets in WAT (figure 1K,a) and occurred with hepatic steatosis (figure 1K,b). EWAT of both NCD-fed and HFD-fed KO mice presented larger adipocytes compared with corresponding WT mice, analyzed by mean cell area and cell Feret’s diameter (figure 1L). This result demonstrated that Hv1 deficiency tend to result in white adipose tissue accumulation and overt obesity when challenged with HFD.
Diet-induced glucose intolerance and insulin resistance in Hv1-deficient mice
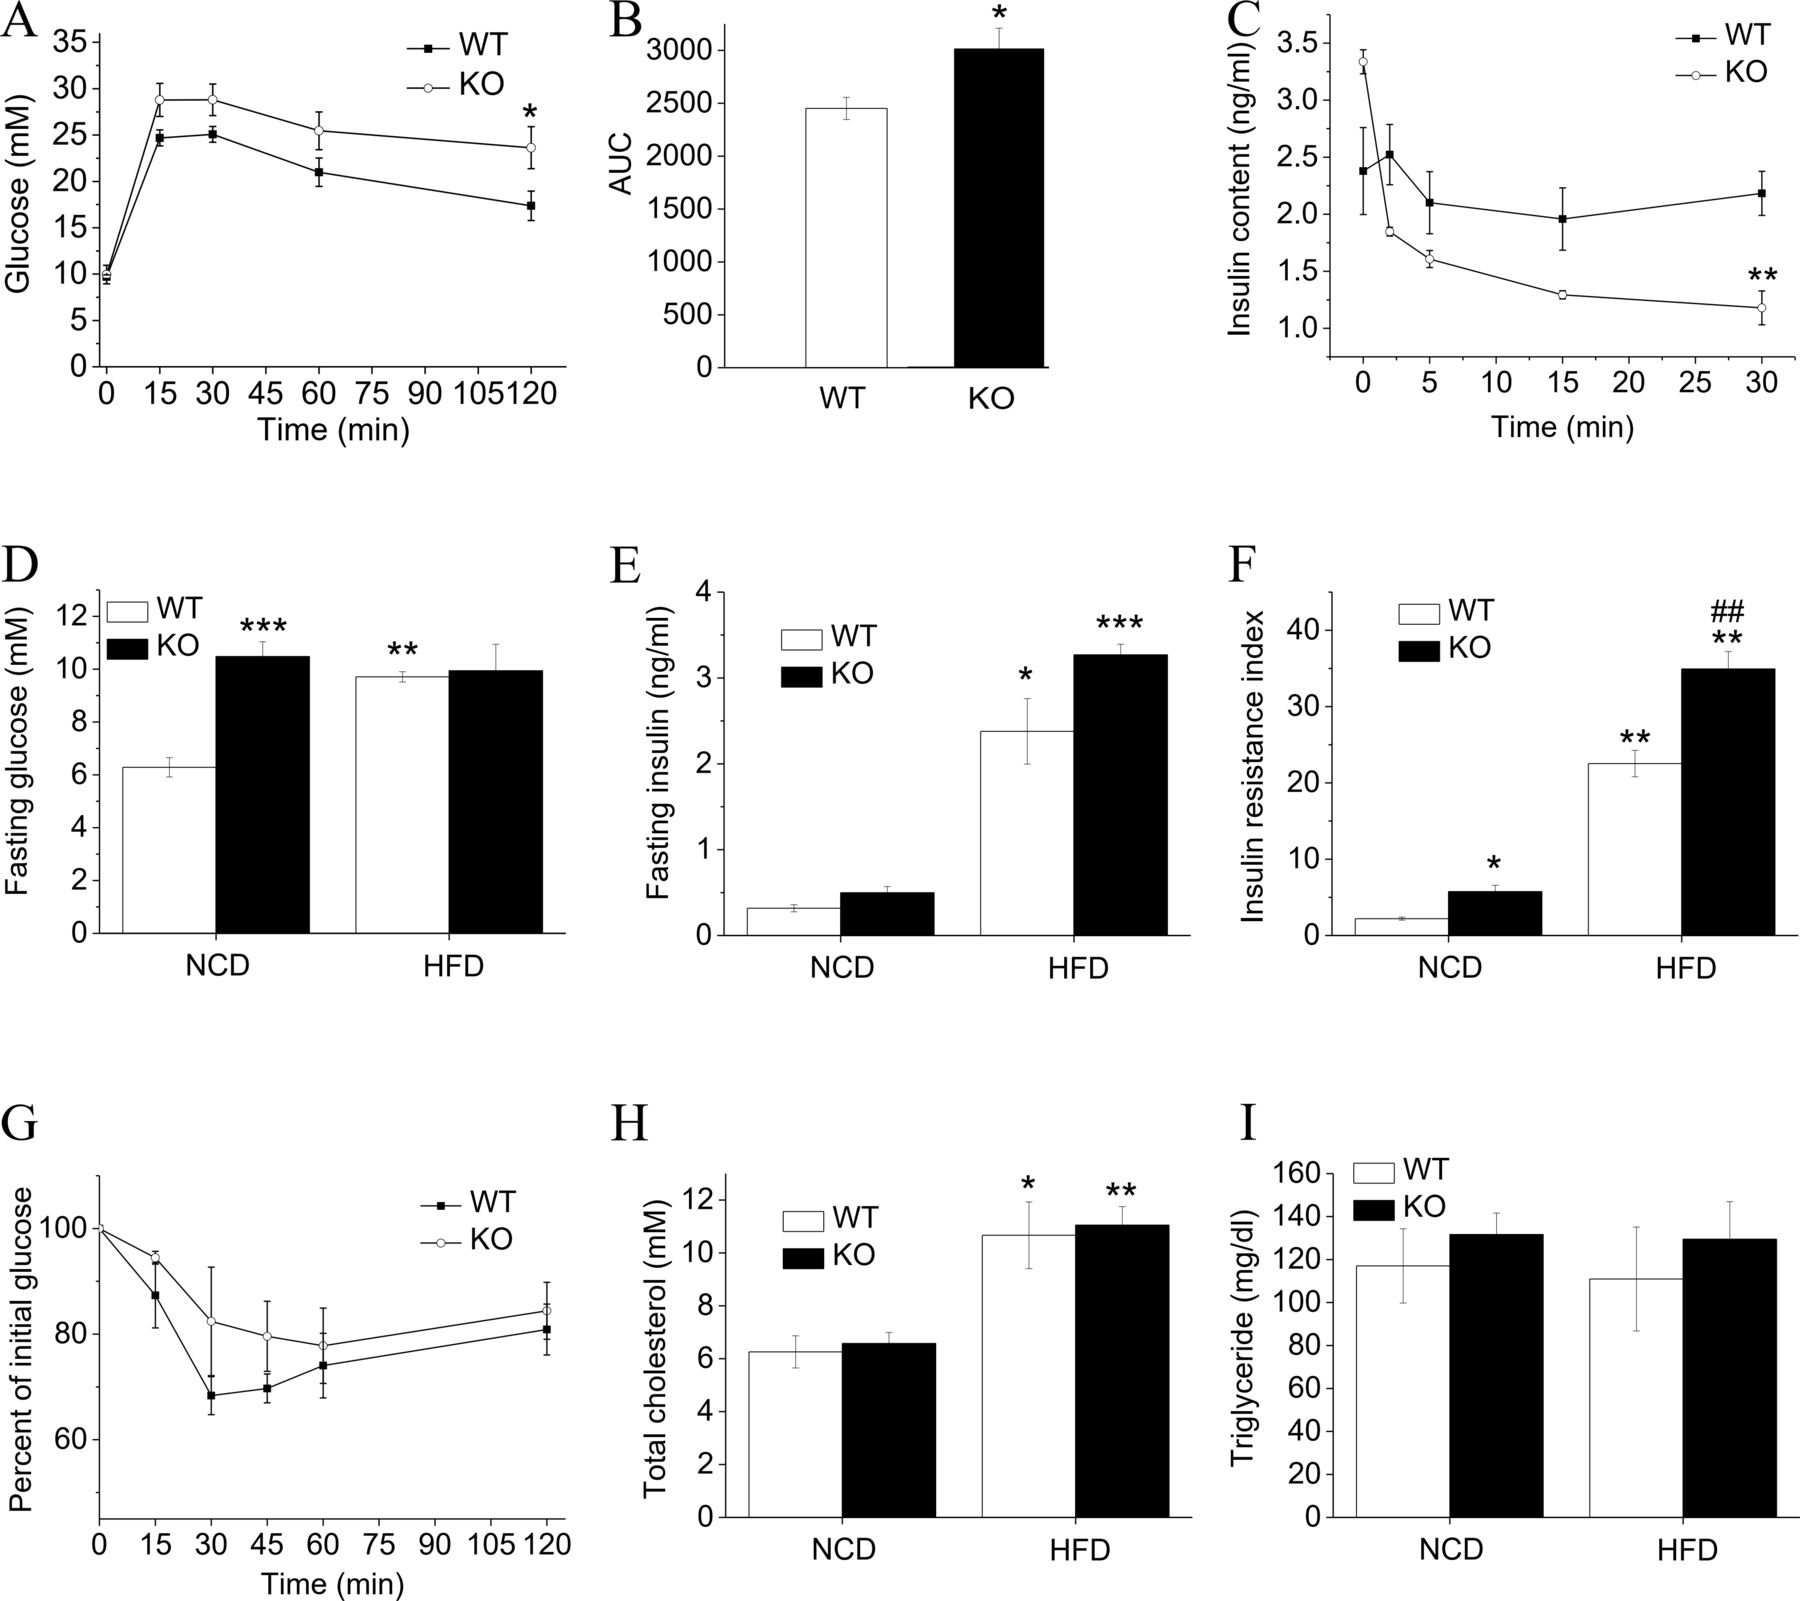
To evaluate the impact of Hv1 deficiency in mice on disposal of a glucose load when challenged with HFD, ip glucose tolerance tests (IPGTTs) were performed. Compared with WT mice fed an HFD, KO mice fed an HFD showed significantly higher glucose levels following an ip glucose load (2 g/kg body weight) (figure 2A,B), and the serum insulin contents after ip glucose were also measured (figure 2C). Unexpectedly, Hv1-deficient mice displayed a slightly higher serum insulin level compared with WT before ip glucose (figure 2C,E), but the levels were decreased dramatically after the glucose challenge, providing evidence for an insulin secretion defect in response to glucose (figure 2C). This result is consistent with our previous study that Hv1 deficiency inhibits the glucose-induced insulin secretion in pancreatic β cells.17 HFD induced an obvious increase in serum glucose levels for WT mice, but almost no difference for KO mice between before and after fed an HFD (figure 2D). Meanwhile, the serum glucose levels were nearly no difference between KO and WT mice fed an HFD for 16 weeks (figure 2D). The HOMA-IR (homeostasis model assessment- insulin resistance) value calculated from serum glucose and insulin levels for KO mice was higher than that of WT mice after 16 weeks of HFD (figure 2F), which seems to show a more severe tendency in insulin resistance in KO mice than WT mice: however, the curves for IPITT are similar, and the slight difference is not significant (figure 2G). HFD induced higher serum TC levels in both WT and KO mice, but there was no difference in WT and KO mice in this response (figure 2H). The TG levels were no difference between both WT and KO mice fed an HFD or an NCD (figure 2I).

Glucose and insulin homeostasis in WT and KO mice fed with HFD. (A) Glucose tolerance test (GTT; 2 g/kg glucose, intraperitoneally (ip)) for WT (n=6) and KO (n=7) mice following 16-week HFD feeding. (B) Area-under-curve of GTT. (C) Time-dependent serum insulin content of WT (n=6) and KO (n=7) mice being fed with HFD after ip glucose (2 g/kg glucose). (D–F) Fasting serum glucose concentration (D), fasting insulin content (E) and insulin resistance index (HOMA-IR) (F) for WT and KO mice under 21 weeks of NCD (WT: n=9; KO: n=11) and under 5 weeks of NCD following with 16 weeks of HFD (WT: n=10; KO: n=10). HOMA-IR was calculated as follows: fasting glucose (mmol/L)×fasting insulin (mU/L)/22.5. (G) Insulin tolerance test (ITT; 0.75 U/kg, ip) for WT (n=5) and KO (n=5) mice following 16-week HFD feeding. (H and I) Serum total cholesterol (H) and triglyceride (I) from WT (NCD: n=5; HFD: n=5) and KO mice (NCD: n=4; HFD: n=6). Data are presented as means±SEM. *P<0.05; **p<0.01; ***p<0.001 versus WT. ##P<0.01 versus WT mice fed with HFD. HFD, high-fat diet; NCD, normal chow diet; WT, wild type.
Loss of Hv1 leads to inflammation in adipose tissue
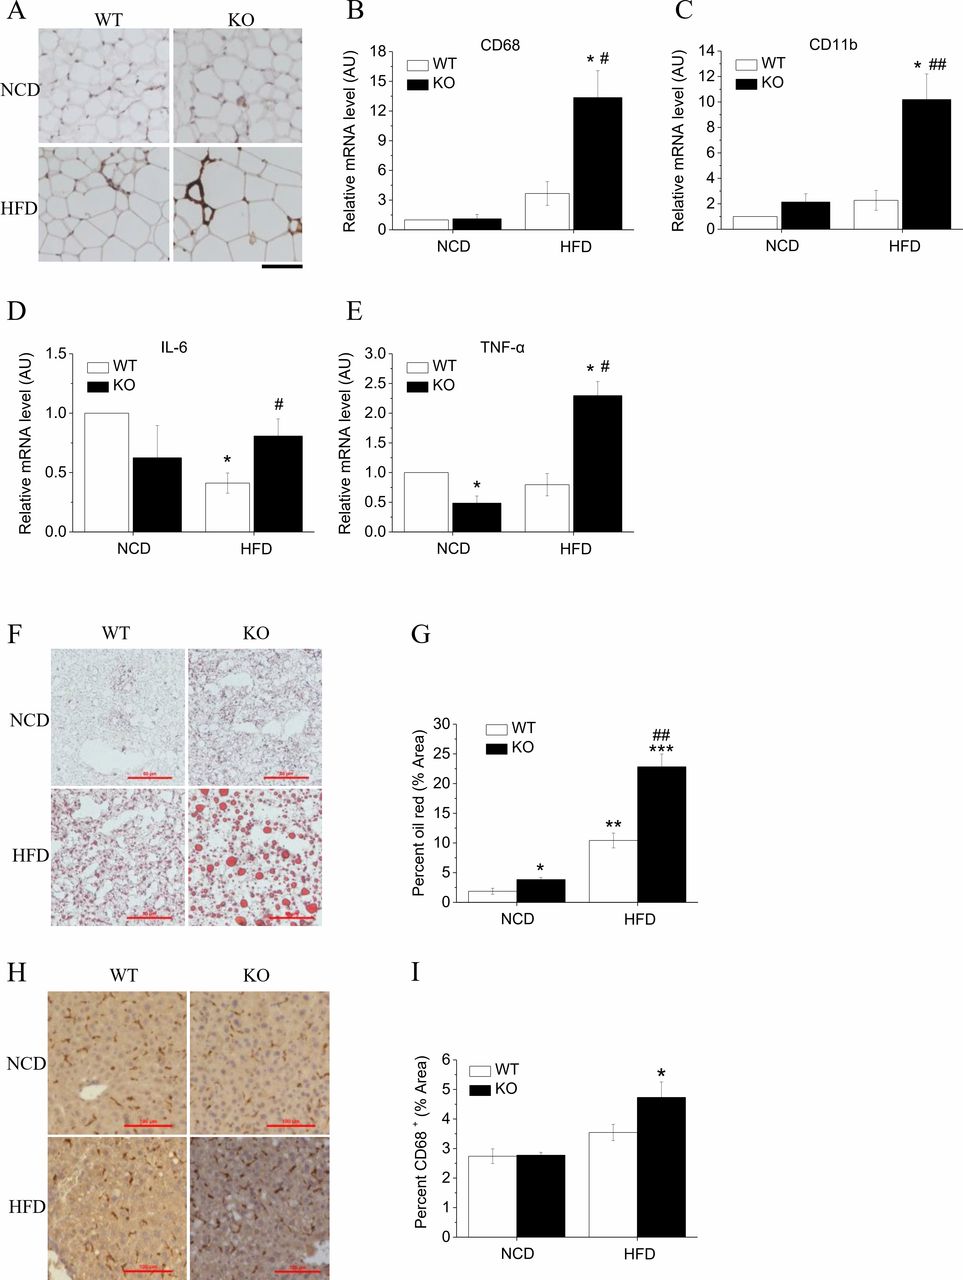
Hypertrophic adipose tissue is characterized by insufficient blood supply relative to the increased demand triggering the onset of hypoxia, followed by macrophage infiltration and an elevation in inflammatory cytokine production.18 19 The immunohistochemical staining revealed that EWAT from KO mice fed an HFD had more accumulated cells that reacted with CD68 antibody (figure 3A), indicating that an accumulation of macrophage occurred. In KO mice fed an HFD, the expressions of macrophage infiltration-related genes CD68 (figure 3B) and CD11b (figure 3C) in adipocytes were upregulated 3.3-fold and 4-fold, respectively, compared with corresponding WT mice. Hv1 knockout mice showed lower levels of interleukin (IL)-6, while the expression level was higher than that in WT group after fed with HFD (figure 3D). The proinflammatory factor Tumor Necrosis Factor α(TNF-α was also downregulated in KO mice, while challenged with HFD, KO mice had an increase compared with the corresponding WT mice (figure 3E). These results revealed that there is a trend toward lower levels of cytokine expression in Hv1-deficient mice, but when fed with HFD, leads to inflammation in KO mice.

HFD-induced adipose and liver tissue inflammation and fat accumulation in Hv1-deficient mice. (A) Representative images of immunohistochemistry staining of epididymal adipose sections using CD68 antibody. Scale bars: 100 µm. (B–E) Quantitative RT-PCR analyses of macrophage markers CD68 (B) and CD11b (C), and cytokines interleukin-6 (D) and TNF-α (E) for epididymal adipose tissues from WT and KO mice under 21 weeks of NCD (WT: n=5; KO: n=5,) and under 5 weeks of NCD following with 16 weeks of HFD (WT: n=5; KO: n=5), normalized to WT mice fed with NCD. (F and G) Representative images of liver sections stained by ORO (F) and oil red area calculated as a percentage of the total area (G), from WT (NCD: n=3; HFD: n=3) and KO mice (NCD: n=3; HFD: n=3) under 21 weeks of NCD and under 5 weeks of NCD following with 16 weeks of HFD. Scale bars: 50 µm. (H and I) Representative images of liver immunohistochemistry stained by CD68 antibody (H) and the stained percentage from WT (NCD: n=6; HFD: n=6) and KO mice (NCD: n=5; HFD: n=5) fed with HFD for 16 weeks after 5 weeks of NCD feeding, and under 21 weeks of NCD only. Scale bars: 100 µm. Data are shown as means±SEM. *P<0.05; **p<0.01; ***p<0.001 versus WT mice fed with NCD. #P<0.05; ##p<0.01 versus WT mice fed with HFD. HFD, high-fat diet; NCD, normal chow diet; WT, wild type.
HFD-induced liver steatosis in Hv1-deficient mice
Obesity is associated with the occurrence of non-alcoholic fatty liver disease, characterized by intrahepatic TG accumulation. We quantified TG levels in liver tissue using ORO staining. In line with their adiposity, elevated hepatic TG storage in the form of small lipid droplets was observed in HFD-fed KO mice (figure 3F). The percentage of red area was increased twofold in HFD-fed KO compared with HFD-fed WT mice (figure 3G). Correspondingly, the cells reacted with CD68 antibody were accumulated more severely in liver in HFD-fed KO mice compared with WT mice (figure 3H,I), which also provides an evidence for HFD-induced obesity in Hv1 KO mice.
HFD induces upregulation of leptin in KO mice
Obesity is associated with adipokine expressions such as leptin and adiponectin. Therefore, we measured the expression levels of leptin and adiponectin in EWAT. There was a higher level of leptin expression in KO mice fed an HFD compared with corresponding WT mice (figure 4A), whereas the expression level of adiponectin had a slight reduction in KO mice compared with WT mice (figure 4B). Previous study showed that in diet-induced obese mice and the most greatly obese humans, the leptin is not deficient, and leptin administration is totally inefficient.20 These results led to the concept of leptin resistance, which is used to define states of obesity with hyperleptinemia and/or a decreased response to leptin treatment. Therefore, our results indicated that knockout of Hv1 may contribute to the development of obesity-related leptin resistance.

Loss of Hv1 results in HFD-induced upregulations of leptin, NOX2 and NOX4, and possible mechanisms of Hv1 in regulation of cell metabolism. (A–E) Quantitative RT-PCR was used to determine levels of leptin (A), adiponectin (B), and Hv1 (C), NOX4 (D) and NOX2 (E) mRNA in epididymal adipose tissue from NCD-fed and HFD-fed mice (WT: n=5, WT; KO: n=5, KO), normalized to NCD-fed WT mice. Data are presented as means±SEM. *P<0.05 versus NCD-fed WT mice. #P<0.05 versus HFD-fed KO mice. (F) The possible mechanism that Hv1 regulates adipocyte metabolism. Excess glucose activates the pentose phosphate pathway (PPP) by insulin signal in adipocytes, which is a major source of cellular NADPH and leads to NOX activation. NOXs transfer electrons from NADPH to oxygen with the cooperation of Hv1 to extrude proton, generating superoxide and H2O2. Hv1 exerts a protective effect against the onset of diet-induced insulin resistance and adipogenesis in adipocytes. (G) The possible mechanism that loss of Hv1 leads to HFD-induced obesity. Deficiency of Hv1 contributes to HFD-induced obesity and insulin resistance, which results in increased adipocyte differentiation and hypertrophy and gives rise to WAT accumulation, macrophage infiltration in vivo. These alterations are latent but can be brought into light by nutritional challenge resulting in overt obesity, insulin resistance and hepatic steatosis. HFD, high-fat diet; NCD, normal chow diet; WT, wild type.
Upregulation of NOX2 and NOX4 in adipose tissue in diet-induced Hv1-deficient mice
NOXs transfer electrons from NADPH to oxygen with the cooperation of Hv1 to extrude proton, generating superoxide and H2O2. NOX4 has been shown to mediate insulin-induced glucose uptake in adipocytes.21 To further investigate the mechanism that lacking of Hv1 results in HFD-induced obesity, the expression levels of Hv1 and NOXs were assessed. As shown in figure 4C, the expression level of Hv1 was improved in EWAT in mice fed an HFD. In line with previous data,21 22 NOX4 expression was upregulated in diet-induced WT mice (figure 4D). In KO mice, the expression level of NOX4 was much higher than that of WT mice when challenged with sufficient nutrition (figure 4D). Interestingly, we found that NOX2 was expressed at a high level in adipocytes in KO mice fed an HFD, which was increased 2.3-fold compared with the corresponding WT mice (figure 4E). These data suggested that Hv1 may protect against obesity mediated by NOX2 the major isoform in adipocytes in mice.
Discussion
We found for the first time that loss of Hv1 leads to HFD-induced obesity, accompanied with macrophage accumulation, upregulations of inflammatory factors, cytokines, NOX2 and NOX4 in adipose tissue and hepatic steatosis. Our in vivo and in vitro data demonstrated a new function of Hv1 as a positive regulator of metabolic homeostasis and a potential target for antiobesity drugs in therapy.
In obesity, adipocytes secrete chemotactic factors, contributing to recruitment of immune cells, such as macrophages.23–25 Both adipocytes and macrophages secrete numbers of proinflammatory molecules, such as TNF-α, leptin and IL-6, which lead to insulin resistance and chronic low-grade inflammation.26–28 In line with previous studies, our results also showed that HFD-induced obesity in Hv1 KO mice is accompanied with the accumulation of macrophages and inflammation in adipose tissue and liver. Our present data demonstrated that lacking of Hv1 contributes to diet-induced overt obesity through tissue inflammation and accumulation of macrophages.
Leptin as an adipose signaling molecule has been investigated in depth. The studies on leptin changed the idea of adipose tissue as an energy depot to a highly active endocrine organ.20 Leptin plays an inhibitory effect on appetite by implicating in central nervous system.29 Leptin resistance participates in the pathogenesis of diet-induced obesity,30 which is the main cause of obesity in humans. In our present study, knockout of Hv1 remarkably promotes the gene expression of leptin and obesity in mice fed an HFD. This result suggested that deficiency of Hv1 may give rise to diet-induced leptin resistance in mice, which contributes to obesity in Hv1 KO mice.
In adipocytes excess nutrients activate PPP, which is a major source of cellular NADPH and leads to NOX activation.4 Meanwhile, highly metabolic activity and accumulation of a large transmembrane outward electrochemical gradient for H+ promote intracellular acidification of adipose cells. To maintain the activity of NOX and ensure adipocyte normal metabolism, it is necessary to efficiently contend against accumulation of intracellular H+. Previous study proposed a modulating effect of Na+/H+ exchanger on the metabolic response of rat brown adipose tissue.31
Our present work showed that Hv1 is expressed in epididymal white adipose tissue, and the expression level is increased when the mice face the challenge of excess nutrition. Meanwhile, we found that both NOX4 and NOX2 are expressed at a high level in adipocyte in HFD-fed Hv1 KO mice. Our results suggested that Hv1 may be involved in ROS generation in adipose cells when challenged with nutrition. So we hypothesize a possible mechanism of Hv1 in regulating adipocyte metabolism: NOX transfers electrons from NADPH to oxygen with the cooperation of Hv1 to extrude proton to prevent intracellular acidification at the same time generating superoxide and H2O2 (figure 4F). The relationship between Hv1 and ROS production, which has been studied in depth, especially in phagocytes, forms the basis for the hypothesis and the intellectual framework for the interpretation of our results.5–7 10
In summary, our data demonstrated that Hv1 protects against obesity through reducing inflammation and macrophage accumulation in adipose tissue. The mice deleted Hv1 do not present an obvious phenotype when kept in normal conditions but have a latent tendency of obesity and insulin resistance. When challenged by stress events, for example, HFD feeding, they are brought into light. The effects of Hv1 deficiency on the development of HFD-induced obesity and insulin resistance are depicted in figure 4G. Along this line, upregulation of Hv1 expression in obese adipose tissue may be regarded as a counter-regulatory mechanism to prevent adipose tissue hypertrophy and tissue inflammation.
Acknowledgments
We would like to thank Dr Y Okamura (School of Medicine, Osaka University) for providing Hv1/VSOP KO mice.
References
Footnotes
Contributors HP and SJL conceived and designed the study. All authors performed the experiments. HP and SJL wrote the paper. SJL and HP reviewed and edited the manuscript. All authors were involved in data analysis, read and approved the manuscript.
Funding This work was supported by National Natural Science Foundation of China (No. 31271464).
Competing interests None declared.
Patient consent for publication Not required.
Provenance and peer review Not commissioned; externally peer reviewed.
Data availability statement All data relevant to the study are included in the article or uploaded as supplementary information.