Article Text

Abstract
Introduction Insomnia is a novel pathogen for type 2 diabetes mellitus (T2DM). However, mechanisms linking insomnia and T2DM are poorly understood. In this study, we apply a network Mendelian randomization (MR) framework to determine the causal association between insomnia and T2DM and identify the potential mediators, including overweight (body mass index (BMI), waist-to-hip ratio, and body fat percentage) and glycometabolism (HbA1c, fasting blood glucose, and fasting blood insulin).
Research design and methods We use the MR framework to detect effect estimates of the insomnia–T2DM, insomnia–mediator, and mediator–T2DM associations. A mediator between insomnia and T2DM is established if MR studies in all 3 steps prove causal associations.
Results In the Inverse variance weighted method, the results show that insomnia will increase the T2DM risk (OR 1.142; 95% CI 1.072 to 1.216; p=0.000), without heterogeneity nor horizontal pleiotropy, strongly suggesting that genetically predicted insomnia has a causal association with T2DM. Besides, our MR analysis provides strong evidence that insomnia is causally associated with BMI and body fat percentage. There is also suggestive evidence of an association between insomnia and the waist-to-hip ratio. At the same time, our results indicate that insomnia is not causally associated with glycometabolism. Higher BMI, waist-to-hip ratio, and body fat percentage levels are strongly associated with increased risk of T2DM.
Conclusions Genetically predicted insomnia has a causal association with T2DM. Being overweight (especially BMI and body fat percentage) mediates the causal pathway from insomnia to T2DM.
- diabetes mellitus
- type 2
- body mass index
Data availability statement
All data relevant to the study are included in the article or uploaded as online supplemental information.
This is an open access article distributed in accordance with the Creative Commons Attribution Non Commercial (CC BY-NC 4.0) license, which permits others to distribute, remix, adapt, build upon this work non-commercially, and license their derivative works on different terms, provided the original work is properly cited, appropriate credit is given, any changes made indicated, and the use is non-commercial. See: http://creativecommons.org/licenses/by-nc/4.0/.
Statistics from Altmetric.com
Significance of this study
What is already known about this subject?
Much previous epidemiological evidence has indicated the link between insomnia and type 2 diabetes (T2DM).
Insomnia serves as a novel causal risk factor for T2DM.
What are the new findings?
The genetically predicted insomnia has a causal association with T2DM.
Insomnia is not causally associated with glycometabolism.
Being overweight (especially body mass index and body fat percentage) mediates the causal pathway from insomnia to T2DM.
How might these results change the focus of research or clinical practice?
Strategies to reduce insomnia, especially for the overweight population, are cornerstones in preventing T2DM.
Introduction
Insomnia is a significant public health problem affecting 10%–30% of the general population.1 It can be a symptom of many medical, neurological, and mental disorders. As a disorder, it incurs substantial healthcare and occupational costs.2 3 Type 2 diabetes mellitus (T2DM) is a chronic condition that describes a group of metabolic disorders characterized by insulin resistance.4 Nowadays, half a billion people are living with diabetes worldwide, and the number is projected to increase by 25% in 2030 and 51% in 2045.5 Evidence from observational studies indicates that patients with insomnia have a higher risk of T2DM.6 7 More importantly, recently, two specific Mendelian randomization (MR) studies support findings for an adverse effect of genetically predicted insomnia on T2DM risk,8 9 indicating that insomnia is a novel pathogen for T2DM. However, mechanisms linking insomnia and T2DM are poorly understood. The causality between insomnia and T2DM are unclear, and the underlying mechanism values further investigation.
MR uses genetic variants as instrumental variables (IVs) to infer whether a risk factor causally affects a clinical outcome.10 11 The MR technique diminishes confounding by environmental factors because alleles are randomly allocated when passed from parents to offspring at conception. It avoids reverse causation bias because the disease can not affect genotype.12 The causality between insomnia and T2DM and the potential pathway have not been thoroughly investigated. In this study, the causality between insomnia and T2DM is identified by a network MR framework. Besides, we also explore the potential mediators, including overweight (body mass index (BMI), waist-to-hip ratio, and body fat percentage) and glycometabolism (HbA1c, fasting blood glucose, and fasting blood insulin).
Research design and methods
Summary of GWAS data
We apply the UK Biobank+23andMe consortium for insomnia analysis.1 In UK Biobank, insomnia is defined by self-reported information collected via a questionnaire on a touchscreen device and while in 23andMe, an online questionnaire survey defines insomnia. They include 1 331 010 individuals (all European ancestry, 386 533 (109 402 patients and 277 131 non-patients) from UK Biobank and 944 477 (288 557 patients and 655 920 non-patients) from 23andMe).1 Besides, data from Xue A are used for T2DM,13 MRC-IEU consortium data are used for BMI, GIANT consortium data are used for waist-to-hip ratio,14 Neale consortium data are used for body fat percentage, data from Pan-UKB team are used for glycated hemoglobin (HbA1c), and data from Wojcik GL are used for fasting blood glucose and fasting blood insulin.15 More details of studies and datasets used for analysis are presented in table 1.
Details of studies and datasets used for analysis
Data extraction
As we describe, we extract the following data for each single-nucleotide polymorphisms (SNPs) from GWAS of the following outcomes: the effect allele (EA), effect allele frequency (EAF), Beta value, SE, SNP, and p value.16 We select SNPs which are shown to be associated with the insomnia trait at the level of genome-wide significance (p<5×10⁻⁸). We also request the following metrics of SNP genotype quality from disease and risk factor studies: strong evidence of between-study heterogeneity in the SNP–trait association (p≤0.001), Hardy-Weinberg disequilibrium (p≤0.001), or imputation quality metric (info or r2)≤0.90. Characteristics of the SNPs associated with insomnia and their associations with T2DM are shown in online supplemental table 1.
Supplemental material
Two-sample MR and causality analysis
MR can be used to assess the causal effect of an exposure on an outcome using genetic variants as IVs.17 18 We explore the associations in the following scenarios.19 (1) Causality: The conventional MR approach (Inverse variance weighted, IVW) method, MR Egger method, Weighted median method, Simple mode method, and Weighted mode are used. (1.1) Causality between genetically determined insomnia and T2DM. (1.2) Causality between genetically determined insomnia and potential mediators including overweight (BMI, waist-to-hip ratio, and body fat percentage) and glycometabolism (HbA1c, fasting blood glucose, and fasting blood insulin). (1.3) Causality between genetically determined mediators and T2DM. (2) Heterogeneity: To solve the heterogeneity problem, we follow the previous protocol to determine the final tally of SNPs for inclusion in genetic instruments.20 (3) Horizontal pleiotropy: We assess it by MR-Egger intercept. (4) Leave-one-out analysis: It is applied to conduct the sensitivity. (5) Funnel plots: A tool used in meta-analysis is the funnel plot in which the estimate for a particular SNP is plotted against its precision.21 Asymmetry in the funnel plot may be indicative of violations of the assumption through horizontal pleiotropy.
The ‘causal’ relationship is considered established if the observed association passes the IVW method without horizontal pleiotropy.
Network MR analysis for ‘insomnia–mediator–T2DM’
We apply the MR framework with two-sample MR and network MR design to detect the causality of insomnia–T2DM, insomnia–mediator, and mediator–T2DM.22 23 There are three two-sample MR tests in a network MR analysis: (1) the causality between genetically determined insomnia and T2DM; (2) the causality between genetically determined insomnia and the potential mediators; (3) the causality between the possible mediators on T2DM.
A mediator between insomnia and T2DM is established if MR studies in all three steps prove causal associations.
Statistical analysis
All analyses were performed using the Two Sample MR platform19 (http://app.mrbase.org). The F-statistic is estimated to examine the strength of the genetic instrument for each exposure, and an F-statistic above 10 is considered a sufficiently strong instrument. All the F-statistic in this MR study is above 10. We follow previous researchers’ statistical analysis way.24 The p value<0.007 (where α=0.05/7 outcomes) is considered strong causal association evidence. Also, p value between 0.05 and 0.007 is regarded as suggestive evidence of association.
Results
Causality between genetically determined insomnia and T2DM
We use the UK Biobank+23andMe consortia for insomnia to explore the causal associations between genetically determined insomnia and T2DM. In the IVW method, the causal estimate using 127 SNPs as IVs shows that insomnia will increase the risk of T2DM (OR 1.142; 95% CI 1.072 to 1.216; p=0.000) (table 2 and figure 1A). Results are consistent in weighted median method (OR 1.187; 95% CI 1.122 to 1.256; p=0.000), simple mode method (OR 1.244; 95% CI 1.044 to 1.482; p=0.016), and weighted mode method (OR 1.221; 95% CI 1.049 to 1.422; p=0.011) (table 2). The intercept of MR-Egger regression for these 127 SNPs is not statistically significant (p=0.859), suggesting no directional pleiotropy. The leave-one-out analysis (figure 1C) and funnel plot (figure 1D) indicate no SNPs exhibit horizontal pleiotropy.
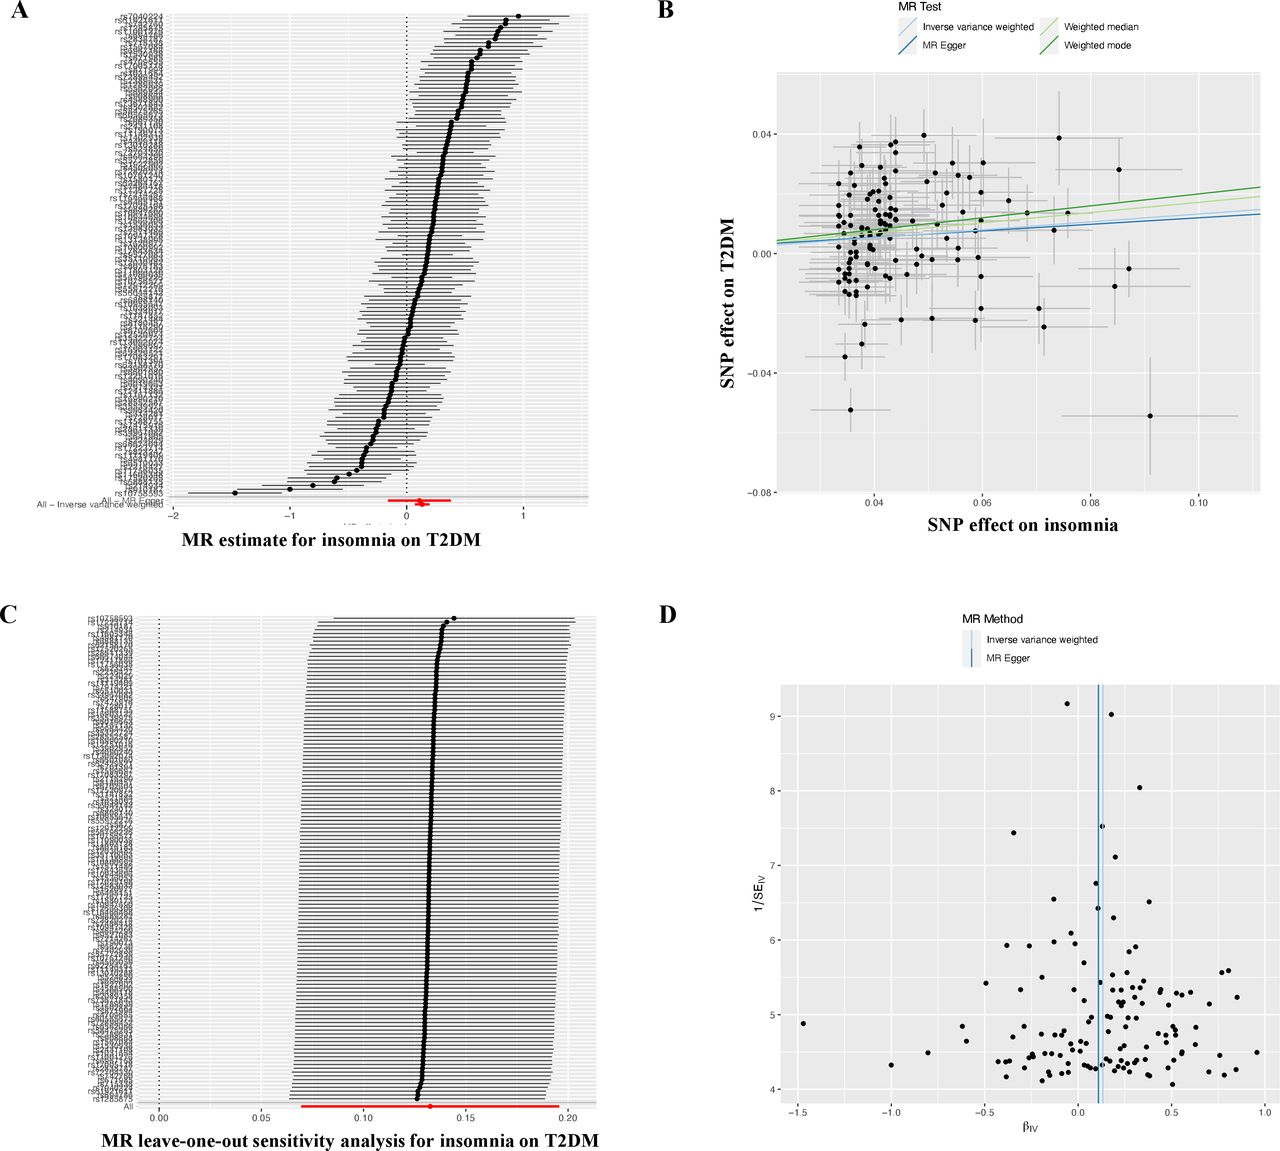
Mendelian randomization study of the effect of insomnia on type 2 diabetes. (A) Forest plots of causal effects between insomnia and risk of type 2 diabetes. The red points showed the combined causal estimate using all SNPs together in a single instrument, using two different methods (MR-Egger and inverse-variance weighted). Horizontal lines denote 95% CIs. (B) Scatter plots. The slopes of each line in the scatter plot represent the causal association for each method. (C) Leave-one-out sensitivity analysis. Each black point represents the IVW MR method applied to estimate the causal effect, excluding that particular variant from the analysis. The red point depicts the IVW estimate using all SNPs. There are no instances where the exclusion of one particular SNP leads to dramatic changes in the overall result. (D) Funnel plots. Vertical lines show the causal estimates using all SNPs combined into a single instrument for the two different methods. Asymmetry in the funnel plot may be indicative of violations of the assumption through horizontal pleiotropy. IVW, Inverse‐variance weighted; MR, Mendelian randomization; SNP, single-nucleotide polymorphism; T2DM, type 2 diabetes mellitus.
Causal associations between genetically determined insomnia and T2DM
To sum up, our MR analysis provides strong evidence that genetically predicted insomnia has a causal association with T2DM.
Causality between genetically determined insomnia and potential mediators
Table 3 show the causal estimates between genetically determined insomnia and potential mediators, including overweight (BMI, waist-to-hip ratio, and body fat percentage) and glycometabolism (HbA1c, fasting blood glucose, and fasting blood insulin). The MR analysis provides strong evidence that insomnia is causally associated with BMI (Beta, 0.075; SE, 0.014; p=0.000) and body fat percentage (Beta, 0.064; SE, 0.011; p=0.000). There is also suggestive evidence of an association between insomnia and waist-to-hip ratio (Beta, 0.031; SE, 0.012; p=0.011). At the same time, our results indicate that insomnia is not causally associated with glycometabolism (HbA1c, fasting blood glucose, and fasting blood insulin, all p>0.05).
Causal association between genetically determined insomnia and potential mediators
To sum up, being overweight (especial BMI and body fat percentage) but not glycometabolism may mediate the causal pathway from insomnia to T2DM.
Causality between genetically determined mediators and T2DM
We further evaluate whether overweight (BMI, waist-to-hip ratio, and body fat percentage) is associated with T2DM using MR analysis. We use the IVs of 332 SNPs, 20 SNPs, and 195 SNPs associated with BMI, waist-to-hip ratio, and body fat percentage. As we expected, higher BMI, waist-to-hip ratio, and body fat percentage levels are strongly associated with increased risk of T2DM (BMI: OR 2.932, 95% CI 2.706 to 3.176, p=0.000; waist-to-hip ratio: OR 2.271, 95% CI 1.651 to 3.123, p=0.000; body fat percentage: OR 2.515, 95% CI 2.026 to 3.121, p=0.000). The intercept of MR-Egger regression for these SNPs is not statistically significant (BMI: p=0.451; waist-to-hip ratio: p=0.066; body fat percentage: p=0.722), suggesting no directional pleiotropy (table 4).
Causal association between genetically determined potential mediators and T2DM
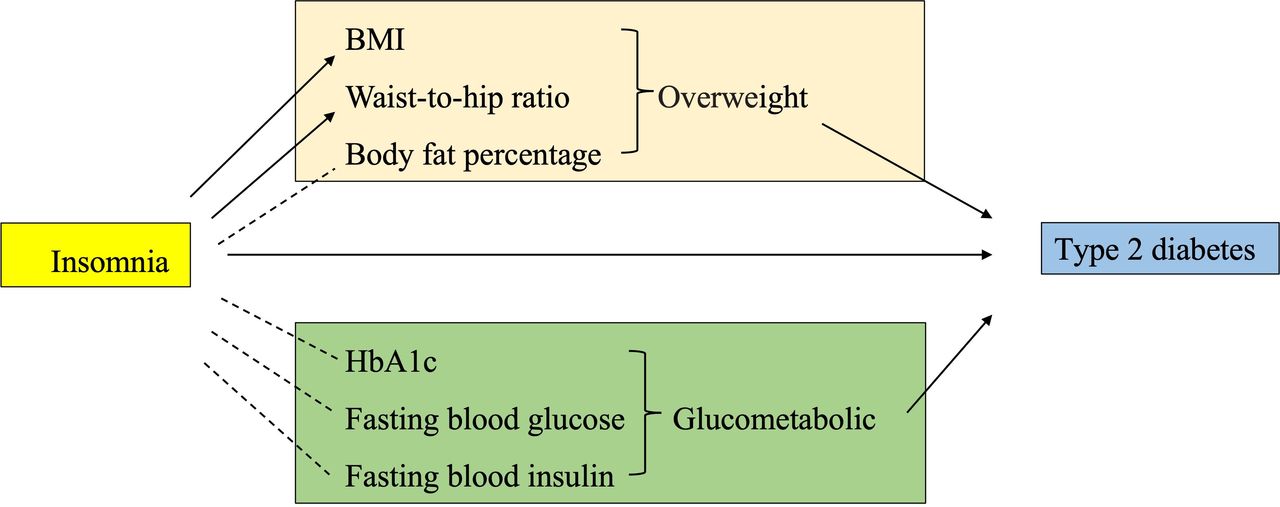
To sum up, overweight serves as a mediator in the causal pathway from insomnia to T2DM. A network MR diagram of a summary from insomnia to T2DM is shown in figure 2.

Network MR diagram of overweight and glycometabolism summary from insomnia to type 2 diabetes. BMI, body mass index; MR, Mendelian randomization; →, causal association; – – – –, no causal association.
Discussion
In this study, we investigate the causality between genetically determined insomnia and T2DM. Mechanically, we further explore the potential pathways mediating effects from insomnia to T2DM, emphasizing overweight (BMI, waist-to-hip ratio, and body fat percentage) and glycometabolism (HbA1c, fasting blood glucose, and fasting blood insulin). Our MR analysis provides strong evidence that genetically predicted insomnia has a causal association with T2DM. Being overweight (especially BMI and body fat percentage) mediates the causal pathway from insomnia to T2DM. As we know, we are the first to address possible biological mechanisms in the causal pathway from insomnia to T2DM by a network MR study.
Epidemiological evidence of the link between insomnia and T2DM
Much previous epidemiological evidence has indicated the link between insomnia and T2DM.7 25 26 Both poor sleep habits and sleep disorders are highly prevalent among adults with T2DM. In observational studies, short sleep duration, obstructive sleep apnea, shift work, and insomnia are associated with a higher risk of incident T2DM and may predict worse outcomes in those with existing diabetes.25 A cohort study consists of 81 233 persons with pre-diabetes, 24 146 (29.7%) of whom have insomnia at some point during the 4.3-year average observation period. After adjusting for traditional risk factors, patients with insomnia were 28% more likely to develop T2DM than those without insomnia.6 As in northern China, insomnia is associated with T2DM independently.27 The aforementioned evidence suggests that insomnia may act as a novel risk factor for T2DM.
Comparison with previous MR studies
MR analysis provides a robust and cost-efficient approach to demonstrate temporal relationships and causal pathways between sleep and obesity through genetics.28 MR exploits the fact that genes are randomly assigned from parents to offspring, which are unlikely to be affected by confounding factors, and that genotypes are fixed at zygote formation and cannot be changed.28 Recently, a wide-angled MR study (34 exposures (19 risk factors and 15 protective factors)) identify insomnia as a novel causal risk factor for T2DM.8 Moreover, another two-sample MR study supported findings for an adverse effect of genetically predicted insomnia on T2DM risk (OR 1.14, 95% CI 1.09 to 1.19) at the Bonferroni-adjusted level of significance.9 In our MR study, the causal estimate shows that insomnia will also increase the risk of T2DM (OR 1.142, 95% CI 1.072 to 1.216). Our MR results align with the previous MR findings and add more robust evidence supporting the causality between insomnia on T2DM. So, there is around a 15% T2DM risk increase by insomnia. We analyze the inconsistent increase in the T2DM risk ratio due to the different consortiums we have chosen for analysis. Since insomnia is proved to be a modifiable risk factor for T2DM, management against insomnia among the population is recommended to prevent T2DM.
Potential mediators from insomnia to T2DM
There is no comprehensive description of the underlying mechanisms from insomnia to T2DM. As for the possible mediators from insomnia to T2DM, overweight (BMI, waist-to-hip ratio, and body fat percentage) and glycometabolism (HbA1c, fasting blood glucose, and fasting blood insulin) are chosen for our MR analysis the next step. Previous MR studies have proved potential causal associations of genetic liability to insomnia with increased risk of a broad range of cardiovascular diseases, including atrial fibrillation, heart failure, coronary artery disease, and so on.12 24 Most of the aforementioned cardiovascular diseases are also well-established risk factors for T2MD. In addition, there is burgeoning evidence of a causal association between obesity (including BMI, waist-to-hip ratio, body fat distribution, and abdominal adiposity) and increased risk of T2DM.29–32 Previous MR studies suggest robust causal effects of insomnia on higher BMI33 and insomnia on a higher waist-to-hip ratio.1 Our analysis also provides strong evidence that insomnia is causally associated with BMI and body fat percentage. There is also suggestive evidence of an association between insomnia and the waist-to-hip ratio. So, our findings (weaker estimates) are directionally similar to the previous MR studies. We analyze it may be due to different populations are involved in the consortium for BMI. Compared with Hassan et al.’s research,33 we both used the UK Biobank+23andMe for insomnia. Yet, in the Hassan et al research,33 they choose a large GWAS by the Genetic Investigation of Anthropometric Traits (GIANT) consortium using 339 224 adults in 2015 for the BMI dataset.34 At the same time, we choose Ben Elsworth’s MRC-IEU Consortium, which includes 454 884 European of both sexes in 2018 for the BMI dataset. So the dataset we choose is more recent and with bigger sample size. Our results indicate that overweight may act as a mediator in the causal pathway from insomnia to T2DM. In the following Network MR analysis, we further evaluate whether overweight is associated with T2DM using MR analysis. Not surprisingly, BMI, waist-to-hip ratio, and body fat percentage mediate the causal pathway from insomnia to T2DM.
Besides being overweight, we also want to identify whether glycometabolism is a potential mediator in the causal pathway from insomnia to T2DM. Sleep disturbances (insufficient or poor sleep quality) have been linked to abnormal glucose metabolism previously. A cross-sectional study involving 3753 patients with T2DM recruited from the Hong Kong Diabetes Registry reveals that compared with patients without insomnia, patients with insomnia have higher levels of fasting plasma glucose and HbA1c. Moreover, insufficient sleep has been identified as a risk factor for poor glycemic control in individuals with T2DM.35 An adverse impact of experimental sleep restriction on insulin resistance, leading to reduced glucose tolerance and increased diabetes risk, has been well documented.36 Yet, recently, it has been reported that available sleep interventions effectively improve sleep, but the effects on glucose metabolism are inconclusive.37 Larger randomized studies with consistent outcome measurements are needed to demonstrate this potential causal relationship. So we conduct the MR study to identify whether insomnia affects T2DM via glycometabolism genetically. Yet, our MR results do not support glycometabolism abnormal (including HbA1c, fasting blood glucose, and fasting blood insulin) as a mediator between insomnia and T2DM.
Limitation
First, in the insomnia dataset, only European descent participants are included. This population confinement may limit the generalizability of our findings to other populations in the whole world. Second, the ascertainment of insomnia is far from perfect. In UK Biobank, insomnia is defined by self-reported information collected via a questionnaire on a touchscreen device and while in 23andMe, an online questionnaire survey defines insomnia. As a result, the ascertainment of insomnia is entirely subjective. Last but not least, besides insomnia, the insomnia-related SNPs may affect T2DM through other causal pathways, such as daytime sleepiness, too long/too short sleep duration, and depression.
Conclusions
Genetically predicted insomnia has a causal association with T2DM. Being overweight mediate the causal pathway from insomnia to T2DM.
For patients with insomnia, to prevent overweight problems and the following T2DM, sleep intervention should be carried out in advance to improve sleep quality. Moreover, strong weight control management and routine screening for T2DM are also recommended for those who have insomnia. Strategies to reduce insomnia, especially for the overweight population, are cornerstones in preventing T2DM in public. The complex relationship between insomnia, obesity, and diabetes should be further explored in clinical studies in the future.
Data availability statement
All data relevant to the study are included in the article or uploaded as online supplemental information.
Ethics statements
Patient consent for publication
Ethics approval
This study does not involve human participants.
References
Supplementary materials
Supplementary Data
This web only file has been produced by the BMJ Publishing Group from an electronic file supplied by the author(s) and has not been edited for content.
Footnotes
WX and LJ contributed equally.
Contributors WXY, LJT and LLZ conceived the research and participated in the study design; XMJ acquired the data and performed statistical analysis; LWD and WQ drafted the manuscript and replied to the reviewers. LLZ was responsible for the overall content as the guarantor. All authors read and approved the final manuscript.
Funding This study is supported by the National Natural Science Foundation of China (81804199) and the Scientific Research Foundation of the Education Department of Guangdong Province (2020KQNCX034).
Competing interests None declared.
Provenance and peer review Not commissioned; externally peer reviewed.
Supplemental material This content has been supplied by the author(s). It has not been vetted by BMJ Publishing Group Limited (BMJ) and may not have been peer-reviewed. Any opinions or recommendations discussed are solely those of the author(s) and are not endorsed by BMJ. BMJ disclaims all liability and responsibility arising from any reliance placed on the content. Where the content includes any translated material, BMJ does not warrant the accuracy and reliability of the translations (including but not limited to local regulations, clinical guidelines, terminology, drug names and drug dosages), and is not responsible for any error and/or omissions arising from translation and adaptation or otherwise.