Article Text

Abstract
Continuous glucose monitoring (CGM)-derived time in range (TIR) correlates with hemoglobin A1c (A1c) among patients with type 2 diabetes mellitus (T2DM); however, there is a paucity of data evaluating its association with microvascular complications. We conducted this systematic review to examine the association between TIR and microvascular complications of diabetic retinopathy (DR), diabetic nephropathy (DN), and diabetic peripheral neuropathy (DPN). We conducted a comprehensive literature search on PubMed, Scopus, and Web of Science online databases following the Preferred Reporting Items for Systematic Reviews and Meta-Analyses guidelines. Full-text original articles that evaluated the association between CGM-derived TIR and risk of microvascular complications and were published between 2010 and June 2021 were included in our systematic review. The quality of the included studies was evaluated using the National Heart, Lung, and Blood Institute Quality Assessment Tool for Observational Cohort and Cross-Sectional Studies. Data were analyzed using qualitative synthesis. Eleven studies on a total of 13 987 patients were included in the systematic review. The median sample size, baseline A1c, and diabetes duration were 466 patients (range: 105–5901), 8.2% (SD 0.5%), and 11.3 years (1.0), respectively. Majority of the studies were conducted in Asia (10 out of 11). Four studies evaluated the relationship between CGM-derived TIR and DR and CGM-derived TIR and DN, while seven studies evaluated the relationship between CGM-derived TIR and DPN. A 10% increase in TIR was associated with a reduction in albuminuria, severity of DR, and prevalence of DPN and cardiac autonomic neuropathy. In addition, an association was observed between urinary albumin to creatinine ratio but not with estimated glomerular filtration rate. This review summarizes recent evidence supporting an association between CGM-derived TIR and microvascular complications among patients with T2DM. A larger-scale multicenter investigation that includes more diverse participants is warranted to further validate the utility of TIR as a predictor of diabetic microvascular complications.
- endocrine system
- diabetes mellitus
- type 2
- diabetes complications
- adult
Data availability statement
All data relevant to the study are included in the article or uploaded as supplementary information.
This is an open access article distributed in accordance with the Creative Commons Attribution Non Commercial (CC BY-NC 4.0) license, which permits others to distribute, remix, adapt, build upon this work non-commercially, and license their derivative works on different terms, provided the original work is properly cited, appropriate credit is given, any changes made indicated, and the use is non-commercial. See: http://creativecommons.org/licenses/by-nc/4.0/.
Statistics from Altmetric.com
Introduction
Hemoglobin A1c (A1c) is the primary tool for monitoring long-term glycemic control and assessing the risk of diabetes-related complications.1 2 However, A1c has several limitations. A1c is affected by factors such as age, race/ethnicity, hemoglobinopathies, hemolytic anemia, recent blood transfusion, chronic kidney disease, and pregnancy, resulting in discrepancies between measured A1c and true glycemic control. Furthermore, A1c fails to provide information about extremes of hypoglycemia or hyperglycemia, glucose trends, and glycemic variability.3 Intermittent self-monitored blood glucose (SMBG) is not influenced by conditions affecting red blood cell turnover and provides information beyond A1c; however, it is inconvenient and unpopular among patients of all age groups.
Continuous glucose monitoring (CGM) devices are increasingly popular, affordable, reliable in improving A1c, and overcome many of the limitations with A1c, and SMBG and CGM-derived metrics are now incorporated into the management of patients with diabetes.4 CGM devices measure interstitial fluid glucose every 1–5 min and provide several metrics. Mean glucose from CGM has also been used to calculate glucose management indicator (GMI), also known as ‘estimated A1C’.5 Time in range (TIR) is another metric, defined as the percentage of time glucose between 70 mg/dL and 180 mg/dL (3.9–10.0 mmol/L). Over the last few years, TIR has become popular as a surrogate marker of glycemic control, which also correlates with A1c.4 International consensus recommends TIR of 70% to align with A1c of ~7%, with a 0.5% decline in A1c per 10% increase in TIR.4 6 Furthermore, a 5% increase in TIR was associated with significant clinical benefits among patients with type 2 diabetes mellitus (T2DM).4
While A1c remains the primary predictor of the development and progression of microvascular complications among patients with T2DM, there is growing evidence to support the association between TIR and diabetes-related microvascular complications.7–9 In a study by Sheng et al9 on patients with T2DM, the authors calculated TIR from a 7-point SMBG and found lower TIR to have higher odds of having diabetic retinopathy (DR), diabetic nephropathy (DN), and diabetic peripheral neuropathy (DPN), suggesting a strong correlation between calculated TIR and risk of diabetes-related microvascular complications.
Although adoption of TIR in clinical practice is gradually increasing and becoming well established, its use as a predictor of long-term risk of diabetes-related microvascular complications is still growing and needs further validation. Therefore, we performed a systematic review to summarize the published literature evaluating CGM-derived TIR as a predictor of diabetes-related microvascular complications and discuss its implications on future clinical practice and research among patients with diabetes.
Methods
This systematic review was performed using the guidelines established by the Preferred Reporting Items for Systematic Reviews and Meta-Analyses statements.10 For this study, a comprehensive literature search was done to identify original research articles in various databases. Before the literature screening process, a protocol was submitted to the International Prospective Register of Systematic Reviews (PROSPERO ID: CRD42021259988).
Selection criteria
Studies included in this systematic review met the following inclusion criteria: (1) cross-sectional/observational studies examining the association between CGM-derived TIR and microvascular complications among patients with T2DM, (2) full-text and (3) English-language articles, and (4) published between January 1, 2010 and June 5, 2021. We excluded the following studies: (1) review articles and (2) systematic review with or without meta-analysis.
Search strategy
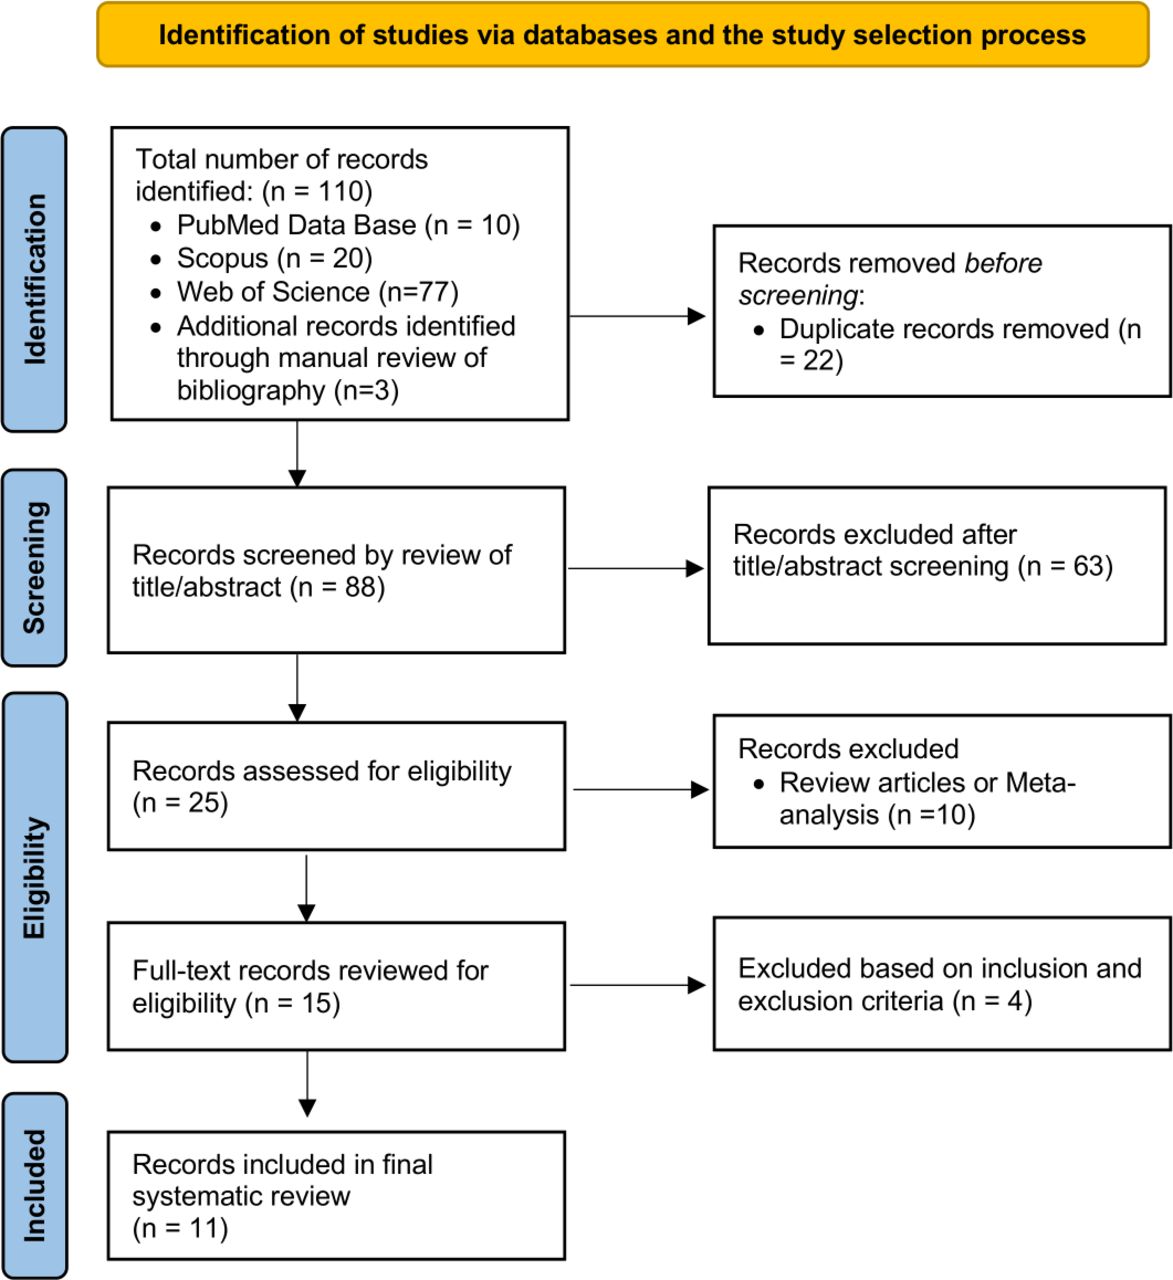
On June 5, 2021, we conducted a comprehensive literature search in electronic databases (PubMed, Scopus, and Web of Science) for publications between 2010 and June 2021 with English language restrictions. The search strategy was designed and conducted by the principal investigator (RR), with input from the study’s coinvestigators (RM, NJ, and VJ), using the following keywords: ((“Continuous glucose monitor” OR “Continuous glucose monitoring” OR “Dexcom” “Freestyle Libre” OR “Guardian” OR “Flash glucose monitoring” OR “Time in Range” OR “Time-in-range” OR “TIR”) AND (“Diabetes complications” OR “Microvascular complications” OR “Retinopathy” OR “Neuropathy” OR “Nephropathy” OR “Complication” OR “Microalbuminuria” OR “Albuminuria”)) AND (“Type II diabetes” OR “type 2 diabetes”). Next, the bibliographies of the selected articles were manually searched for any additional studies. After screening for duplicate studies, two reviewers (RM and NJ) independently reviewed the title and abstract of the identified publications. Studies were then excluded if they did not address our research question or meet our prespecified inclusion criteria. Finally, the full texts of the remaining articles were examined to determine the final exclusion for our systematic review. Any conflicts during the study selection process were resolved by the third reviewer (RR). Figure 1 shows the schematic diagram of the study selection process.
PRISMA method flow diagram of study selection. PRISMA, Preferred Reporting Items for Systematic Reviews and Meta-Analyses.
Data collection
A predefined Excel sheet was used for extraction of data from each study. The following data were extracted from each included study: (1) title, (2) primary author, (3) year of publication, (4) duration of study, (5) country of the study population, (6) study design, (7) aim of the study, (8) sample size, (9) pertinent variables measure, (10) results, (11) conclusion, and (12) limitations of the study.
Quality assessment
Two independent reviewers (RM and VJ) assessed the study quality and risk of bias in the included studies using the National Heart, Lung, and Blood Institute Quality Assessment Tool for Observational Cohort and Cross-Sectional Studies (Study Quality Assessment Tools; https://www.nhlbi.nih.gov/health-topics/study-quality-assessment-tools).11 Any disagreement was resolved by the other involved research reviewers (RR and VJ). Based on 14 questions, an overall rating was assigned as good, fair, and poor for study quality, corresponding to low, moderate, or high risk of bias.
Data synthesis
Before this systematic review, an initial literature search in the subject field revealed only a few studies with heterogeneous data points. Hence, we could not perform a meta-analysis, and a qualitative synthesis was performed.
Results
Study selection
We identified 110 publications using our initial search of online databases: PubMed, Scopus, Web of Science, and manual review of the bibliography. Of these, 22 duplicate publications were removed. Of 88 records screened, 63 were excluded based on screening of the title/abstract and 10 were excluded being either review articles or meta-analysis. Fifteen eligible publications were retrieved in full text, of which four did not meet the inclusion criteria. Ultimately, we included 11 articles in our systematic review (figure 1).12–22 There was complete agreement between authors regarding article inclusion, risk of bias assessment, and data extraction. Detailed characteristics of the included studies are summarized in online supplemental file 1.
Supplemental material
Baseline characteristics
A total of 13 987 patients across 11 studies were included in our systematic review. The median sample size was 466 patients (range: 105–5901, IQR: 616). Ten studies were cross-sectional in design, while one study was an interim analysis of an ongoing prospective observational study.20 The mean age of the participants was 59.3 years (SD 1.3), A1c at baseline 8.2% (SD 0.5%), and duration of diabetes 11.3 years (SD 1.0). For patients with retinopathy, nephropathy, and neuropathy, the mean duration of diabetes was 11.8, 13.1, and 11.0 years, the mean age was 62.1, 61.6, and 59.1 years, and the mean baseline A1c was 8%, 7.8%, and 8.1%, respectively. Five studies were conducted in China,12–15 21 two in South Korea,17 18 two in Japan,20 22 one in India,19 and one in the USA.16 Five studies used Medtronic’s CGM device,12 15–18 four studies used Abbott’s Freestyle Libre CGM (FLP-CGM) device,19–22 one study used Meiqi CGM device,14 while in one study both Medtronic and Meiqi CGM devices13 were used. In all 11 studies, TIR was defined by the time per cent during 24 hours when the glucose was in the range of 70–180 mg/dL (3.9–10 mmol/L). The duration of use of CGM device varied in all studies and ranged between 3 and 14 days. Calibrations of the CGM device when applicable (in 6 of 11 studies) was done using two to four capillary blood glucose readings. In one study, the number of calibrations was not reported by the authors.15 GMI values based on CGM data were available for only five studies and ranged between 7 and 7.5.16–19 21 We have summarized the baseline characteristics of the included studies in table 1. On the study quality assessment tool, one study was rated ‘good’ and ten studies were rated ‘fair’; none was rated ‘poor’, eliminating increased risk of bias in the studies included in our systematic review (online supplemental file 1).
Baseline characteristics of studies evaluating the association between CGM-derived TIR and microvascular complications among patients with T2DM
Association between CGM-derived TIR and DR
Four cross-sectional studies evaluated the association between TIR and DR.12 19 20 22 One study used Medtronic CGM over 72 hours,12 while three studies used the FLP-CGM device to collect 14 days of data.19 20 22 One study used FLP-CGM data over the middle 8-day period, excluding the first 2 days and the last 4 days.20 The average prevalence of DR was 27.4% (range: 22.2%–30.1%). One study categorized participants into three groups based on glycemic profile (‘TIR profile’, ‘hypo profile’, and ‘hyper profile’) and showed higher odds of proliferative DR (‘hypo profile’: OR=2.84, 95% CI 1.65 to 4.88; ‘hyper profile’: OR=1.39, 95% CI 0.78 to 2.45) as well as non-proliferative DR (‘hypo profile’: OR=1.44, 95% CI 1.20 to 1.73; ‘hyper profile’: OR=1.33, 95% CI 1.11 to 1.58) compared with ‘TIR profile’.19 Two studies found a statistically significant association between a 10% increase in TIR and reduction in severity of DR,12 20 while no significant association between TIR and DR was found in the study by Kuroda et al.22 In both these studies, higher A1c was found to be associated with increased severity of DR (p<0.01),12 20 while the relationship between A1c and DR was not assessed in the other two studies.19 22
In summary, a 10% increase in TIR is associated with reduction in severity of DR and higher time spent in target range is associated with decrease in severity of DR. In addition, CGM-derived TIR was found to be similar to A1c in predicting DR among patients with T2DM.
Association between CGM-derived TIR and DN
The association between TIR and nephropathy was evaluated in four studies.17 19 20 22 In one study, CGM was done using Medtronic’s CGM device for 3 days (GOLD) and 6 days (iPro2), respectively,17 while in three studies FLP-CGM device was used to record data over 14 days.19 20 22 In three studies, urinary albumin to creatinine ratio (UACR) >30 was used to define DN,17 19 20 while in one study the authors used UACR and estimated glomerular filtration rate (eGFR) values to determine its association with TIR.22 Participants were categorized into normoalbuminuria (UACR <30 mg/g), microalbuminuria (UACR 30–300 mg/g), or macroalbuminuria (UACR >300 mg/g) in two studies.19 20 In one study, participants were grouped into with and without albuminuria.17 The prevalence of albuminuria in these four studies was 32.67% (range 27%–36.6%), with a higher prevalence of microalbuminuria compared with macroalbuminuria (22.6% vs 8.5%, respectively). In another study, participants were categorized into three groups based on glycemic profile (‘TIR profile’, ‘hypo profile’, and ‘hyper profile’).19 Compared with ‘TIR profile’, both ‘hyper’ and ‘hypo’ profiles had higher odds of macroalbuminuria (‘hypo profile’: OR=1.58, 95% CI 1.25 to 1.98; ‘hyper profile’: OR=1.37, 95% CI 1.10 to 1.71). Additionally, ‘hyper’ and ‘hypo’ profiles also had higher odds of diabetic kidney disease, compared with ‘TIR profile’ (‘hypo profile’: OR=1.65, 95% CI 1.18 to 2.31; ‘hyper profile’: OR=1.88, 95% CI 1.37 to 2.58).19 Two studies showed a statistically significant association between a 10% increase in TIR and reduction in severity of albuminuria.17 20 In multiple regression analysis, Kuroda et al22 found an association between TIR and UACR (β=−0.100, p=0.043) but not with eGFR (β=−0.011, p=0.824). Out of the four studies evaluating the relationship between TIR and DN, two studies found similar association between A1c and DN.17 20 One study found higher A1c among patients with albuminuria compared with patients without albuminuria (8.5% vs 8.0%, p<0.01),17 while in the second study the authors found a statistically significant association between severity of albuminuria and A1c (p<0.01).20 In the rest of the two studies, the association between A1c and DN was not evaluated.19 22
In summary, two studies showed decrease in severity of albuminuria with a 10% increase in TIR, one study showed increased time spent in target range to be associated with lower risk of macroalbuminuria and diabetic kidney disease, while in one study increased TIR was associated with a decrease in UACR but not with eGFR. In limited studies evaluating the relationship between CGM-derived TIR and DN, it was found to be similar to A1c in predicting DN among patients with T2DM.
Association between CGM-derived TIR and diabetic neuropathy
Seven studies examined the relationship between CGM-derived TIR and diabetic neuropathy.13–16 18 21 22 Four studies evaluated the association of TIR with DPN,14 16 21 22 two studies examined the association of TIR and cardiovascular autonomic neuropathy (CAN),13 18 and in one study the association of TIR with peripheral nerve function was evaluated.15 Three studies used Medtronic CGM,15 16 18 two studies used Freestyle Libre,21 22 while Meiqi14 and both Meiqi and Medtronic13 were used in one study each. The CGM data were collected for 3 days in three studies,13–15 for 2 weeks in two studies,21 22 for both 3 days (GOLD) and 6 days (iPro2) in one study,18 and for two 6-day periods, separated by 2 weeks, in one study.16
Each of the studies evaluating DPN/CAN used different surrogates for examining neuropathy. Three studies used sudomotor function,14 the Michigan Neuropathy Screening Instrument,16 and the Numerical Rating Scale21 to assess DPN. Kuroda et al22 used the diagnostic criteria of the Japanese Study Group of Diabetes Neuropathy23 to diagnose DPN. CAN was evaluated in two studies using a combination of five (three parasympathetic and two sympathetic) and four (three parasympathetic and one sympathetic) cardiovascular autonomic function tests.13 18 Li et al15 examined peripheral nerve function by electrophysiological measurement of motor and sensory nerves to calculate composite Z-score for conduction velocity, latency, and amplitude to assess peripheral nerve function.
The prevalence of DPN and CAN was 46.6% and 32.1%, respectively. Yang et al21 showed a decline in TIR to be directly associated with increased prevalence of any painful DPN (OR=2.66, 95% CI 1.16 to 6.10, p<0.05), while Guo et al14 found an increase in TIR to be inversely related to prevalence of sudomotor dysfunction (OR=0.979, 95% CI 0.971 to 0.987, p<0.001). In one study by Mayeda et al,16 a 10% decrease in TIR was associated with increase in prevalence of DPN (OR=1.25, 95% CI 1.02 to 1.52, p<0.05) and that the rate of DPN was lower in participants with TIR >70% compared with participants with TIR <70% (43% vs 74%). Kuroda et al22 found TIR to be weakly associated with presence of DPN (β=−0.106, p=0.033). Kim et al18 showed the OR of CAN per 10% increase in TIR to be 0.894 (95% CI 0.81 to 0.99, p<0.05). Guo et al13 found an increase in TIR quartiles to be inversely associated with prevalence of CAN (p<0.05). Li et al15 assessed peripheral nerve function and found higher TIR to be associated with a higher composite Z-score of conduction velocity (b=0.230, p<0.001), higher composite Z-score of amplitude (b=0.099, p=0.010), and lower composite Z-score of latency (b=0.172, p<0.001). The authors further concluded the higher TIR tertile group to have lower risk of slowing conduction velocity (TIR medium: OR 0.44, p<0.001; TIR high: OR 0.26, p<0.001), lower risk of amplitude reduction (TIR high: OR 0.60, p<0.05), and higher rate of reduced latency (TIR medium: OR 1.57, p<0.05; TIR high OR 1.71, p<0.05) compared with the low tertile group.
Out of five studies evaluating DPN or peripheral nerve function, three studies evaluated the relationship between TIR and A1c,14–16 while it was not examined in two studies.21 22 There was no statistically significant relationship between TIR and A1c among patients with and without sudomotor dysfunction. One study found higher A1c in patients with sudomotor dysfunction compared with patients without sudomotor dysfunction; however, this association was not statistically significant (8.94 vs 8.6, p=0.118).14 In another study, the authors did not find statistically significant relationship between A1c and severity of DPN (p=0.139).16 Assessment of nerve function by Li et al15 demonstrated A1c to be independently associated with composite Z-score of conduction velocity, latency, and amplitude (p<0.001). Compared with the relationship between A1c and DPN, the association between A1c and CAN was limited with only two studies examining this relationship. While one study showed higher A1c to be associated with greater prevalence of CAN (p=0.041),18 in another study this association trended toward statistical significance (p=0.053).13
In summary, increase in TIR was associated with decrease in prevalence and severity of both DPN and CAN. TIR >70% was associated with significantly lower prevalence of DPN compared with TIR <70%. Additionally, based on limited studies, TIR was found to more closely correlate with DPN and CAN compared with A1c.
Discussion
To our knowledge, this is the first systematic review examining the relationship between CGM-derived TIR and microvascular complication among patients with T2DM. The risk of microvascular complications and chronic hyperglycemia, as measured by A1c, has been well established in both patients with type 1 diabetes mellitus (T1DM) and patients with T2DM in landmark trials such as The Diabetes Control and Complications Trial (DCCT) and the UK Prospective Diabetes Study.24 25 CGM provides more comprehensive glucose data beyond A1c, is convenient for the patients,26 and has shown promising evidence supporting improved glycemic control and quality of life among patients with diabetes.27 Several studies have assessed the relationship between CGM-derived metrics and A1c. One study by Vigersky and McMahon28 analyzing 18 randomized controlled trials found a strong correlation between A1c and TIR 70–180 mg/dL, while Beck et al29 found that a 10% change in TIR of 70–180 mg/dL correlates with the mean A1c change by ~0.5%. Current international consensus recommends TIR of 70% to align with A1c of ~7%, with each 10% increase in TIR to correspond with ~0.5% A1c reduction.4 6 In a previous work, Beck et al7 validated a strong correlation between TIR derived from SMBG among patients in DCCT and risk of microvascular complications. With this association between SMBG-derived TIR and microvascular complications, along with recent data validating the association of CGM-derived TIR with A1c, there is a growing interest in using CGM-derived TIR as a surrogate marker for assessment of various diabetes-related complications. This idea has been supported by many recent studies and the evidence is constantly growing. One study found a 6.4% reduction in risk of abnormal carotid intima-media thickness, a surrogate for cardiovascular disease, when TIR increased by 10%.30 In a study by Ranjan et al31 on patients with T1DM, improved TIR over 1 year was associated with reduced albuminuria (19% reduction in UACR per 10% increase in TIR). Lu et al12 found an inverse correlation between TIR quartile and severity of DR. Yoo et al17 reported albuminuria, a microvascular complication of diabetes, to be inversely related with TIR, while Mayeda et al16 established an association between DPN among patients with T2DM and chronic kidney disease. The results of these studies further strengthen the potential of TIR as a tool for predicting the risk of development and progression of diabetes-related microvascular complications. In this systematic review of 11 original published articles, we found a strong correlation between CGM-derived TIR and microvascular complications.
Although CGM-derived TIR provides important information not captured by A1c, it is still insufficient in providing a complete description of glycemic control. Glycemic variability (measured by mean absolute glucose, SD, and coefficient of variation) has also been suggested to be an independent predictor of diabetes-related complications.32 It results in oxidative stress33 and endothelial dysfunction34 and can lead to cardiovascular as well as microvascular complications.35–37 Glycemic variability was not consistently assessed in the 11 studies included in our systematic review, and hence we did not evaluate its association with microvascular complications in our systematic review.
The association between TIR and microvascular complications was adjusted for A1c. The association was independent of A1c for severity of neuropathic pain,21 sudomotor dysfunction,14 conduction velocity,15 CAN,13 severity of DR,12 and albuminuria.20 Varghese et al19 also observed an A1c independent association between TIR and retinopathy as well as nephropathy parameters among hypo and hyper profiles versus TIR profiles. In three studies, the association between TIR and CAN,18 albuminuria,17 and DR20 was found to be dependent on A1c. Additionally, Mayeda et al16 did not observe any association between A1c and DPN. Parameters, although non-uniformly defined among 11 studies, were consistently applied to the study subjects.
There are some limitations to our systematic review which need to be noted. The small number of available studies evaluating the association of CGM-derived TIR and microvascular complications and the quality of the studies included in the review are the most significant limitations of our systematic review. We included keywords to search various databases instead of using medical subject headings or MeSH terms, resulting in limited search results. Even with broader terms the results were the same articles. However, we addressed this limitation of the study by manually searching the bibliographies of included articles to look for any additional studies. The involved studies were primarily cross-sectional in design, and in the absence of prospective studies a direct causal relationship cannot be established between TIR and microvascular complications. Majority of the studies were conducted in Asia (10 out of 11 studies) and study participants were predominantly Asian (13 882 out 13 987), affecting the generalizability of our findings to other populations. There were significant methodological differences among various studies included in our systematic review. The studies differed in the type of CGM device used (Medtronic vs Freestyle Libre vs Meiqi), duration over which CGM data were collected (72 hours to 14 days), and calibration of CGM devices (two to four times per day). These differences could significantly impact the TIR.38 Additionally, there was no study involving the Dexcom CGM device, one of the most used CGM devices, owing to its ability to integrate into hybrid-close loop systems. Furthermore, each study used different surrogates for assessment of neuropathy, retinopathy, and nephropathy. For DR, participants were classified into mild non-proliferative DR, moderate non-proliferative DR, and vision-threatening DR by Lu et al,12 versus simple DR, preproliferative DR, and proliferative DR by Wakasugi et al,20 versus non-proliferative DR and proliferative DR by Varghese et al.19 To evaluate DN, patients were categorized into those with microalbuminuria and macroalbuminuria in one study versus microalbuminuria, diabetic kidney disease, and macroalbuminuria by Varghese et al,19 versus with and without albuminuria in the third study. Similarly, for defining DPN, different criteria like sudomotor dysfunction, Michigan Neuropathy Screening Instrument, and Numerical Rating Scale were used in three different studies. To evaluate for CAN, one study used five cardiac reflex tests, while only four cardiac reflex tests were used in another study. This heterogeneity in outcomes assessed prevented quantitative analysis in our systematic review. A subgroup analysis between studies with more than 10–14 days of CGM data versus less than 10 days of CGM data could not be performed owing to lack of consistency in the duration of CGM data analyzed, low number of studies in each group, and heterogeneity in outcomes assessed in each study. Moreover, only in a few studies (6 out of 11) the authors evaluated the association of microvascular complications to a 10% change in TIR. In contrast, the other studies did not report these data and only assessed the outcomes for different TIR quartiles.
Conclusion
In summary, our study affirms the significant association between CGM-derived TIR and microvascular complications of DN, DR, and DPN among patients with T2DM. However, heterogeneity in the CGM data reported a lack of uniformity in methodology and outcomes measured, limited race/ethnicity of the population evaluated in the included studies, and restricted generalization of the findings from our systematic review. Therefore, a larger-scale multicenter investigation that includes more diverse participants is warranted to further validate the association between CGM-derived TIR and microvascular complications among patients with T2DM.
Data availability statement
All data relevant to the study are included in the article or uploaded as supplementary information.
Ethics statements
Patient consent for publication
References
Supplementary materials
Supplementary Data
This web only file has been produced by the BMJ Publishing Group from an electronic file supplied by the author(s) and has not been edited for content.
Footnotes
Twitter @DrRishi_Raj
RR and VJ contributed equally.
Contributors Conception and design: RR. Development of methodology: RR, RM. Data collection: RR, RM, NJ. Analysis and interpretation of data: RR, RM, NJ, VJ. Writing, review, and/or revision of the manuscript: RR, RM, NJ, VJ, RC, PAK. Study supervision: RR, RC, PAK.
Funding The authors have not declared a specific grant for this research from any funding agency in the public, commercial or not-for-profit sectors.
Competing interests None declared.
Provenance and peer review Not commissioned; externally peer reviewed.
Supplemental material This content has been supplied by the author(s). It has not been vetted by BMJ Publishing Group Limited (BMJ) and may not have been peer-reviewed. Any opinions or recommendations discussed are solely those of the author(s) and are not endorsed by BMJ. BMJ disclaims all liability and responsibility arising from any reliance placed on the content. Where the content includes any translated material, BMJ does not warrant the accuracy and reliability of the translations (including but not limited to local regulations, clinical guidelines, terminology, drug names and drug dosages), and is not responsible for any error and/or omissions arising from translation and adaptation or otherwise.