Article Text

Abstract
Introduction To assess impact of glycemic control on plasma protein-bound advanced glycation end products (pAGEs) and their association with subsequent microvascular disease.
Research design and methods Eleven pAGEs were measured by liquid chromatography-mass spectrometry in banked plasma from 466 participants in the Diabetes Control and Complications Trial/Epidemiology of Diabetes Interventions and Complications (DCCT/EDIC) study at three time points (TPs): DCCT year 4 (TP1) and year 8 (TP2) and EDIC year 5/6 (TP3). Correlation coefficients assessed cross-sectional associations, and Cox proportional hazards models assessed associations with subsequent risk of microvascular complications through EDIC year 24.
Results Glucose-derived glycation products fructose-lysine (FL), glucosepane (GSPN) and carboxymethyl-lysine (CML) decreased with intensive glycemic control at both TP1 and TP2 (p<0.0001) but were similar at TP3, and correlated with hemoglobin A1c (HbA1c). At TP1, the markers were associated with the subsequent risk of several microvascular outcomes. These associations did not remain significant after adjustment for HbA1c, except methionine sulfoxide (MetSOX), which remained associated with diabetic kidney disease. In unadjusted models using all 3 TPs, glucose-derived pAGEs were associated with subsequent risk of proliferative diabetic retinopathy (PDR, p<0.003), clinically significant macular edema (CSME, p<0.015) and confirmed clinical neuropathy (CCN, p<0.018, except CML, not significant (NS)). Adjusted for age, sex, body mass index, diabetes duration and mean updated HbA1c, the associations remained significant for PDR (FL: p<0.002, GSPN: p≤0.02, CML: p<0.003, pentosidine: p<0.02), CMSE (CML: p<0.03), albuminuria (FL: p<0.02, CML: p<0.03) and CCN (FL: p<0.005, GSPN : p<0.003).
Conclusions pAGEs at TP1 are not superior to HbA1c for risk prediction, but glucose-derived pAGEs at three TPs and MetSOX remain robustly associated with progression of microvascular complications in type 1 diabetes even after adjustment for HbA1c and other factors.
- glycated hemoglobin A
- kidney
- oxidative stress
- diabetic neuropathies
Data availability statement
Data are available in a public, open access repository. Data are available on reasonable request. Levey-Jennings plots of pAGEs are available on request.
This is an open access article distributed in accordance with the Creative Commons Attribution Non Commercial (CC BY-NC 4.0) license, which permits others to distribute, remix, adapt, build upon this work non-commercially, and license their derivative works on different terms, provided the original work is properly cited, appropriate credit is given, any changes made indicated, and the use is non-commercial. See: http://creativecommons.org/licenses/by-nc/4.0/.
Statistics from Altmetric.com
Significance of this study
What is already known about this subject?
Advanced glycation end products in skin collagen are known to be strongly associated with the long-term risk of microvascular disease progression.
What are the new findings?
Here, we tested the hypothesis and found that plasma protein-bound advanced glycation end products (pAGEs) at multiple time points during the course of the Diabetes Control and Complications Trial/Epidemiology of Diabetes Interventions and Complications (DCCT/EDIC) study are also associated with the long-term risk of microvascular disease progression, independently of hemoglobin A1c.
How might these results change the focus of research or clinical practice?
Pending routine availability of instruments capable of automated determination of pAGEs, it should be feasible to evaluate the risk of microvascular disease progression based on serial determination of pAGEs.
Introduction
Advanced glycation end products (AGEs) form as a consequence of the Maillard reaction between reactive carbonyl compounds and metabolites with nucleophilic sites in proteins, lipids and DNA.1 In blood, glucose is the major carbonyl compound and glycation product in hemoglobin A1c (HbA1c). Glucose also reacts with selected lysine residues in most body proteins to form the Amadori product fructose-lysine (FL) from which AGEs such as carboxymethyl-lysine (CML) and pentosidine arise via oxidative fragmentation of FL, while glucosepane (GSPN) results from crosslinking of FL with arginine residues. An additional source of AGEs is methylglyoxal. In diabetes, it originates mostly as a by-product of glycolysis and reacts with arginine and lysine residues in proteins to form the AGE methylglyoxal hydroimidazolone 1 (MG-H1), argpyrimidine and carboxyethyl-lysine (CEL) as major targets.2 In tissues rich in ascorbic acid, such as the lens and brain, ascorbic acid is likely the major source of AGEs, many of which are identical in structure with those derived from glucose.3
From a clinical investigation and research viewpoint, HbA1c and AGEs have proven of immense value as metabolic markers in diabetes for several reasons. First, protein-bound glycation products provide a more accurate measure of cumulative exposure to the precursor reactive metabolite than its free plasma level due to the relatively long half-life of the blood or tissue protein to which they bind. The prime example is HbA1c and its correlation with fasting blood glucose levels.4 Second, protein-bound AGEs, glycoxidation and other oxidation products provide crucial information on metabolic pathways that are activated as secondary consequences of diabetes. Examples include free methylglyoxal and methylglyoxal hydroimidazolone 1 (MG-H1) in oxoaldehyde stress,5 glyoxal and CML as sources of glycoxidative stress in dyslipidemia,6 pentosidine as markers of glycoxidation7 and ascorbic acid oxidation8 and methionine sulfoxide (MetSOX), o-tyrosine (o-Tyr) and 3-nitrotyrosine (3-NT) as markers of reactive oxygen or nitration species,9 respectively, all of which were assayed in this study. Finally, AGEs can also be markers of inflammatory processes in chronic diseases other than diabetes.10
Over the years, a large number of studies were carried out on the formation and clinical significance of plasma and skin collagen-linked AGEs in relation to the development of diabetic complications in both type 1 and 2 diabetes.11 In type 1 diabetes, skin collagen AGEs are found strongly associated with future microvascular and subclinical macrovascular complication progression.12 FL (as furosine) and GSPN on the one hand, and FL (furosine) and MG-H1 on the other hand are the AGEs most strongly associated with future retinopathy and neuropathy risk, respectively.13 Similarly, macrovascular disease risk is associated with FL (furosine), MG-H1, Longwave Fluorophore-1 (LW-1)/glucuronidine and collagen-linked fluorescence. In the Oslo Diabetes Study, joint stiffness was associated with skin collagen pentosidine and methylglyoxal-lysine dimer (MOLD),14 while in the Dialong Study absence of coronary artery disease (CAD) was associated with low levels of skin collagen MetSOX while glucuronidine/LW-1 was elevated in established CAD.15 In addition, in type 1 diabetes various studies were carried out with plasma AGE. Notably, plasma protein-bound AGEs from methylglyoxal was found to be associated with kidney disease,16 whereas methylglyoxal levels and protein-bound CEL and pentosidine were associated with fatal and non-fatal cardiovascular disease (CVD) in a prospective study.17
In this study, we have asked the question of whether the strong associations we previously reported between skin collagen AGEs and the future progression risk of complications in the Diabetes Control and Complications Trial/Epidemiology of Diabetes Interventions and Complications (DCCT/EDIC) cohort13 18–20 also held true for plasma protein AGEs. The rationale for this question was that the use of skin biopsies is invasive and therefore clinically not practical for routine determination of AGEs. The DCCT/EDIC trial was initiated 40 years ago to address the question of whether tight control of glycemia would prevent or delay the progression of diabetic complications in a group of 1440 participants with type 1 diabetes, about half of whom were on intensive glycemic versus conventional glycemic control.21 Our studies using skin biopsies obtained at DCCT closeout revealed that the collagen-linked AGEs FL, GSPN and MG-H1 were strongly associated with existing and subsequent microvascular disease progression risk, even after adjustment for HbA1c levels and other variables.12 While the associations with subclinical macrovascular progression were generally weaker, overall conclusions were that a robust clinical skin biopsy AGE risk panel for microvascular disease should include at least FL, GSPN and MG-H1, whereas a subclinical disease risk marker should include at least FL, MG-H1, long wave fluorophore 1 (subsequently renamed glucuronidine) and collagen-linked fluorescence.12
Thus, the primary aim of this study was to determine if pAGEs and related plasma protein markers of oxidative and nitrosative stress determined at a single time point (TP) closest to DCCT baseline could be used for estimation of the future risk of microvascular complication progression through EDIC year 24, or whether several serial measurements would be needed. Secondary aims were to determine the effects of glycemic control on levels of pAGEs.
Research design and methods
The DCCT/EDIC cohort
The DCCT and EDIC studies have been described previously.22 23 The DCCT randomized 1441 individuals with type 1 diabetes to receive either intensive therapy (n=711) aimed at achieving blood glucose levels as close to non-diabetic levels as safely possible, or conventional diabetes therapy (n=730) aimed at averting symptoms of hyperglycemia and hypoglycemia with no glycemic targets. At baseline, the DCCT cohort consisted of a primary prevention cohort with 1–5 years of type 1 diabetes duration, no retinopathy based on seven-field fundus photographs and albuminuria <40 mg/24 hours, and a secondary intervention cohort with 1–15 years of type 1 diabetes duration, minimal to moderate non-proliferative retinopathy and albuminuria <200 mg/24 hours.
After an average of 6.5 years of follow-up, the DCCT ended in 1993 and all participants were encouraged to adopt intensive therapy and were referred to their personal healthcare providers for subsequent care. In 1994, 97% of the surviving DCCT cohort enrolled in the observational EDIC study, with over 95% person-years of active participation in the study out of the expected combined DCCT/EDIC follow-up to 2020.
Participants and biospecimen retrieval
A total of 1378 plasma samples from 466 randomly selected participants at three TPs were retrieved from the DCCT/EDIC Central Biorepository at Advanced Research and Diagnostic Laboratory, University of Minnesota, Minneapolis, Minnesota, USA and the NIDDK-NIH Biosample Repository, Bethesda, Maryland, USA (https://repository.niddk.nih.gov/home).24 Samples were shipped frozen on dry ice to the laboratory of the first author and immediately stored at −80°C on arrival. Of the 466 participants in this study, 200 and 266 participants were from the primary and the secondary cohort, respectively, and 239 and 227 were from the original DCCT intensive (INT) treatment group and the conventional (CONV) treatment group, respectively. Baseline characteristics of the participants in this study are provided in table 1 and discussed in the ‘Results’ section.
Baseline characteristics* for the subcohort with available plasma AGE biomarkers (n=466) and the full DCCT/EDIC cohort (n=1441)
Outcomes
Six microvascular disease outcomes were determined as described below. The number of events at each TP are summarized in online supplemental table 1S.
Supplemental material
Retinopathy
Standardized stereoscopic seven-field fundus photographs were obtained every 6 months during the DCCT, and every fourth year (staggered from the start of the EDIC follow-up period) during EDIC. In addition, photographs were obtained in the full cohort at EDIC years 4 and 10. The photographs were graded centrally using the final Early Treatment of Diabetic Retinopathy Study severity grading scale25 and DCCT methods,26 and graders were masked to treatment assignment and other risk factors.
Proliferative diabetic retinopathy (PDR) was defined by neovascularization observed on fundus photograph grading or the presence of scatter photocoagulation. Clinically significant macular edema (CSME) was determined using fundus photography or the presence of focal photocoagulation scars.27 28
Kidney disease
Albumin excretion rate (AER)29 was measured from 4-hour urine samples by fluoroimmunoassay from DCCT baseline through EDIC year 18 (2012). Beginning in EDIC year 19, spot urine samples were collected, and AER was estimated using the ratio of urine albumin and creatinine concentrations.30 Sustained microalbuminuria (MA) was defined as AER ≥30 mg/24 hours confirmed at the next evaluation. Serum creatinine was measured annually, and the estimated glomerular filtration rate (eGFR) was calculated using the Chronic Kidney Disease Epidemiology Collaboration equation. Sustained eGFR <60 was defined as eGFR <60 mL/min/1.73 m2 confirmed at the next evaluation.
Neuropathy
Cardiovascular autonomic neuropathy (CAN) was defined as either an R-R variation <15 or an R-R variation 15–19.9 in combination with a Valsalva ratio ≤1.5 or a decrease of >10 mm Hg in diastolic blood pressure during 10 min of standing, and was assessed up to 5 times during DCCT (DCCT baseline, DCCT years 2, 4, 6 and 8) and twice during EDIC (years 13/14 and 16/17).31 Confirmed clinical neuropathy (CCN) was defined as two or more positive responses among symptoms, sensory signs or reflex changes consistent with distal symmetrical polyneuropathy and nerve conduction study abnormalities involving two or more nerves among the median, peroneal and sural nerves, and it was assessed at DCCT baseline, DCCT year 5 and at EDIC year 13/14.32
Analytical procedures
Eleven plasma protein-bound glycation, oxidation and nitration products were quantitated in enzymatic protein digests by liquid chromatography-mass spectrometry using isotope dilution technique and a TSQ Quantum Access ESI MS/MS instrument from ThermoFisher. These included FL, GSPN, CML and CEL, pentosidine, MG-H1, MOLD, glyoxal hydroimidazolone 1 (G-H1), MetSOX, o-Tyr and 3-NT. Data were expressed in nmol or pmol/mg protein. It should be noted that significant correlations between FL, GSPN, CML and CEL with skin autofluorescence (SAF) measured at EDIC year 16 were observed but are not reported or discussed below given the low number of participants with both AGEs and SAF. The choice of AGEs used in this study was made to match those originally determined in skin biopsies so as to eventually allow us to study correlations between plasma, urine and tissue AGEs. Additional information is provided in the online supplemental table 2S.
Statistical analysis
Summary statistics (counts and percentages for binary variables, and means with SD for quantitative variables) were used to describe the baseline characteristics of the 466 participants in this study, and assessed whether they were representative of the entire DCCT/EDIC cohort (n=1441). Changes in pAGE values at TP3 versus TP2 were assessed using t-tests. Separately for each pAGE, linear GEE regression models with unstructured covariance matrices assessed the associations between repeated pAGE values and risk factors (such as systolic and diastolic blood pressure). Separately for each outcome, Kaplan-Meier estimates described the cumulative incidence of outcomes, and Cox proportional hazards (PH) models described the associations between pAGEs and the risk of subsequent events without or with adjustment for additional risk factors (such as HbA1c). Two sets of Cox PH models were conducted: one with fixed covariates using the pAGE values at TP1, and one with time-varying covariates using the pAGE values at all three TPs. Glycemic exposure (as captured by HbA1c), a potential confounder for the relationship between pAGEs and outcomes, was employed using either its value at a specific TP (called spot HbA1c value) or the mean updated value up to that specific TP calculated as a weighted average of prior HbA1c values with weights proportional to the time between evaluations. Given the exploratory nature of our study and the large number of models for the 6 outcomes and 11 plasma AGEs and oxidation markers, no adjustment for multiplicity was performed, and associations with p values <0.05 were considered nominally significant.
Results
Baseline characteristics of the pAGE subcohort versus full DCCT cohort
The pAGE subcohort were clinically representative of the entire cohort. Table 1 shows that only a few clinical variables differed in the subcohort from which pAGEs were available compared with the full cohort. There was a significantly higher proportion of participants from the original DCCT secondary intervention cohort (p<0.0001), which, by design, had longer diabetes duration.33 In addition, there were small but statistically significant differences between the subcohort and the full cohort in age (27.3±7.3 vs 26.8±7.1 years), systolic blood pressure (116.1±11.0 vs 114.5±11.4 mm Hg) and pulse rate (76.7±10.6 vs 76.1±11.1 bpm). Importantly however, mean HbA1c in the subcohort was identical (8.9%±1.6%) to that in the full cohort.
The impact of DCCT treatment group on plasma AGE levels and correlation with mean glycemia measured by HbA1c
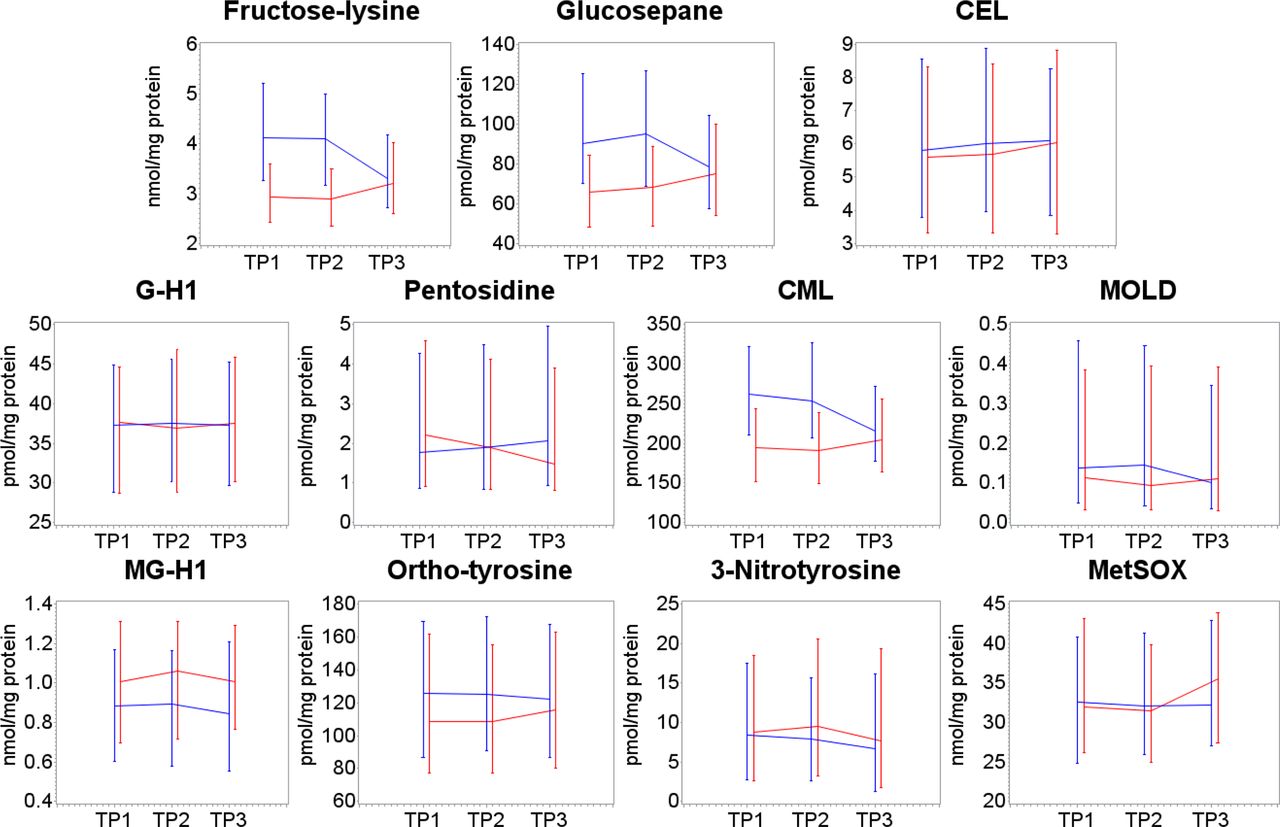
Figure 1 shows the most significant changes in mean levels of pAGEs and oxidation markers at TP1, TP2 and TP3 separately by the original DCCT treatment group (INT vs CONV). As expected, plasma protein levels of the glucose-derived markers FL, GSPN and CML were all significantly (p<0.0001) lower in the INT versus CONV at both TP1 and TP2 (figure 1, online supplemental table 3S), which confirmed the previously reported relationship between glycemic intervention and extent of protein glycation and glycoxidation. Surprisingly, MG-H1 levels were slightly increased rather than decreased at all TPs. Some of the other markers were also suppressed but these trends were not significant, except for the oxidation marker o-Tyr at TP2 only, while 3-NT was higher in the INT versus CONV at TP2.
Effect of conventional (blue lines) and intensive (red lines) glycemic control on plasma protein advanced glycation end product (AGE) levels at three time points (TPs), that is, TP1 and TP2 at Diabetes Control and Complications Trial (DCCT) year ~4 and 8, respectively, and TP3 at Epidemiology of Diabetes Interventions and Complications (EDIC) year 5–6 (DCCT year 17). Intensive control at TP1 and TP2 significantly suppresses the glucose-derived glycation products fructose-lysine, glucosepane and carboxymethyl-lysine (CML), and o-tyrosine at TP2, but not methylglyoxal hydroimidazolone 1 (MG-H1) or other markers. Data are shown as medians with first and third quartiles. CEL, carboxyethyl-lysine; G-H1, glyoxal hydroimidazolone 1; MetSOX, methionine sulfoxide; MOLD, methylglyoxal-lysine dimer.
The transition from the DCCT to the EDIC phase, corresponding to the improved glycemic control in the CONV group and lessening of control in the INT group, suppressed most differences in pAGE values at TP3 (figure 1), in accordance with similar behavior of HbA1c.21 Online supplemental table 4S reports the changes in pAGE values from TP2 to TP3, revealing significant increases in FL, GSPN and CML (p≤0.0048) in the INT group and significant decreases in the CONV group (p<0.0001). Most other pAGEs did not change significantly, except for the oxidation marker o-Tyr (which increased in the INT group, and decreased in the CONV group), and the MetSOX (which increased in both groups).
Additional analyses looked at the associations between the pAGEs values and the mean updated HbA1c at three TPs. As expected, strong correlations were observed between the glucose-derived pAGEs FL, GSPN and CML, and mean updated HbA1c (figure 1) at all TPs. HbA1c also correlated with level of o-Tyr. Statistical analysis using a linear model for repeated measures with an unstructured variance-covariance matrix structure confirmed these associations with p values <0.0001 for glucose-derived pAGEs and 0.003 for o-Tyr, while neither MetSOX nor MG-H1, among others, correlated with HbA1c (online supplemental table 5S).
Since monitoring of food consumption was not determined during the DCCT, the impact of food intake on pAGEs cannot be determined. However, while food intake is known to affect levels of urinary and free AGEs,34 protein-bound AGEs such as pyrraline or and others are not affected.35,36 This is a major reason why authors should clearly specify what form of plasma AGEs they are reporting.
Relationship between pAGEs with subsequent risk of microvascular complications
The number of individuals with clinical events after each TP through EDIC year 24 in the subcohort of 466 participants is shown in online supplemental table 1S. For all outcomes except sustained MA, the majority of events occurred after TP3. For example, of the 142 PDR events occurring after TP1, 83 (58%) occurred after TP3. The cumulative incidence curves for PDR, CSME, sustained eGFR <60, sustained AER ≥30 mg/dL, CAN and CCN are shown in online supplemental figure 2S. Overall, these trends are similar to those in the entire DCCT/EDIC cohort.28 36
FL and GSPN at DCCT TP1 were significantly associated with the subsequent risk of PDR, CSME, sustained eGFR <60, sustained MA and CCN, but not CAN, whereas CML was associated with PDR and CSME and MetSOX with both kidney disease outcomes, that is, sustained eGFR <60 and sustained MA (table 2). However, none of these associations remained significant after further adjustment for spot HbA1c, except for the association between MetSOX and kidney disease outcomes (online supplemental table 6S).
Association between plasma AGEs at TP1 (ie, DCCT year 1) and the subsequent risk of microvascular outcomes
The associations between pAGEs at the three TPs and outcomes in Cox PH models adjusted for the mean updated HbA1c, with both mean updated HbA1c and the pAGEs included as time-varying covariates are shown in table 3. In contrast to the data at TP1, following adjustment for mean updated HbA1C, PDR remained significantly associated with all three glucose-derived pAGEs and pentosidine (p<0.003 to p<0.03), CCN with FL (p=0.0007) and GSPN (p=0.0041), CSME with CML (p=0.033), CAN with MetSOX (p=0.031), while sustained eGFR was also associated with FL (p=0.038).
Association between the plasma AGEs at the three time points and the risk of subsequent microvascular outcomes in Cox PH models adjusted for the mean updated HbA1c, with both mean updated HbA1c and the plasma AGEs included as time-varying covariates
Correlations between pAGEs and other risk factors
Glucose-derived pAGEs levels, that is, AGEs whose structure can be unequivocally assigned to glucose such as FL and GSPN, were significantly associated with other variables such as age (p<0.006, except GSPN, p=0.8, not significant (NS)), diabetes duration (p≤0.003, GSPN NS), gender (CML only, p=0.023), systolic blood pressure (p≤0.0002) and inversely associated with body mass index (p<0.0001) (online supplemental table 7S). However, adjustment for these variables barely impacted the strength of the associations reported in table 3. As shown in table 4, other markers such as MetSOX did not remain associated with MA, sustained eGFR and CAN, although the trend persisted. Thus, in contrast to adjustments for HbA1c values that abolished the association of pAGEs with complications at TP1, several of the pAGEs at TP1–TP3 remained significantly associated with microvascular complications after adjustment for both mean updated HbA1c and the above-listed variables.
Association between the longitudinal plasma AGEs at the three time points and outcomes in Cox PH models adjusted for age, duration of T1D, sex, BP, BMI and mean updated HbA1c, with the pAGEs and the risk factors included as time-varying covariates
Discussion
To our knowledge, this study is the first to explore the longitudinal relationship between pAGEs at multiple TPs and glycemic control, and their association with long-term microvascular disease risk in type 1 diabetes. The major findings can be summarized as follows:
(1) The glucose-derived pAGEs (FL, GSPN and CML) are strongly associated with HbA1c throughout the DCCT/EDIC and are potently suppressed by glycemic control at TP1 and TP2 but levels merged after the end of the DCCT similar to HbA1c.21 Surprisingly, the methylglyoxal-derived AGE MG-H1 levels were not lowered by INT control, although previous studies showed correlations with glycemia in both diabetic rodents37 and humans.38 39
Among other markers, both oxidation markers o-Tyr and MetSOX were associated with glycemic control at TP3 versus TP2, but only o-Tyr levels improved at TP3 in the CONV group. Similarly, o-Tyr was the only non-glucose-derived marker that was associated with mean updated HbA1c. It should be noted that CML can also originate from glyoxal/glycolaldehyde via lipid peroxidation,6 although this pathway is likely only a minor contributor to total CML since the glyoxal hydroimidazolone G-H1 is present in very low levels in serum.
(2) If one chooses only a single TP, such as TP1, to gauge the future risk of complication, glucose-derived pAGEs are associated with neuropathy (FL, GSPN), proliferative retinopathy (FL, GSPN, CML), macular edema (CML) and sustained MA (FL, CML). MetSOX was associated with CAN (p=0.03). However, these associations did not remain significant after adjustment for spot HbA1c, that is, HbA1c closest to TP1, although the MetSOX association that was borderline significant with kidney disease now became significant. This suggests a role for oxidative stress in the pathogenesis of diabetic kidney disease.
(3) The finding that the χ2 values for the associations with subsequent complications were much higher for HbA1c than pAGEs suggest elevated mean glycemia by itself is the overarching risk factor for development of subsequent complications. Yet, repeated measurements of pAGEs over several years revealed robust associations with selected microvascular complications even after adjustment for mean updated glycemia and five other variables including age and diabetes duration. With exception of sustained eGFR and CAN, the data overall suggest glycation burden is a risk factor for PDR, CMSE, sustained MA and CAN, whereby an oxidative mechanism is also present in PDR, CSME and sustained MA, as revealed by the significant associations with CML and pentosidine, CML and MetSOX, respectively.
How do these results compare with previous studies? At first, it should be emphasized that not all ‘plasma AGEs’ methods provide the same information.40 The above measured protein-bound modifications represent mostly cumulative modifications of circulating plasma proteins by reactive keto-aldehydes while free AGE levels represent a composite of degraded protein-bound AGEs and glycated low molecular weight peptides. Their plasma levels are influenced by protein turnover rate, that is, renal, liver and muscle proteasome function, renal clearance and dietary intake.34 41 Indeed, Beisswenger et al42 who used LC/MS to quantitate the same plasma protein markers as above except for FL and GSPN, also reported that protein-bound plasma AGEs measured at one TP were not significantly associated with kidney disease progression. However, determination of plasma free AGEs (<10 kDa) at four TPs revealed significant associations between CML, CEL, MG-H1 and kidney disease, possibly implicating methylglyoxal in kidney disease progression. In contrast, while urinary free AGEs CML, CEL, MG-H1 and 3-deoxy glucosone (3DG-H) were significantly associated with diabetic kidney disease progression, urinary free oxidation markers such as MeSOX, dityrosine and 2-aminoadipic acid (2-AAA) were not.34 This would suggest oxidative stress is not a major factor in complication progression. However, in a study of 96 patients with type 1 diabetes that included DCCT participants, skin collagen MetSOX accumulated more rapidly in individuals with microvascular complications than in controls, implicating oxidative stress in the pathogenesis of microvascular disease.43 These differences suggest that tissue protein oxidative damage are more robust marker of oxidative stress than free AGEs. However, more information will be needed on the relationship between pAGEs, free AGEs and skin AGEs, and such study is currently in the planning using data already deposited in the DCCT/EDIC database.
The Joslin Medalist study looked at complications in individuals with type 1 diabetes of extreme duration (>50 years).44 In one aspect, that cohort is akin to those DCCT/EDIC participants who will still be alive ~20 years from now. In their cohort, 43% had PDR, 87% kidney disease and 39% neuropathy. Subjects with high plasma protein CEL and pentosidine were 7.2-fold more likely to have any microvascular complication, while CML and FL were surprisingly inversely related with complication risk. The latter discrepancy with our data could reflect presence of individuals who survived despite poor control, that is, survivor bias.44
The Oslo study that started in 1980 and involved 45 individuals with type 1 diabetes was the first to show that tight glycemic control was associated with delayed progression of microvascular disease. Plasma hydroperoxide levels were associated with MA45 and were improved by intensified insulin therapy, thus providing a rationale for our findings of an association between MetSOX and sustained MA. After 40 years of progression in the same study, serum CML measured 10 years prior were associated with small nerve fiber dysfunction,46 while MG-H1 correlated with heat pain threshold. Similarly, serum immunoreactive MG-H1 levels correlated with retinopathy in a random cohort of 61 Scandinavian subjects with type 1 diabetes.47 However, these associations were not confirmed by this study, although they were previously confirmed at the skin collagen level whereby both CML and MG-H1 were associated with microvascular disease in EDIC as reported by us.12 20
A major strength of our study is its prospective nature over a long follow-up time, combined with a sizable number of diabetes-related outcomes. We found that repeated measurements are needed to uncover associations that are not solely dependent on mean updated HbA1c. However, a weakness lies in the technical difficulty of obtaining highly reproducible measurements of AGE analytes over time, since several of these analytes represent <1% of the parent amino acid (eg, 3-NT, o-Tyr, MOLD, etc). We were able to deal with this issue by using Levey-Jennings quality control plots (available on request), and by assaying all three TPs back to back, which however would not be practical in routine clinical setting unless fully automated instrumentation becomes available. Thus, studies are needed to determine if samples obtained at shorter intervals, for example, three times in 1 year, are sufficient for risk prediction. Also, while we have only reported on associations between protein-bound pAGEs and microvascular disease, other studies have investigated ‘free’ plasma AGEs.48 49 In particular, associations have been reported with CVDs whereby MG-H1 or methylglyoxal are cited as a marker of acute coronary syndrome in type 2 diabetes,48 amputation and mortality,49 although vascular mean levels were not increased by diabetes. In the Veterans Admininistration Diabetes Trial (VADT) atherosclerosis study, the combination of free plasma AGEs products and oxidation products (G-H1 and 2-AAA) was strongly associated with all measures of subclinical atherosclerosis. In contrast, the immunoreactive methylglyoxal-derived tetrahydropyrimidine was not associated with microvascular or macrovascular disease in subjects with type 1 diabetes, although detectable in atherosclerotic arteries.50 Interestingly, elevated levels of serum immunoreactive MG-H1 correlated with low-grade inflammation in children and adolescents.51
The extent to which protein-bound AGEs are associated with type 2 diabetes has been investigated in relation to CVD. Hanssen et al found no independent associations of CML, CEL and pentosidine with CVD in the Hoorn and Cohort on Diabetes and Atherosclerosis Maastricht (CODAM) studies.52 However, in a subsequent study, they found associations with higher risk of incident cardiovascular events, as well as in individuals without prior cardiovascular events.53 Fosmark et al54 reported that serum levels of immunoreactive hydroimidazolone were found increased in patients with type 2 diabetes with retinopathy, independently of HbA1, and a Chinese study reported correlations between unspecified immunoreactive plasma AGEs, inflammation and carotid atherosclerosis in type 2 diabetes.55
Our study also has limitations. The power to detect associations in a Cox PH model is a function of the effect size (HR) and of the number of events. The low number of sustained eGFR events may have limited our ability to detect associations with the AGEs. Another limitation is that, given the exploratory nature of our study, no adjustment for multiple comparisons was performed. However, applying the Holm correction for 11 tests (the 11 AGEs) for a given complication would require that the smallest p value be <0.0046 (=0.05/11) for significance, two-sided, at the 0.05 level; that the second smallest p value be <0.005 (=0.05/10) and so on. Therefore, our results should be interpreted with caution.
In conclusion, the associations of protein-bound pAGEs in spot samples with microvascular complications were not independent of HbA1c levels, with exception of MetSOX for MA. However, protein-bound pAGEs in serial samples remained significantly associated with subsequent risk of PDR (FL, GSPN, CML and pentosidine), CSME (CML), sustained MA (FL, CML, MetSOX) and CCN(FL, GSPN). These data are similar (or consistent with) the results of the skin biopsies formerly obtained with only ~200 DCCT participants showing that the long-term risk of complications was highly significant for retinopathy with FL (furosine) and GSPN, kidney disease with FL/GSPN and neuropathy with FL/MG-H1 despite all adjustments. These and other studies cited above illustrate the feasibility of using plasma protein-bound or free AGEs as predictors of complications progression both in type 1 and 2 diabetes. The question of whether protein-bound pAGE are acceptable surrogate markers for skin collagen AGEs is partly answered by our findings that determination of pAGE at three TPs reveals associations that are robust to adjustment for HbA1c and several other variables. One exception is the lack of association between pAGE MG-H1 with neuropathy, while such association was significant for skin MG-H1. However, the fact that the three available TPs, which are several years apart, does not make it practical from a clinical viewpoint and therefore studies with multiple determinations only months apart will be needed.
Data availability statement
Data are available in a public, open access repository. Data are available on reasonable request. Levey-Jennings plots of pAGEs are available on request.
Ethics statements
Patient consent for publication
Ethics approval
The Ethics Committees and IRBs who approved the DCCT/EDIC trials have been described in the original publications. This study did not require fresh review and approval by an Ethics Committee since it was carried out with banked repository specimens.
References
Supplementary materials
Supplementary Data
This web only file has been produced by the BMJ Publishing Group from an electronic file supplied by the author(s) and has not been edited for content.
Footnotes
Deceased SMG since deceased
Presented at This paper is dedicated to the memory of our longtime colleague, coworker and friend, Dr. Saul Genuth, whose enthusiasm, knowledge and wisdom has inspired this work.
Collaborators All details are provided in the Supplemental Material section.
Contributors VMM, SMG and JML participated in the design of the study, IB and XG participated in the statistical design and analyses, DRS performed LC/MS analyses and the DCCT/EDIC Research Group designed the trial and collected the clinical data. VMM and IB take responsibility for the content of this article. IB and XG are the guarantors of this work and, as such, had full access to all of the data in the study and takes responsibility for the integrity of the data and the accuracy of the data analysis.
Funding This ancillary study to the DCCT/EDIC has been supported by NIDDK/NIH grant 1DP3DK101123. The DCCT/EDIC has been supported by cooperative agreement grants (1982–1993, 2012–2017, 2017–2022), and contracts (1982–2012) from the Division of Diabetes Endocrinology and Metabolic Diseases of the National Institute of Diabetes and Digestive and Kidney Disease (current grant numbers U01 DK094176 and U01 DK094157), and through support by the National Eye Institute, the National Institute of Neurologic Disorders and Stroke, the General Clinical Research Centers Program (1993–2007) and Clinical Translational Science Center Program (2006–present), Bethesda, Maryland, USA. Industry contributors have had no role in the DCCT/EDIC study but have provided free or discounted supplies or equipment to support participants’ adherence to the study: Abbott Diabetes Care (Alameda, California), Animas (Westchester, Pennsylvania), Bayer Diabetes Care (North America Headquarters, Tarrytown, New York), Becton, Dickinson and Company (Franklin Lakes, New Jersey), Eli Lilly (Indianapolis, Indiana), Extend Nutrition (St. Louis, Missouri), Insulet Corporation (Bedford, Massachusetts), Lifescan (Milpitas, California), Medtronic Diabetes (Minneapolis, Minnesota), Nipro Home Diagnostics (Ft. Lauderdale, Florida), Nova Diabetes Care (Billerica, Massachusetts), Omron (Shelton, Connecticut), Perrigo Diabetes Care (Allegan, Michigan), Roche Diabetes Care (Indianapolis, Indiana) and SanofiAventis (Bridgewater, New Jersey).
Competing interests VMM is a member of the Scientific Advisory Board of Revel Pharmaceuticals. The other authors do not report a conflict of interest.
Provenance and peer review Not commissioned; externally peer reviewed.
Supplemental material This content has been supplied by the author(s). It has not been vetted by BMJ Publishing Group Limited (BMJ) and may not have been peer-reviewed. Any opinions or recommendations discussed are solely those of the author(s) and are not endorsed by BMJ. BMJ disclaims all liability and responsibility arising from any reliance placed on the content. Where the content includes any translated material, BMJ does not warrant the accuracy and reliability of the translations (including but not limited to local regulations, clinical guidelines, terminology, drug names and drug dosages), and is not responsible for any error and/or omissions arising from translation and adaptation or otherwise.