Article Text

Abstract
Introduction Circadian rhythm disturbance occurs in type 2 diabetes, yet it is unknown whether it also exists in the prediagnostic phase of the disease. Thus, we examined the association of rest-activity circadian rhythm with 2-hour glucose levels and the risk of impaired glucose tolerance (IGT) in a nationally representative sample of adults without diabetes using a cross-sectional design.
Research design and methods We analyzed data from 2760 adults without diabetes (age ≥20) with at least 4 days of validated accelerometer recordings and a valid oral glucose tolerance test from the National Health and Nutrition Examination Survey 2011–2014. Non-parametric rest-activity circadian rhythm parameters were derived from the accelerometer recordings.
Results In the models adjusting for multiple covariates, a one-quantile increase in relative amplitude (ie, increased circadian rhythmicity) was associated with 2.66 mg/dL decrease in 2-hour glucose level (95% CI −3.94 to −1.38, p<0.001) and a decreased odds of IGT (OR 0.75, 95% CI 0.63 to 0.89, p=0.002). A one-quantile increase in intradaily variability (ie, increased rhythm fragmentation) was associated with 3.01 mg/dL increase in 2-hour glucose level (95% CI 1.52 to 4.49, p=0.001) and an increased odds of IGT (OR 1.37, 95% CI 1.19 to 1.58, p<0.001).
Conclusions Circadian disruption is significantly associated with impaired glucose homeostasis in a general population of adults without diabetes. The association of circadian rhythm abnormalities with indicators of the pre-diabetic state suggests that circadian dysfunction may contribute to early disease pathogenesis.
- circadian rhythm
- glucose tolerance test
- diabetes mellitus, type 2
Data availability statement
Data are available in a public, open access repository. NHANES data are publicly available (URL: https://www.cdc.gov/nchs/nhanes/index.htm).
This is an open access article distributed in accordance with the Creative Commons Attribution Non Commercial (CC BY-NC 4.0) license, which permits others to distribute, remix, adapt, build upon this work non-commercially, and license their derivative works on different terms, provided the original work is properly cited, appropriate credit is given, any changes made indicated, and the use is non-commercial. See: http://creativecommons.org/licenses/by-nc/4.0/.
Statistics from Altmetric.com
Significance of this study
What is already known about this subject?
Glucose tolerance shows circadian oscillations.
Tight glucose homeostasis in response to dynamic changes is achieved by our biochemical and physical regulatory system in a prompt and efficient manner.
Disturbance of circadian rhythm results in metabolic disorders, and glucose regulation is central to energy balance.
Rest-activity circadian rhythm alterations occur in patients with type 2 diabetes.
What are the new findings?
Daily rest-activity-induced mild circadian disruption exists in the prediagnostic phase of diabetes mellitus in a general population of adults without diabetes.
This disruption impacts glucose homeostasis in response to glucose challenge.
This disruption is associated with increased odds of impaired glucose tolerance.
How might these results change the focus of research or clinical practice?
The presence of circadian rhythm abnormalities in the pre-diabetic status suggests that circadian dysfunction may contribute to early disease pathogenesis and may serve as a biomarker of the intermediate stage, and that lifestyle programs enhancing circadian rhythm may be tested to attenuate the transition from pre-diabetic states to diabetes.
Introduction
Circadian (approximately 24 hours) rhythms are known to play a fundamental role in optimizing our internal physiology to balance our energy expenditure.1 2 Glucose is central to energy balance and maintaining blood glucose within physiological levels is a critical part of our overall health and wellness. It is well known that chronic hyperglycemia is a hallmark of diabetes mellitus leading to long-term vascular damage and multiorgan dysfunction.3 Previous studies using experimental protocols to force dramatic circadian disruption in the laboratory setting observed disturbed glucose control in animals and humans.4–7 Circadian disruption can also occur in a ‘real world’ setting, mainly caused by individuals’ choices or constraints on daily schedules of sleep–wake cycle and activities (such as physical activity, food intake, etc).8 However, the impact of this relatively mild but chronic circadian disturbance on glucose metabolism is less studied.
Rest-activity rhythm is a commonly used marker of circadian rhythm in studies of non-human mammals.9 In recent years, with the advance in technology, continuous accelerometer recordings have been widely used in human studies to quantify sleep quality, physical activity, and rest-activity rhythm.9–13 Several studies using 24-hour accelerometer data have found that individuals with type 2 diabetes have impaired rest-activity rhythms, indexed by decreased overall rhythmicity and increased fragmentation.14 15 A recent study16 in older men (≥65 years) further observed that impaired rest-activity rhythm was not only associated with insulin resistance and type 2 diabetes at baseline but also associated with a higher risk of incident type 2 diabetes 3.5 years later, implicating that rest-activity rhythm may serve as a unique predictor of metabolic dysfunction.
Impaired glucose tolerance (IGT) represents intermediate states of abnormal glucose regulation that exist between normal glucose homeostasis and diabetes. Although the transition from IGT to diabetes may take many years, current evidence indicates that most individuals with IGT eventually develop diabetes.17 However, multiple clinical trials have demonstrated lifestyle modification programs can reduce the risk of developing type 2 diabetes by 25%–60% over the period of follow-up,18–20 emphasizing this critical window of intervention before the development of lifelong irreversible complications. Several pathogenic pathways, including autonomic dysfunction,21 have been identified as contributors to the early stages of glucose intolerance. Whether participants with IGT also have impaired rest-activity rhythm has not been reported. In the current study, we aimed to evaluate whether rest-activity circadian rhythm disruption is associated with IGT in adults (≥20 years) without diabetes from a nationally representative sample. The establishment of the link between impaired rest-activity circadian rhythm and IGT could provide a potential target for intervention to reduce the risk from IGT to diabetes.
Research design and methods
Study population
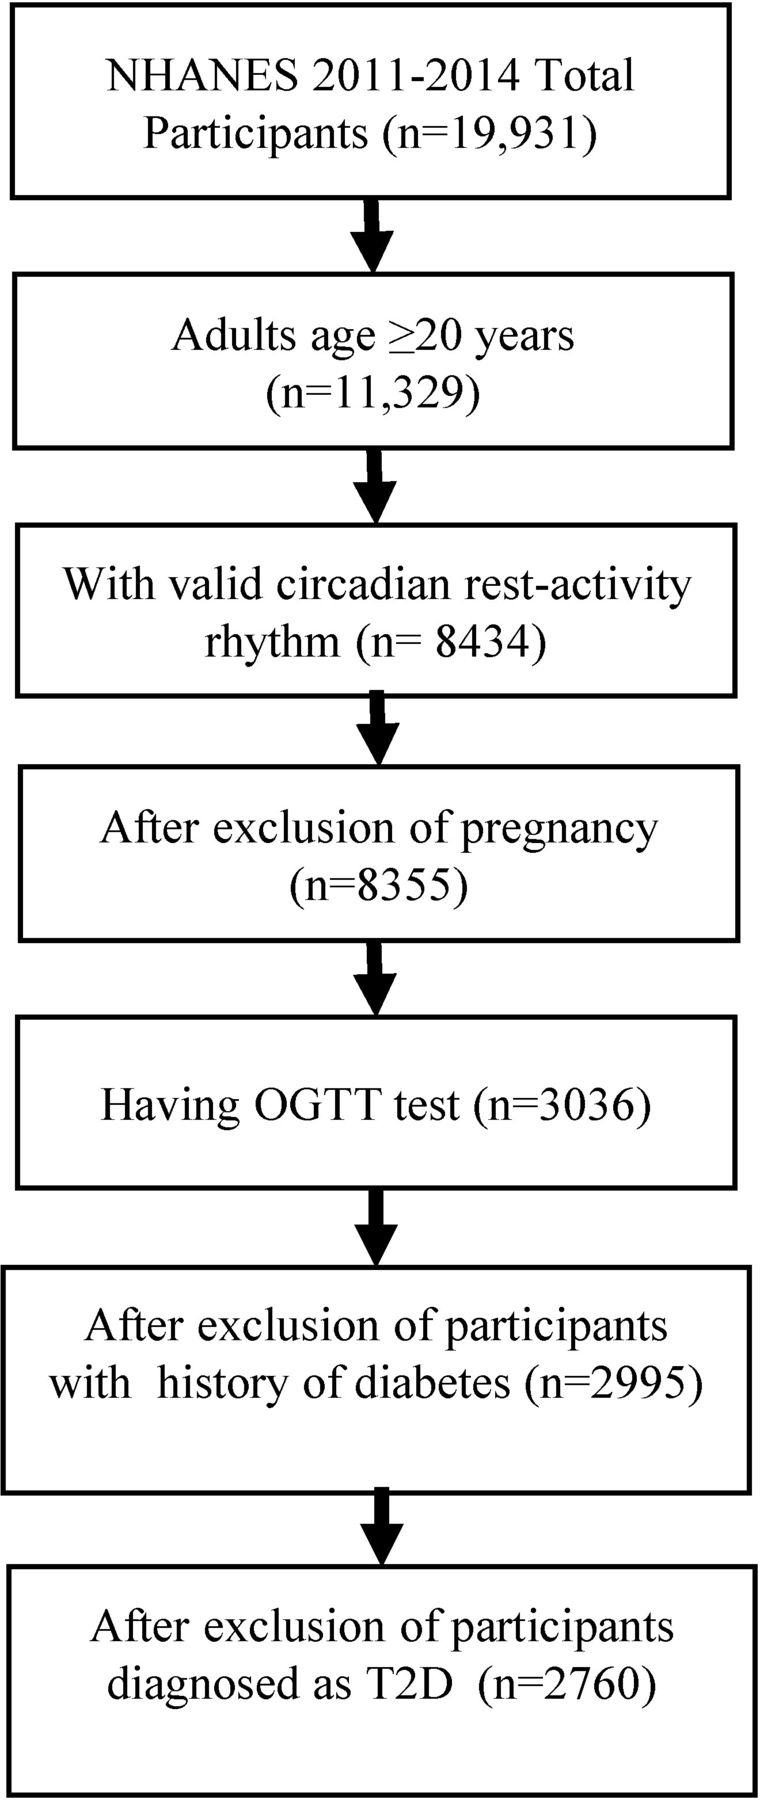
The National Health and Nutrition Examination Survey (NHANES) is a research program designed to assess the health and nutritional status of individuals in the USA. Wrist accelerometers were incorporated in the 2011–2014 NHANES study cycle and this is the first time that 24-hour objective actigraphy data are available on a nationally representative sample of US residents.22 NHANES used a multistage probability sampling design to produce a weighted, representative sample of the US population.23 Our sample included adults ≥20 years old who had at least 4 days of validated accelerometer recordings and valid oral glucose tolerance test (OGTT) data from NHANES 2011–2014 cycles (data set24). Participants who were pregnant at screening or had a history of diabetes according to personal interview questionnaires were excluded. Participants were also excluded if they met the diagnostic criteria for diabetes described by the WHO, with a fasting blood glucose level ≥126 mg/dL (≥7.0 mmol/L) or a 2-hour plasma glucose level ≥200 mg/dL (≥11.1 mmol/L).25 After review, 2760 participants who met the inclusion criteria were included in this analysis (figure 1).
Flow chart of inclusion of study participants. NHANES, National Health and Nutrition Examination Survey; OGTT, oral glucose tolerance test; T2D, type 2 diabetes.
Oral glucose tolerance test
Participants aged 12 years and older who were examined in the morning session and met a 9-hour fast were eligible for the fasting glucose blood test. After the initial venipuncture, participants were asked to drink a calibrated dose (generally 75 g of glucose) of Trutol for an OGTT and had a second venipuncture 2 hours (±15 min) after drinking the Trutol. There are several other exclusion criteria in NHANES, including hemophilia and chemotherapy safety exclusions, taking insulin or oral medications for diabetes, refusing phlebotomy, and not drinking the entire Trutol solution within the allotted time.
Participants were grouped into IGT status if their fasting plasma glucose level was <126 mg/dL (<7.0 mmol/L) and the 2-hour plasma glucose level was ≥140 mg/dL and <200 mg/dL (7.8 mmol/L and 11.1 mmol/L) according to the WHO criteria.25 Insulin resistance was indexed by fasting insulin and homeostasis model assessment (HOMA-IR), which was calculated with the following formula: fasting plasma glucose (mmol/L) × fasting serum insulin (mU/L)/22.5.26
Accelerometer recording and data preprocessing
All participants aged 6 years and older during the 2011–2012 cycle and all participants aged 3 years and older during the 2013–2014 cycle were asked to wear an accelerometer (ActiGraph Model GT3X+, ActiGraph, Pensacola, Florida) all day and night for 7 consecutive days. The device was worn on the non-dominant wrist, if possible. Raw signals obtained on the x, y, or z axes every 1/80 of a second (80 Hz) were processed, flagged, and summarized at the minute level and released by NHANES in November 2020. These summary measures in the minute summary file (PAXMIN) are specified in monitor-independent movement summary (MIMS) unit, which is a non-proprietary, open-source, device-independent universal summary metric developed by researchers at Northeastern University.27 MIMS triaxial value (variable name: PAXMTSM) at the level of every minute was used to calculate rest-activity rhythms. MIMS triaxial values were changed to missing (ie, a value of 0) if they met any of the following conditions: (1) PAXMTSM is coded as ‘−0.01’; (2) estimated wake/sleep/wear status during the minute (variable name PAXPREDM) is coded as ‘Non wear’; or (3) minute data quality flag count (variable name PAXQFM) is larger than ‘0’. R package ‘accelmissing’ was used to impute the missing count values in the accelerometer data with the following preprocessing steps: (1) the minimum minutes of missing interval were defined as 60 min; (2) valid days were defined as more than 16 hours of wearing; and (3) the minimum number of valid days that the subject should have was defined as 4 days.
Rest-activity rhythm parameters
R package ‘nparACT’ was used to compute the following non-parametric variables of rest-activity rhythms, which have been extensively described before:28 29 (1) interdaily stability (IS), which estimates how closely the 24-hour rest-activity pattern follows the 24-hour light–dark cycle (IS≃0 for Gaussian noise, IS≃1 for perfect stability); (2) intradaily variability (IV), which quantifies the fragmentation of the 24-hour rhythm (IV≃0 for a perfect sine wave, IV≃2 for Gaussian noise); (3) relative amplitude (RA), which is the relative difference between the most active continuous 10-hour period (M10) and the least active continuous 5-hour period (L5) at an average of 24 hours (midnight to midnight)—this is a non-parametric measure of the amplitude of rest-activity rhythm, with higher RA indicating more robust 24-hour rest-activity oscillations, reflecting both higher activity when awake and relatively lower activity during the night; (4) onset time of M10 (M10 start time), which indicates the starting time of the peak activity; and (5) onset time of L5 (L5 start time), which provides an indication of the starting time of nadir activity. It also provides an indication of whether a person prefers to go to bed earlier or later in the day. Evening persons defined by self-reported questionnaire of chronotype have a significantly later L5 time than morning persons.30
Covariates
Self-reported information about demographic factors regarding age, sex, ethnicity (ie, Mexican American, non-Hispanic white, non-Hispanic black, other Hispanic, and other race, including multiracial), smoking status, history of hypertension, and family income to poverty ratio was collected. Current smokers were defined when individuals reported a consumption of ≥100 cigarettes during their lifetime and were still currently smoking. Body mass index (BMI) was calculated as weight in kilograms divided by height in meters squared. Participants were categorized into ideal, intermediate, or poor leisure-time physical activity levels based on whether they met the American Heart Association recommendations31 for weekly activity based on self-reported physical activity collected by the questionnaire: ideal, 75 min or more of vigorous activity, or 150 min or more of moderate activity, or 150 min or more of combined moderate and vigorous physical activity; intermediate, more than 0 min of physical activity but less than the recommendations; and poor, 0 min of physical activity.
Statistical analysis
To account for complex survey design and produce representative estimates of the US population, analyses were conducted using the survey data analysis in STATA (V.16). Four-year survey weights were calculated and used in all analyses to adjust for unequal selection probability and non-response bias in accordance with NHANES analytical guidelines.32 Population means, proportions, and SD were estimated and reported. Survey weighted linear regression was used to assess the association of rest-activity rhythm parameters with fasting glucose, insulin, HOMA-IR, and OGTT 2-hour glucose levels. Age, sex, and ethnicity were included as covariates unless otherwise indicated. Because a one-unit change in RA, IS, or IV would reflect the difference between the extreme lower and upper ends of the range, they were divided into quartiles for the regression models. Survey-weighted multivariable logistic regression was conducted to calculate the OR for IGT over rest-activity rhythm parameters. Regression coefficients or ORs with 95% CI were used to determine the degree of association. We tested three models with increased number of covariates. Base model (model 1) included age, sex, and ethnicity as covariates. Model 2 further adjusted the ratio of family income to poverty level, smoking status, and physical activity. Model 3 further included BMI and history of hypertension as covariates. Statistical significance was set at p<0.05. Sensitivity analyses were conducted on the subgroup consisting of those who had none of the chronic diseases: cardiovascular diseases (including congestive heart failure, coronary heart disease, angina, and heart attack), stroke, and cancer for those models (n=2372, n=2206, and n=2196 for models 1, 2, and 3, respectively).
Results
The 2760 participants aged ≥20 years (mean±SD: 46.5±16.3 years) represented 158.4 million non-institutionalized residents of the USA. Of the participants, 442 were identified with IGT. Demographic and general health factors as well as rest-activity rhythm parameters are presented in table 1.
Descriptive characteristics of the study sample
The associations of rest-activity circadian rhythm parameters with 2-hour glucose, fasting glucose fasting insulin, and HOMA-IR levels as continuous variables are presented in table 2. In model 1, lower RA was significantly associated with higher levels of 2-hour glucose, fasting glucose, fasting insulin, and HOMA-IR, and higher IV was significantly associated with higher levels of 2-hour glucose. These significant associations remained in model 2 for fasting insulin and HOMA-IR and in model 2 and model 3 for 2-hour glucose levels. In the fully adjusted regression model (ie, model 3), a one-quantile increase in RA was associated with 2.66 mg/dL decrease in 2-hour glucose level (95% CI −3.94 to −1.38, p<0.001), and a one-quantile increase in IV was associated with 3.01 mg/dL increase in 2-hour glucose level (95% CI 1.52 to 4.49, p=0.001). Consistent with the findings for 2-hour glucose, across all the three logistic regression models (table 3), the odds of IGT decreased with increased levels of RA (model 1 and model 2: OR 0.73, 95% CI 0.62 to 0.86; model 3: OR 0.75, 95% CI 0.63 to 0.89). Also, a positive relationship was observed between increased levels of IV (ie, increased rhythm fragmentation) and the odds of IGT across all the three logistic regression models (model 1: OR 1.34, 95% CI 1.17 to 1.53; model 2: OR 1.39, 95% CI 1.22 to 1.59; model 3: OR 1.37, 95% CI 1.19 to 1.58). The associations between the selected covariates in each model and the outcome variables (ie, fasting glucose, 2-hour glucose, fasting insulin, and HOMA-IR) are provided in online supplemental table 1. We did not observe significant associations of IS, M10 start time, or L5 start time with fasting glucose, fasting insulin, HOMA-IR, 2-hour glucose levels, or odds of IGT. These results were not impacted by exclusion of participants with chronic diseases (data not shown).
Supplemental material
Associations of rest-activity parameters with 2-hour glucose level, fasting glucose, fasting insulin, and HOMA-IR
Associations between rest-activity parameters and the odds of impaired glucose tolerance outcome
Conclusions
In this study, we identified a significant association of impaired rest-activity circadian rhythm, indexed by decreased RA (the robustness) and increased IV (fragmentation of the rhythm), with increased 2-hour postchallenge plasma glucose concentrations and IGT in a general population of adults without diabetes. Although we cannot determine the directionality of the associations in this cross-sectional study, the finding of impaired rest-activity circadian rhythm already existing in participants with IGT, a pre-diabetic state, suggests that circadian dysfunction may contribute to early disease pathogenesis. While it has been shown in previous studies that late acrophase was associated with type 2 diabetes, we did not observe the effect of timing (L5 start time or M10 start time) on glucose tolerance.
The strength and regularity of daily rest-activity rhythm assessed by accelerometer have been linked with diabetes and diabetic complications in both cross-sectional and prospective studies.15 16 33 However, the study on the associations of rest-activity rhythms with metabolic regulation is an emerging area, especially in glucose metabolism. The majority of previous studies34–38 have used accelerometer data to explore the relationships of physical activity or sleep parameters with glucose control, rather than a chronobiological analysis of rest-activity rhythm. To the best of our knowledge, there are only two recent studies, one in older men and the other in young adults, that examined the association between rest-activity rhythm parameters and glucose concentration and both studies only included fasting blood sample measurements. The study by Xiao et al16 in men aged ≥65 years did not observe an association between rest-activity rhythm and fasting glucose, but did observe that lower amplitude and reduced overall rhythmicity were associated with higher fasting insulin and HOMA-IR, indices of insulin resistance, indicating that beta cell compensation can still keep a stable blood glucose level in the presence of insulin resistance in the fasting status. Consistent with their findings in older participants, we also observed that lower amplitude or higher fragmentation was associated with elevated fasting insulin and HOMA-IR in a broader age range of adults. However, the significance disappeared after further adjustment of BMI and history of hypertension (ie, model 3). Impaired rest-activity rhythm has been associated with higher BMI39 and higher BMI is a significant contributor to insulin resistance. There is a possibility that BMI can be a mediator rather than a confounding factor for the relationship between rest-activity rhythm and insulin resistance. Therefore, BMI was not used as a covariate in the study by Xiao et al.16 We repeated model 3 (online supplemental table 2) by excluding BMI from the list of the covariates and did observe that the significant associations of lower amplitude with elevated fasting insulin and HOMA-IR remained. Future prospective or interventional studies are warranted to distinguish between potential mediator or confounding effects of BMI in the relationship between rest-activity rhythm and glycemic metabolism. The study by Hoopes et al33 was conducted in 52 healthy adults aged 18–25 years and did not observe an association between rest-activity rhythm and fasting glucose. The negative finding from this study might be due to the small sample size and the relatively healthy status of the participants. An increase in postprandial glucose concentration may occur when fasting glucose levels are still ‘in the normal range’. It has been well acknowledged that increased 2-hour glucose during an oral glucose test is a better predictor of all-cause mortality and morbidity than fasting glucose levels.40 41 Our consistent findings of the association between increased 2-hour glucose levels and impaired rest-activity rhythm in all three models indicate that mildly disrupted circadian rhythm induced by our daily activities might be linked with impaired glucose homeostasis when our body reacts to a glucose challenge (ie, after a meal).
How the molecular machinery of circadian clock is trained by synchronizers such as food/feeding (ie, a glucose challenge) to coordinate energy metabolism inside the body is still under study. Prior studies showed that phosphorylation by nutrient-responsive adenosine monophosphate-activated protein kinase destabilizes cryptochrome 1, one of the core components that constitute the negative feedback loop of circadian rhythm, and links nutrient signals to circadian clocks.42 In addition, the circadian positive feedback loop may also be affected by the intracellular redox state. NADH (the reduced form of nicotinamide adenine dinucleotide) and NADPH (the reduced form of nicotinamide adenine dinucleotide phosphate), the redox cofactors of nicotinamide adenine dinucleotide, increase the binding of Clock:BMAL1 and NPAS2:BMAL1 to DNA, while the oxidized forms, NAD(P)+, inhibit this process.43
Our study has several limitations that should be considered in interpreting the results. First, the NHANES-based cross-sectional study design limits the ability to understand the causal inferences between blunted rest-activity rhythm and IGT. Second, the participants involved in this analysis were examined in the morning session after a 9-hour fast. Endogenous circadian variations in fasting glucose levels and 2-hour postchallenge glucose levels have been observed with poorer glucose control occurring at evening or midnight.44 Therefore, performing the glucose tolerance test at multiple time points of the day should be included in future studies to provide more solid evidence on the link between daily rest-activity-induced mild circadian disruption and glucose control disturbance. Third, the OGTT in the NHANES study did not include measurements of other metabolic characteristics, such as glucose disposal and uptake or 2-hour insulin levels, so it provides limited information regarding the change in insulin sensitivity during the OGTT process.
In summary, the finding that abnormalities of rest-activity rhythm exist in adults with IGT may indicate that glucose metabolism has already been impaired by mild disruptions in the circadian rhythm. Future studies focusing on intervention programs to promote normalization of circadian rhythms through modifications of lifestyle and behavioral factors should be conducted to confirm whether the relationship between blunted rest-activity rhythm and IGT is causal.
Data availability statement
Data are available in a public, open access repository. NHANES data are publicly available (URL: https://www.cdc.gov/nchs/nhanes/index.htm).
Ethics statements
Patient consent for publication
Ethics approval
This study involves human participants. The National Center for Health Statistics Research Ethics Review Board approved all NHANES protocols (protocol number for NHANES 2011–2014: #2011-17). Participants gave informed consent to participate in the study before taking part.
References
Supplementary materials
Supplementary Data
This web only file has been produced by the BMJ Publishing Group from an electronic file supplied by the author(s) and has not been edited for content.
Footnotes
Contributors YX performed the data analysis and drafted the manuscript. SS contributed to the conception and design of the work, transformation of the data, and interpretation of the data. WVM, CI, and HS reviewed and edited the manuscript. XW performed the data analysis, edited and revised the manuscript, and provided final approval for publication. YX and XW are the guarantors of this work and as such have full access to all the data in the study and take responsibility for the integrity of the data and the accuracy of the data analysis.
Funding This work was supported by the National Institutes of Health (grant number DK117365 and MD013307).
Competing interests None declared.
Provenance and peer review Not commissioned; externally peer reviewed.
Supplemental material This content has been supplied by the author(s). It has not been vetted by BMJ Publishing Group Limited (BMJ) and may not have been peer-reviewed. Any opinions or recommendations discussed are solely those of the author(s) and are not endorsed by BMJ. BMJ disclaims all liability and responsibility arising from any reliance placed on the content. Where the content includes any translated material, BMJ does not warrant the accuracy and reliability of the translations (including but not limited to local regulations, clinical guidelines, terminology, drug names and drug dosages), and is not responsible for any error and/or omissions arising from translation and adaptation or otherwise.