Article Text

Abstract
The study aimed to evaluate the effectiveness and safety of long-term use of closed-loop insulin system (CLS) in non-pregnant patients with type 1 diabetes mellitus (T1DM) using systematic review and meta-analysis. A literature search was performed using MEDLINE, EMBASE, and the Cochrane Library. Randomized controlled trials (RCTs) on long-term use (not less than 8 weeks) of CLS in patients with T1DM were selected. Meta-analysis was performed with RevMan V.5.3.5 to compare CLS with controls (continuous subcutaneous insulin infusion with blinded continuous glucose monitoring or unblinded sensor-augmented pump therapy or multiple daily injections or predictive low-glucose suspend system) in adults and children with type 1 diabetes. Research quality evaluation was conducted using the Cochrane risk of bias tool. Eleven RCTs (817 patients) that satisfied the eligibility criteria were included in the meta-analysis. Compared with controls, the CLS group had a favorable effect on the proportion of time with sensor glucose level in 3.9–10 mmol/L (10.32%, 8.70% to 11.95%), above 10 mmol/L (−8.89%, −10.57% to −7.22%), or below 3.9 mmol/L (−1.09%, −1.54% to −0.64%) over 24 hours. The CLS group also had lower glycated hemoglobin levels (−0.30%, −0.41% to −0.19%), and glucose variability, coefficient of variation of glucose, and SD were lower by 1.41 (−2.38 to −0.44, p=0.004) and 6.37 mg/dL (−9.19 mg/dL to −3.55 mg/dL, p<0.00001). There were no significant differences between the CLS and the control group in terms of daily insulin dose, quality of life assessment, and satisfaction with diabetes treatment. CLS is a better solution than control treatment in optimizing blood glucose management in patients with T1DM. CLS could become a common means of treating T1DM in clinical practice.
- Insulin Infusion Systems
- Glycemic Control
- Meta-Analysis
- Diabetes Mellitus, Type 1
Data availability statement
Data sharing not applicable as no datasets generated and/or analyzed for this study.
This is an open access article distributed in accordance with the Creative Commons Attribution Non Commercial (CC BY-NC 4.0) license, which permits others to distribute, remix, adapt, build upon this work non-commercially, and license their derivative works on different terms, provided the original work is properly cited, appropriate credit is given, any changes made indicated, and the use is non-commercial. See: http://creativecommons.org/licenses/by-nc/4.0/.
Statistics from Altmetric.com
Introduction
Type 1 diabetes mellitus (T1DM) is an autoimmune disease that results in the (near) destruction of pancreatic beta cells and insufficient insulin production by the pancreas and is caused by a variety of genetic and environmental pathogenic factors.1 Type 1 diabetes accounts for 5%–10% of all people with diabetes. Globally, it is estimated that 1 106 500 people aged 0–19 years have type 1 diabetes, with 132 600 new cases diagnosed each year.2 Insulin therapy was discovered between 1921 and 1922 and is considered to be crucial in the management of T1DM. Diabetes management in modern countries often includes the use of insulin analogs and mechanical technologies (such as insulin pump and continuous glucose monitors (CGM)) to improve treatment of type 1 diabetes.3
T1DM is associated with microvascular and macrovascular complications. In 1993, the Diabetes Control and Complications Trial (DCCT) for the first time demonstrated that intensive glucose lowering reduced the risk of long-term diabetes complications.4 Additionally, the DCCT and the Epidemiology of Diabetes Interventions and Complications5 (EDIC) revealed that intense insulin treatment reduces the risk of all-cause mortality, cardiovascular events, and microvascular complications, including diabetic retinopathy (DR), nephropathy, and neuropathy. Currently, intensive insulin treatment for T1DM is being adapted throughout the world.
T1DM is characterized by large fluctuations in blood glucose. Mild adjustments to insulin doses may lead to dramatic fluctuations in blood glucose. Intensive insulin treatment is a more rigorous strategy for glycemic control, but increases the risk of hypoglycemia. Therefore, a combination of real-time CGM and insulin therapy was developed which allows users to manually modify the insulin infusion rate according to the CGM value, named the sensor-augmented pump (SAP). Furthermore, recent advances have developed an artificial pancreas: the closed-loop insulin system (CLS). Its components include a subcutaneous CGM, which transmits intermittent signals containing subcutaneous glucose concentrations to a controller, which hosts a control algorithm and the user interface, and an insulin pump, which automatically delivers a subcutaneous rapid-acting insulin analog in response to glucose values. Insulin delivery is adjusted by the control algorithm in real time. Communication between the system components is wireless.6 On September 28, 2016, the US Food and Drug Administration approved the first artificial pancreatic system named Medtronic’s MiniMed 670G hybrid closed-loop system for individuals with T1DM aged over 14 years.
Systematic reviews and meta-analyses have been performed prior to this study to demonstrate that closed-loop techniques were feasible and beneficial in a variety of clinical settings.7 8 However, these meta-analyses were published prior to 2019 and the studies included had observation periods of less than 8 weeks. Since 2019, multiple studies have been published with longer follow-up periods and a large number of participants and involving multiple algorithm models. The inclusion of these studies in the analysis allows for a more comprehensive assessment of the efficacy and safety of CLS use in patients with type 1 diabetes and will provide a more solid basis for clinical use of CLS.
Materials and methods
Data sources and search strategies
Two independent reviewers searched PubMed, EMBASE, and the Cochrane Library from database inception to May 2021 for articles published in English. Search terms included ‘artificial pancreas’, ‘closed loop system’, ‘Diabetes Mellitus, Type 1’, ‘randomized clinical trials’, and their relative phrases. Details of the search strategy, including keywords and subject headings, are provided in online supplemental appendix 3. Relevant papers were retrieved with these search terms. Titles and abstracts of the articles obtained were screened by two independent reviewers and the full texts of these articles were reviewed. When a disagreement was encountered, it was discussed with a senior reviewer, and the article with the disagreement was included first, carefully read in full, and then included in the statistical analysis if it met the inclusion and exclusion criteria.
Supplemental material
Inclusion and exclusion criteria
All randomized controlled clinical trials on CLS with a study period of not less than 8 weeks were considered eligible for inclusion. Controls could be SAP therapy, conventional insulin pump therapy, and multiple daily injections (MDI) therapy. Studies with intervention duration of less than 8 weeks, pregnant women, or individuals with severe diseases or who were prescribed additional medications were excluded from the study. In addition, case reports, reviews, commentaries, editorials, and letters were excluded.
Data extraction and quality assessment
Two independent reviewers extracted the data using a standardized form online supplemental appendix 5. The following data were extracted from all the studies: demographic parameters, methodological features, primary and secondary outcome indicators, and severe adverse events. The methodological quality of each clinical trial was evaluated by the Cochrane risk of bias tool.9 Two researchers (XJ, YC) have independently evaluated the studies based on selection bias (random sequence generation and allocation concealment), detection bias (blinding of outcome assessment), performance bias (blinding of participants and personnel), attrition bias (incomplete outcome data), and reporting bias (selective reporting), as well as overall assessment of the risk of bias (other bias).
Supplemental material
Outcomes
This study evaluated the efficacy and safety of a closed-loop insulin pump in patients with type 1 diabetes. As insulin infusion in this system is automatically regulated by CGM glucose values, the proportion (%) of time in target range (TIR) (3.9–10 mmol/L or 70–180 mg/dL) not only reflects real-time changes in blood glucose but also its safety, especially in patients with unconscious hypoglycemia and nocturnal hypoglycemia, when compared with the glycated hemoglobin (HbA1c) indicator, which reflects overall blood glucose levels over a period of 2–3 months. Therefore, TIR was used as the primary outcome.
The secondary outcomes included proportion (%) of time above target range (TAR) (>10 mmol/L or >180 mg/dL), time below target range (TBR) (<3.9 mmol/L or <70 mg/dL), and HbA1c (%), which was measured at the end of the study for each study. In addition, low blood glucose index (LBGI), high blood glucose index (HBGI), coefficient of variation of glucose (CV), SD of glucose concentration (mg/dL), time below 50 mg/dL and 54 mg/dL, time above 250 mg/dL and 300 mg/dL, mean CGM glucose (mg/dL) (MG), total daily insulin dose, and body weight variation (kg) were also taken as secondary outcomes. In addition, there were post-treatment assessments of satisfaction with diabetes treatment and quality of life with diabetes. This meta-analysis summarized the adverse events associated with the intervention to assess the safety of the treatment, including all adverse events, severe hypoglycemic events, severe hyperglycemic events, and diabetic ketosis events.
Data synthesis and analysis
Meta-analysis was conducted only if the data of at least two studies were available. Data are expressed as mean±SD, and if the original data are expressed as median (IQR) they are converted to mean±SD according to the Excel spreadsheet formula (online supplemental file 1).10 11 Statistical analysis was performed with RevMan V.5.3.5 software (Copenhagen: The Nordic Cochrane Center, The Cochrane Collaboration, 2014). The mean difference or standardized mean difference (SMD) between CLS and controls (%, 95% CI), p value for the overall effect, and I² were calculated by inverse variance and random effects models.
To identify the cause of heterogeneity, a meta-regression was carried out using Stata V.16.0 for results with high heterogeneity (I2 >50%). A predefined subgroup analysis (overnight vs 24 hours, adult vs pediatric, algorithm type, study duration, type of study design, and control groups) was done to explore differences between different subgroups. Funnel chart was performed to evaluate publication bias.
Results
Description of included studies
The flow chart of the study selection process is illustrated in figure 1. A total of 117 articles were reviewed in detail; 107 studies were excluded at the full-text review stage and the DOIs or PubMed unique identifiers (PMIDs) of these ineligible studies are shown in online supplemental appendix 4. Ten articles,12–21 containing 11 studies with a total of 817 participants, were included in this analysis; one of the articles divided the study into two studies with different populations.12 The experimental groups included were all single-hormone CLS, and the control groups included continuous subcutaneous insulin infusion (CSII) with blinded CGM or unblinded SAP therapy, MDI, and predictive low-glucose suspend (PLGS) system. The research observation period ranged from 8 weeks to 26 weeks. The characteristics of the included studies are shown in table 1.
Characteristics of the included studies
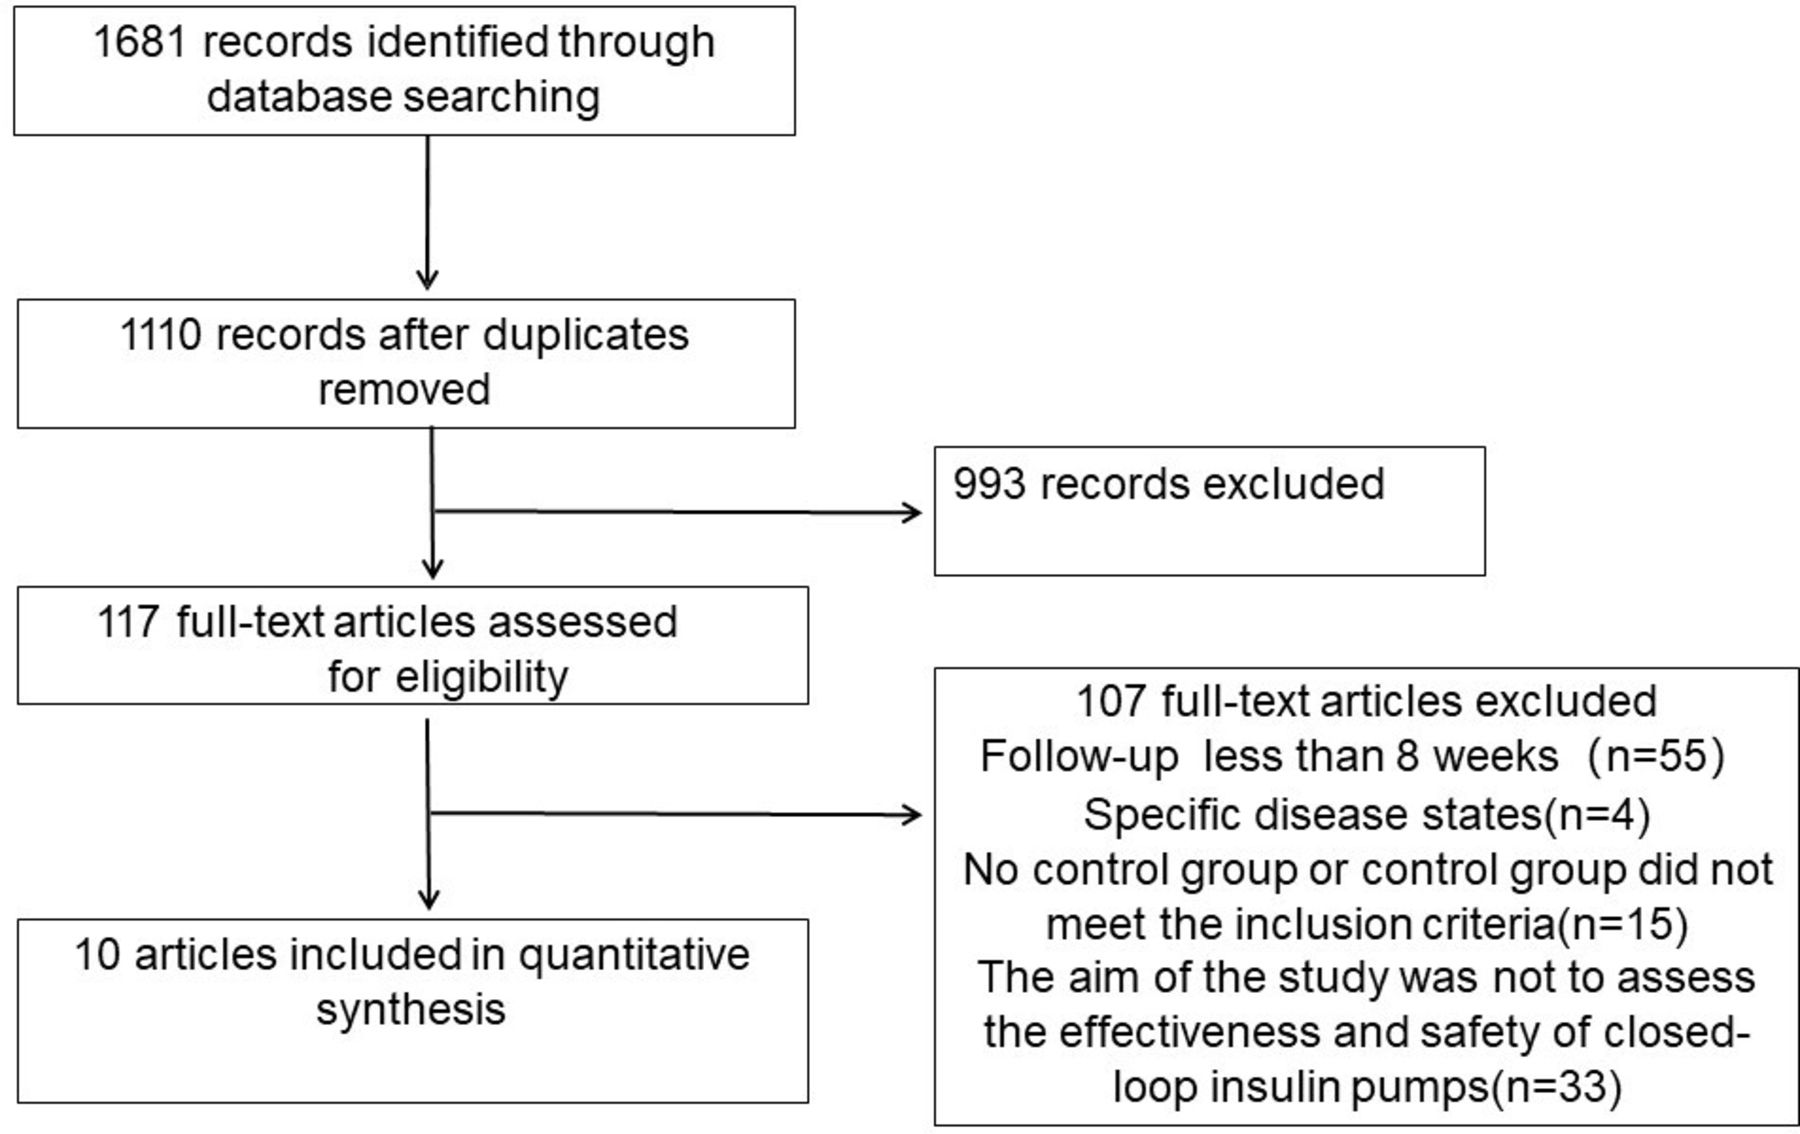
Flow chart of the study selection process.
Assessment of potential bias
None of the trials masked the participants to the intervention. The risk of selection bias, including random sequence generation and allocation concealment, was considered low. There is also a low risk of attrition and reporting bias. Other than masking, most of the studies had low risk or unclear (if the information was not available) risk of bias (online supplemental appendices 7 and 8). The studies with low risk for each component other than masking were considered. A funnel plot of the primary outcomes showed no evidence of publication bias visually (online supplemental appendix 9).
Outcomes
Time in target range
Comparisons from 10 studies were pooled to analyze TIR. Compared with controls, TIR was 10.32% (95% CI 8.70% to 11.95%, p<0.00001, I²=21%) higher in CLS, which was equal to 2 hours and 27 min per day, with a weighted mean (WM) of 56.91% (2 hours and 39 min per day) for SAP (figure 2).

Forest plot for time in target range (70–180 mg/dL). IV, inverse-variance.
Glycated hemoglobin
Compared with controls, the use of CLS demonstrated a favorable effect on HbA1c, with a decline of 0.30% (95% CI −0.41% to −0.19%, p<0.00001, I²=0%), with a WM of 7.51% for the control (figure 3).

Forest plot for glycated hemoglobin changes (%). IV, inverse-variance.
TAR, TBR, MG, GV, LBGI, and HBGI
For full-day glucose management, TAR and TBR were 8.89% (−10.57% to −7.22%, p<0.00001) and 1.09% (−1.54% to −0.64%; p<0.00001) lower with CLS compared with controls, equal to 2.14 hours and 16 min, and LBGI and HBGI were lower by 0.22 (95% CI −0.34 to −0.10, p=0.0005) and 1.94 (−2.46 to –1.42, p<0.00001), MG was 10.57 mg/dL lower (−13.12 to −8.01 mg/dL, p<0.00001), and CV and SD were lower by 1.41 (−2.38 to –0.44, p=0.004) and 6.37 mg/dL (−9.19 to −3.55 mg/dL, p<0.00001). The effect on TIR, TAR, TBR, MG, and glucose variability (GV) was consistent at night, during the day, and at 24 hours, as shown in figure 4, except for CV, which was not significantly different from the control group at night.

Forest plot of differences in sensor glucose metrics between CLS versus control, presented by time of day (24 hours, night, day). CLS, closed-loop insulin system; CV, coefficient of variation of glucose; HBGI, high blood glucose index; LBGI, low blood glucose index; MD, mean difference; MG, mean glucose (mg/dL); TAR (%), time above target range (>180 mg/dL); TBR (%), time below target range (<70 mg/dL); TIR (%), time in target range (70–180 mg/dL); V,variable.
Daily insulin dose, body weight, satisfaction, and quality of life
There were no significant differences between the CLS and the control group in terms of daily insulin dose, quality of life assessment, and satisfaction with diabetes treatment (online supplemental appendices 10 and 11). However, the CLS group weighed more than the control group after treatment (SMD=0.19 kg, 95% CI 0.03 to 0.36 kg, p=0.02; online supplemental appendix 12).
Subgroup analysis
The heterogeneity for most of the outcome indicators was relatively low (I2 <50%). However, the I2 of all night-time blood glucose-related outcome indicators was more than 50%, which was highly heterogeneous. To further investigate the source of heterogeneity, meta-regression analyses were conducted using Stata V.16.0 for age category, period of use, study duration, algorithm type, study type, and control groups. The results showed that the different control groups may be a source of heterogeneity (p=0.067; online supplemental appendix 13). Therefore, a subgroup analysis was performed on the different control groups. The results showed that differences in controls were not the main source of heterogeneity in night-time blood glucose outcome indicators (online supplemental appendix 14). The definition of night-time periods varied in the included studies, which were as follows: 23:00–07:00, 20:00–08:00, 00:00–8:00, and 00:00–06:00, respectively. This could explain the heterogeneity in night-time blood glucose outcome indicators. In addition, a subgroup analysis of the main outcome indicator TIR was performed to analyze whether there were differences between the subgroups. The results revealed that there were significant differences in TIR values between the different control subgroups. In contrast, there were no significant differences in TIR values between the other predefined subgroups (online supplemental appendix 15).
Adverse events
There were 572 participants in the CLS group and 451 in the control group. In the CLS group, there were 5 cases with diabetic ketoacidosis, 42 cases with severe hyperglycemia, and 17 cases with severe hypoglycemia. In the SAP group, there were 7 cases with diabetic ketosis, 14 cases with severe hyperglycemia, and 10 cases with severe hypoglycemia. A meta-analysis of adverse events (severe hypoglycemic events, hyperglycemic events, and diabetic ketoacidosis events) in the CLS and control groups found no significant difference in the risk of these adverse events between the two groups (online supplemental appendix 16).
Discussion
This systematic review and meta-analysis found that in non-pregnant patients with T1DM, CLS application increased TIR and decreased TBR, TAR, and HbA1c, as compared with controls, validating previous findings that glucose control improves and the risk of hypoglycemia is reduced with CLS even in longer applications.
In this study, TIR was used as the primary outcome indicator. The results revealed that the use of CLS resulted in an additional 10.32% increase in TIR when compared with controls. This TIR difference was achieved by reductions in time above and below target range, respectively. The closed-loop system allows for responsive, progressive regulation of insulin delivery, either below or above a predetermined glucose threshold range. This improves the proportion of time spent in the target glucose range and reduces average blood glucose levels without increasing the risk of hypoglycemia. TIR was described as the percentage of time for glucose levels to fall in the target range according to the recommendations of the guidelines for T1DM, starting from 70 mg/dL to 180 mg/dL.22 23 Besides being reflective of the day-to-day experience of individuals with diabetes,24 TIR can be used to predict the risk of future diabetic complications, mainly microvascular complications.25 Beck et al26 reported the relationship between TIR and the development of DR and microalbuminuria using a 7-point glucose curve from the DCCT data set to validate TIR as a clinical trial outcome measure. With each 10% decrease in TIR, there was 64% and 40% increase in the risk of DR and microalbuminuria, respectively. In contrast, it is reasonable to assume that increased TIR could retard the progression of DR and microalbuminuria. Generally, the 2021 American Diabetes Association guidelines have recommended TIR for assessment of glucose control and indicated that the target value for TIR was greater than 70%. Each 5% increase in TIR resulted in clinically significant benefits for patients with either T1DM or type 2 diabetes mellitus (T2DM).22 The significant improvement in TIR associated with CLS suggested its importance in improving glucose control and reducing the risk of future complications in patients with T1DM. Most of the previous studies covered a study period of 2 weeks or less.27–30 Studies included in this meta-analysis, however, had an observation period of 8–26 weeks. More importantly, the results obtained from the meta-analysis are consistent with previous studies.7 8 31 The longer periodicity of the studies included in this meta-analysis means that there are more variables and confounding factors and the results of these longer period studies are more convincing. Long-term use of the CLS system allows for good glycemia control over time, rather than short-term effects.
HbA1c level was used as an acceptable standard for glucose control since its recommendation by DCCT. In DCCT, an inverse relationship was found between the HbA1c value and the incidence of DR in patients with T1DM. With each 1% increase in HbA1c, the risk of DR and nephropathy increased by 54% and 42%, respectively. Moreover, other studies have confirmed higher HbA1c level as an independent risk factor for diabetic complications.32 33 This study showed that CLS has better HbA1c levels, suggesting that the use of CLS in T1DM was more likely to reduce diabetes-related complications. The control group for most of the studies included in this meta-analysis was SAP. It has been demonstrated that the use of SAP significantly improves glycemia control and reduces HbA1c levels compared with regular insulin therapy.34 Patients with CLS in this study bear a better HbA1c level even compared with those with SAP, suggesting that the use of CLS in T1DM could further reduce the risk of diabetes-related complications.
In the Beck et al26 study, it was shown that TIR was negatively correlated with HbA1c (r=−0.67) and a 10-percentile decrease in TIR should result in a decrease in HbA1c of around 0.6 percentile.35 However, a decrease of only 0.3 percentile was shown in this meta-analysis. The consistency between TIR and HbA1c could be influenced by other factors, such as glycemic variability.36 CV and SD are the metrics for GV, which reflects blood glucose fluctuations. Analysis of the DCCT data set did not show any relationship between microvascular complications and above-average GV.31 32 A larger study found no relationship between GV and composite score of cardiovascular risk.33 In the study, CV and SD were lower in CLS when compared with controls. GV was shown to be predictive of severe hypoglycemia in type 1 diabetes.37 38 This suggests that the use of CLS could reduce the risk of hypoglycemia without increasing the risk of microvascular and cardiovascular complications.
Undoubtedly, hypoglycemia acts as a barrier to improving glycemic control and compliance in clinical practice. In the Action to Control Cardiovascular Risk in Diabetes trial, it was shown that patients with T2DM in the intensive treatment group with more than one event of severe hypoglycemia had significantly higher annual mortality than those without severe hypoglycemia, suggesting that severe hypoglycemia is an important cause of increased mortality.39 It is reasonable to speculate that this also applies to patients with T1DM. Acute hypoglycemia could exacerbate chronic inflammation, endothelial dysfunction, and arteriosclerosis by its proinflammatory effects.40 This meta-analysis used TBR, time below 3 mmol/L and 3.3 mmol/L (50 mg/dL and 54 mg/dL), and LBGI to assess the risk of hypoglycemia and showed that these measurements improved compared with controls. This suggests that the use of CLS may reduce the risk of hypoglycemia and thus reduce mortality in patients with type 1 diabetes.
Some of the adverse events observed in the CLS group occurred as a result of operator error, device disconnection, and low battery levels. This requires clinicians to train patients more carefully and correctly in the use of CLS, such as with device disconnections or battery replacements, and demand professionals to check the device regularly. Although their quality of life did not improve significantly compared with the control group, subjects in the CLS group felt more positive about their diabetes status and gained greater satisfaction from managing their condition compared with the control group. The absence of an increase in diabetes treatment satisfaction or a reduction in diabetes distress in our trial could partly be explained by the counterbalancing of potential benefits with the burden of adding new technology to diabetes self-management or trial protocol requirements.
The strengths of this meta-analysis are the high-quality studies included, which are multicenter and multicountry studies, the long follow-up period of not less than 8 weeks, and the wide age range of participants from children to seniors, supporting the generalizability of the findings. Limitations of the analysis included statistical assumptions, such as deriving the mean and SD from the median and IQR, respectively. Specific definitions of night-time varied among the studies included, but was taken as 12 hours when calculating the specific time, which might overstate the effect of nocturnal glucose control. The most important limitation is the heterogeneity of the control groups. It is indeed very different to have an insulin pump or an MDI treatment, for example.
Conclusion
Long-term use of CLS improved glucose control and reduced the occurrence of hypoglycemia and GV in non-pregnant patients with T1DM as compared with controls (CSII with blinded CGM or unblinded SAP therapy or MDI or PLGS system). CLS could be widely used in clinical practice in the future for long-term treatment of patients with T1DM (even be applied to T1DM outpatients for lifetime).
Data availability statement
Data sharing not applicable as no datasets generated and/or analyzed for this study.
Ethics statements
Patient consent for publication
References
Supplementary materials
Supplementary Data
This web only file has been produced by the BMJ Publishing Group from an electronic file supplied by the author(s) and has not been edited for content.
Footnotes
Contributors XJ and YC were responsible for data mining and analysis and for statistical analysis. YS and XJ were responsible for study concept and design and drafting of the manuscript.
Funding This work was supported by the Key R&D Program of Jiangxi Province (grant number 20192BBG70027) and the National Natural Science Foundation of China (NSFC) (grant number 81860151).
Competing interests None declared.
Provenance and peer review Not commissioned; externally peer reviewed.
Supplemental material This content has been supplied by the author(s). It has not been vetted by BMJ Publishing Group Limited (BMJ) and may not have been peer-reviewed. Any opinions or recommendations discussed are solely those of the author(s) and are not endorsed by BMJ. BMJ disclaims all liability and responsibility arising from any reliance placed on the content. Where the content includes any translated material, BMJ does not warrant the accuracy and reliability of the translations (including but not limited to local regulations, clinical guidelines, terminology, drug names and drug dosages), and is not responsible for any error and/or omissions arising from translation and adaptation or otherwise.