Article Text

Abstract
Introduction Gestational diabetes mellitus (GDM) is a consequence of an imbalance between insulin sensitivity (IS) and secretion during pregnancy. MicroRNAs (miRNAs) are small and secreted RNA molecules stable in blood and known to regulate physiological processes including glucose homeostasis. The aim of this study was to identify plasmatic miRNAs detectable in early pregnancy predicting IS at 24th-29th week of pregnancy.
Research design and methods We quantified circulating miRNAs in 421 women in plasma collected at 9.6±2.2 weeks of pregnancy using next-generation sequencing.
Results we detected 2170 miRNAs: 39 (35 positively and 4 negatively) were associated with IS as estimated by the Matsuda Index at 26.4±1.0 weeks of pregnancy. Lasso regression identified 18 miRNAs independently predicting Matsuda Index-estimated IS. Together with gestational age, maternal age and body mass index at first trimester, they explain 36% of IS variance in late second trimester of pregnancy. These miRNAs regulate fatty acid biosynthesis and metabolism among other pathways.
Conclusions In summary, we have identified first trimester plasmatic miRNAs predictive of Matsuda Index-estimated IS in late second trimester of pregnancy. These miRNAs could also contribute to initiate and support IS adaptation to pregnancy potentially through lipid metabolism regulation.
- epigenetics
- gestational diabetes mellitus (GDM)
- next-generation sequencing
- pregnancy
Data availability statement
Data are available on reasonable request. The datasets generated during and/or analyzed during the current study are available from the corresponding author on reasonable request.
Data availability statement
The datasets generated during and/or analyzed during the current study are available from the corresponding author on reasonable request.
This is an open access article distributed in accordance with the Creative Commons Attribution Non Commercial (CC BY-NC 4.0) license, which permits others to distribute, remix, adapt, build upon this work non-commercially, and license their derivative works on different terms, provided the original work is properly cited, appropriate credit is given, any changes made indicated, and the use is non-commercial. See: http://creativecommons.org/licenses/by-nc/4.0/.
Statistics from Altmetric.com
Significance of this study
What is already known about this subject?
Gestational diabetes mellitus (GDM) is a consequence of an imbalance between insulin sensitivity (IS) and secretion during pregnancy.
MicroRNAs (miRNAs) are small RNA molecules secreted by cells and stable in blood and known to regulate physiological processes including glucose homeostasis.
What are the new findings?
We found that 39 plasmatic miRNAs were associated (35 positively and 4 negatively) with IS.
18 miRNAs along with gestational age, maternal age and body mass index at first trimester independently predict IS in late second trimester of pregnancy.
These miRNAs could contribute to initiate and support IS adaptation in pregnancy.
How might these results change the focus of research or clinical practice?
Provides new insights on the molecular mechanisms behind IS regulation in pregnancy to develop prevention and therapeutic strategies to prevent GDM development.
Introduction
Pregnancy is a period of phenomenal and rapid metabolic changes in expecting women to support fetal growth and development.1 The second trimester of pregnancy is characterized by a decrease in insulin sensitivity (IS) to accommodate the fetus needs in nutrients, mainly glucose.1 The decline in IS is normally compensated by a maternal increase in insulin production supported by pancreatic beta-cell hyperplasia and hypertrophy to maintain glucose homeostasis during pregnancy.2 However, an imbalance between insulin secretion capacity and IS decrease—sometimes superimposed to the pre-existing loss of IS prior to pregnancy—can lead to maternal hyperglycemia and gestational diabetes mellitus (GDM). GDM is the most common complication affecting up to 25% of pregnancies depending on ethnicity and diagnostic criteria3 and has serious consequences on the health of both the mother and her child.4 5 Although the treatments of GDM (ie, diet and insulin if needed) can help to prevent some of its short-term complications,6 their effect on longer-term consequences is uncertain.7–10 Understanding the molecular mechanisms leading to GDM and more specifically to abnormal IS changes is of clear interest for potential future preventive and treatment innovations.
MicroRNAs (miRNAs) are short single-stranded RNA molecules of 19–25 nucleotides in length. Their hybridization to their target messenger RNA (mRNA) leads to its instability and to downregulation of protein synthesis.11 MiRNAs regulate several physiological processes, including glucose homeostasis and those related to fetal growth and development, with some miRNAs preferentially expressed by the placenta.12 These miRNAs are encoded in three clusters: one on the chromosome 14 (C14MC) and two on the chromosome 19 (C19MC and miR-371-3).12 C14MC miRNAs are abundantly expressed in early pregnancy and then decline progressively until delivery, whereas C19MC miRNAs become more abundant in blood circulation as the pregnancy progresses.12 These miRNAs are mainly expressed by the trophoblasts and secreted into maternal circulation, which is believed to contribute to feto-maternal communication.13 These and other miRNAs secreted by the placenta or by other tissues could thus contribute to initiate and support IS adaptation if secreted early in pregnancy. Identifying these miRNAs will provide new insights into the pathophysiological processes of IS and glucose metabolism regulation in pregnancy.
We hypothesized that maternal circulating miRNAs detected during the first trimester are associated with IS later in pregnancy. We quantified plasma miRNAs collected at first trimester (before the 16th week) of pregnancy and aimed to identify miRNAs associated with and predictive of maternal IS assessed between the 24th and 29th week of pregnancy corresponding to the usual window of time of GDM screening and diagnosis.
Methods
Participant’s selection
We selected participants from the Genetics of Glucose regulation in Gestation and Growth (Gen3G) birth cohort described earlier.14 Gen3G included women if they were ≥18 years old, free of medication affecting glucose tolerance and with a singleton pregnancy but excluded those with diabetes (reported or detected by glucose or A1c screening) at their first trimester visit (between 4th and 16th weeks of pregnancy). A total of 854 women completed a 75-g oral glucose tolerance test (OGTT) between their 24th and 29th week of pregnancy and were followed until delivery. GDM diagnosis was made according to the International Association of the Diabetes and Pregnancy Study Group guidelines.15 Body mass index (BMI) was computed with the formula: weight (kg)/height (m2). For this study, we selected 444 women of European descent for which a plasma sample (500 µL) collected at first trimester of pregnancy was available, and who had follow-up visits at 3 or 5 years after delivery to support future studies. The study sample comprised the general population of pregnant women, which also included women with GDM (n=53), either pre-eclampsia (PE) or gestational hypertension (GH; n=46) or with both conditions (GDM and PE or GH; n=6). We decided to keep women with complicated pregnancies (GDM, PE or GH) as in principal their condition was still unknown at the time of sample collection and because we had interest to test for association with their development or related phenotypes (eg, IS) overtime. This study was approved by the ethics review board of CIUSSS de l’Estrie-CHUS (Projet No MP-31-2019-3059–DxDG) and all participants provided informed written consent for their inclusion in the study.
Blood glucose and lipid markers
In plasma samples collected between 24th and 29th week of pregnancy, we measured glucose and insulin levels using glucose hexokinase method (Roche Diagnostics) and Human Milliplex map kits (EMD Millipore, catalog no HMHEMAG-34K), respectively,14 as well as total cholesterol, high-density lipoprotein cholesterol (HDL-C) and triglyceride levels using colorimetric methods (Johnson & Johnson Clinical Diagnostics). We estimated IS with the Matsuda Index using the formula: 10 000/√((fasting glucose×fasting insulin)×(mean glucose×mean insulin during OGTT)),16 with concentrations in glucose and insulin being expressed as mg/dL and µU/mL.17 We excluded from the analyses participants for which data were missing for the Matsuda Index (n=15). We computed low-density lipoprotein cholesterol (LDL-C) concentration with the Friedewald’s equation.14
RNA extraction
We applied the MirVana PARIS kit (Thermo Fisher Scientific, catalog no AM1556) standard protocol to extract, in a randomized order, the total RNA from 500 µL of plasma collected between 4th and 16th week of pregnancy and kept it at −80°C until processing. Total RNA was eluted in 75 µL of nuclease-free water and then precipitated as described by Burgos et al.18 Briefly, 70 µL of RNA were mixed with 35 µL of cold (4°C) 7 M ammonium acetate solution (Thermo Fisher Scientific, catalog no 02002268) and then with 420 µL of chilled (−20°C) absolute ethanol (Commercial Alcohols, Ontario, Canada; catalog no P006EAAN), followed by an overnight precipitation at −20°C. The precipitated RNA solutions were then centrifuged at 16 000 g at 4°C for 30 min. The RNA pellet was washed twice with 200 µL of cold 80% ethanol followed by centrifugation at 16 000 g at 4°C for 5 min, dried for 30 min at room temperature and resuspended in 5 µL of nuclease-free water.
Library preparation
We randomized the RNA samples before library preparation using the Truseq Small RNA Sample Prep kit (Illumina, British Columbia, Canada; catalog no RS-200-0012). We applied the standard protocol adapted by Burgos et al18 which uses half of the recommended reagent volumes for ligation (3′ and 5′ ends) of RNA samples (5 µL), reverse transcription, barcoding (index 1–20: one index per sample) and PCR amplification (15 cycles). This ensures that the optimal ratio between reagents and the limited amount of RNA is maintained as much as possible. The libraries were purified and size-selected (145–160 bp) by migration on a Novex polyacrylamide TBE Gel, 6% (Thermo Fisher Scientific, catalog no EC6265BOX) before overnight elution in 300 µL of nuclease-free water at room temperature and 500 RPM on an incubating microplate shaker (VWR, Ontario, Canada; catalog no 12 620-930). Then they were precipitated following manufacturer instructions (including a 30 min incubation of the precipitation mix at −80°C) and resuspended in 25 µL of 10 mM Tris-HCl pH 8.5 buffer.
Library quality control and sequencing
The libraries were tested for quality, quantified, pooled and sequenced at the McGill University and Génome Québec Innovation Centre (Québec, Canada). Briefly, the quality of the libraries (ie, concentration, library length and primer dimers absence) was evaluated using either the Agilent High Sensitivity DNA Kit (Agilent, Mississauga, Ontario, Canada; catalog no 5067-4626) on the Agilent 2100 Bioanalyzer or the Kapa Illumina GA with Revised Primers-SYBR Fast Universal kit (Kapa Biosystems; library concentration) and the LabChip GX instrument (PerkinElmer, catalog no CLS760672; library length and absence of primer dimers).
Either the HiSeq 2500 or HiSeq 4000 platforms were used. Each library was quantified by quantitative PCR, equimolarly pooled (HiSeq 2500: 7pM final molarity; 12 libraries with different indexes per lane; HiSeq 4000: 10 pM final molarity; 20 libraries with different indexes per lane), denatured and clustered on single-read Illumina flow cells (catalog no GD-401-3001 and catalog no GD-410-1001) according to the manufacturer’s standard procedure. The libraries were then sequenced on either an Illumina HiSeq 2500 or HiSeq 4000 sequencing platform for 50 cycles, with 7-cycle indexing reads. To ensure comparability and standardization of data between platforms, 12 samples were extracted twice and sequenced on both platforms. These samples showed high correlation in miRNA levels (ie, Pearson correlation coefficient ≥0.94)19 and confirmed that our sequencing approach is accurate.
Bioinformatics analysis of the sequencing data
We applied the extracellular RNA processing toolkit (exceRpt) pipeline V.4.6 from Rozowsky et al20 developed to analyze the small RNA sequencing data. Briefly, exceRpt removed the sequences of the adapters and bad-quality reads (Phred score <20 for 80% or more of the read) with FASTX-Toolkit. Using STAR, high-quality sequences were mapped to the human genome (GRCh37) and miRBase V.21. Although exceRpt was optimized for low concentration small RNA analysis, we decided not to exclude the reads mapping to the ribosomal RNAs (rRNAs) because there was very little contamination by rRNA sequences in our samples (average of 1.04%±0.90% of total reads mapped to genome). After visualization of raw read counts, we removed eight outlier samples with less than 500 000 (n=7) and more than 25 M (n=1) miRNAs’ read counts.19
Statistical analysis
The natural log (ln) transformation was applied to the Matsuda Index to normalize its distribution. We then applied the DESeq2 R package21 to identify miRNAs associated with IS estimated by the Matsuda Index. Briefly, all miRNAs detected in our samples were included in the analysis. Default parameters of DESeq2 were applied, including a false discovery rate (FDR)-adjusted q-value threshold set at ≤0.05. Read counts from samples that were sequenced both in the pilot and the full study (n=12) were combined using the collapseReplicates function of DESeq2 package. The model was corrected for the sequencing run and lane as well as the maternal age, BMI and gestational age at first trimester visit (at the time of collection of plasma sample used for miRNA quantification). Volcano plot was generated using the EnhancedVolcano package.22 To identify miRNAs independently predicting IS, we computed a lasso regression model with MASS package V.7.3-51.4 and glmnet V.2.0-18 using miRNAs that were significantly associated with IS after FDR correction for multiple testing.
To validate further the results obtained from the biological pathway analysis (described below), we tested the correlations between the miRNAs (n=4) linked to lipid metabolism pathways and blood lipid (ie, triglycerides, LDL-C, HDL-C) levels measured between 24th and 29th week of pregnancy in Gen3G. Pearson partial correlation coefficients, as well as scatterplot (ggplot2 package), were computed with the ppcor package to assess and visualize associations between miRNAs and Matsuda Index or blood lipid levels. Analyses were Bonferroni adjusted for multiple testing (p≤0.0042 (blood lipid levels; 0.05 (p-value threshold)/12 tests (four miRNAs and three lipids) or ≤0.01 (Matsuda Index; 0.05 (p-value threshold)/5 tests).
Interactions between miRNAs
When comparing results from DESeq2 and the lasso regression models, we found discrepancies in the directions of the associations for five miRNAs. Contrary to DESeq2, lasso regression retained multiple (n=18) miRNAs in a single model suggesting that the observed changes in the sign of the associations could be explained by miRNA interactions. Collinearity was assessed with the variance inflation factor from the car package and Pearson correlation coefficients. We thus tested potential interactions between miRNAs in linear regression model including an interaction term. Bonferroni correction for multiple testing was applied (0.05 (p-value threshold)/75 potential interactions; statistically significant at p≤0.00067). R V.3.6.0 in R studio V.1.2.5001 was used for statistical analysis.
Biological pathway and miRNA-mRNA interaction network analyses
We carried out a Kyoto Encyclopedia of Genes and Genomes (KEGG) pathway analysis with the mirPath V.3 software.23 All the miRNAs predicting IS (selected in the lasso regression model) were included in the analysis. Tarbase V.7.0 database24 was used as this only considers miRNA:mRNA interactions validated experimentally. P-value threshold was set to ≤0.05, FDR correction was applied and enrichment analysis method was Fisher’s exact test (hypergeometric distribution), following the default setting in mirPath V.3. Results were merged using pathway union parameters. Only pathways with three or more associated miRNAs were considered for interpretation. miRNA-mRNA interaction networks were built using miRNA-mRNA interactions extracted from Tarbase V.7.024 and visualized with Cytoscape V.3.8.3.25 Only seven miRNAs that predicted IS and 35 mRNAs targeted by two or more miRNAs were selected to visualize the network.
Results
Participant’s description
Characteristics of the participants are shown in table 1. On average, women were aged 28.5±4.3 years, had a mean BMI in the overweight range (BMI=26.0±6.0 kg/m2) and had a glycemia within the reference values (1-hour post-50-g glucose challenge test (GCT) glycemia=5.7±1.4 mmol/L) at their first visit (gestational age=9.6±2.2 weeks). At their second visit (gestational age=26.4±1.0 weeks), women had a mean Matsuda Index of 8.4±4.9 AU, and a total of 55 out of the 421 selected women had GDM (13%).
Characteristic of the 421 Gen3G participants included in this study
Associations between miRNAs measured between 4th and 16th week and IS estimated by the Matsuda Index between 24th and 29th week of pregnancy
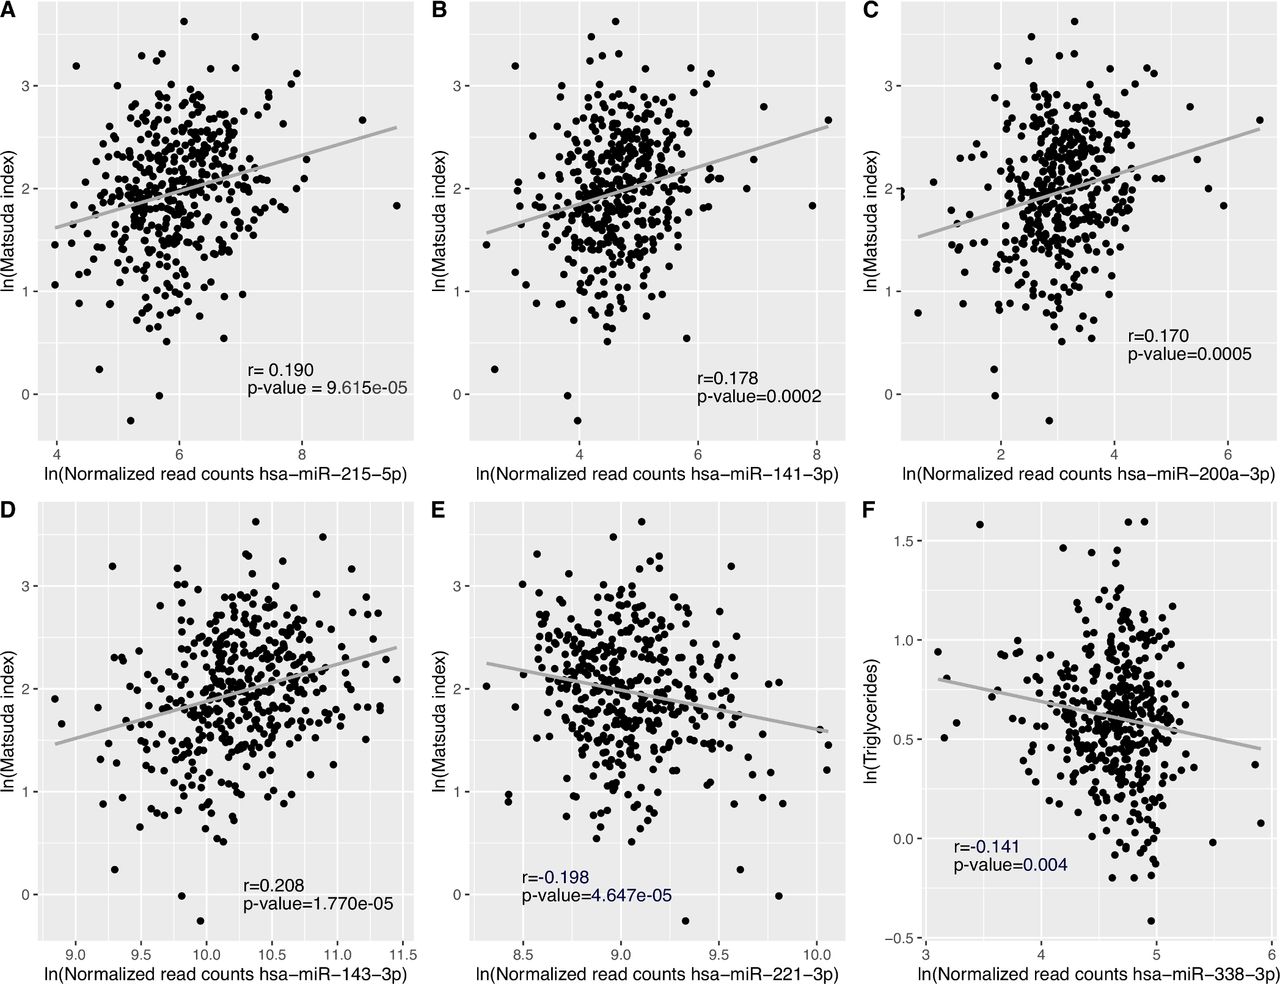
We detected a total of 2170 plasmatic miRNAs with a mean raw read count of 2639±47 057. Of these, 484 were detected with more than one read in 90% or more plasma samples and 270 of which were detected in all 421 samples. Figure 1 shows the 39 miRNAs associated with IS estimated using the Matsuda Index. Online supplemental table 1 presents the full list of associated miRNAs with their mean normalized read counts, the percentage of samples in which they were detected, their fold changes (FCs) and raw and FDR-adjusted p-values. FCs represent changes in miRNA counts per one unit increase in ln transformed Matsuda Index value. Further adjustment for familial history of type 2 diabetes was applied but did not change the results (data not shown). Among these 39 identified miRNAs, higher levels of 35 miRNAs were associated with higher IS (FC ranging from 1.096 to 1.776), whereas we observed that higher levels of only 4 miRNAs were associated with lower IS values (FC ranging from 0.921 to 0.609). Fifteen (38%) of identified IS-associated miRNAs are located within the C19MC. Among the 39 miRNAs associated with IS, the 5 most significant miRNAs based on FDR adjusted q-values were hsa-miR-215-5p (FC=1.438, q=0.0003), hsa-miR-141-3p (FC=1.397, q=0.0009), hsa-miR-200a-3p (FC=1.377, q=0.0026), hsa-miR-143-3p (FC=1.186, q=0.0027) and hsa-miR-221-3p (FC=0.892, q=0.0027). Only hsa-miR-221-3p was associated with lower IS. Pearson partial correlations adjusted for gestational age, as well as maternal age and BMI at first trimester between Matsuda Index (ln) and each of these five miRNAs (ln) were also computed and shown in figure 2A–E. Each of these miRNAs explain ~4% of IS variance assessed 4 months later on average.
Supplemental material

Plasmatic miRNAs at first trimester of pregnancy associated with IS estimated by the Matsuda Index at the second trimester of pregnancy. The model has been adjusted for sequencing lanes and runs, as well as gestational age, maternal age and BMI at first trimester of pregnancy. Fold change in miRNA abundance is for the change of 1 AU of ln transformed Matsuda Index. Horizontal dotted line is the threshold for FDR-adjusted p-value ≤0.05. Names of miRNAs from the C19MC cluster are in blue. AU, arbitrary unit; BMI, body mass index; FDR, false discovery rate; IS, insulin sensitivity; miRNAs, microRNAs; NS, not significant.

Pearson partial correlations between miRNAs, Matsuda Index and triglyceride levels. (A)-(E) DESeq2 normalized reads counts for top five miRNAs associated with IS, and Matsuda Index values were ln-transformed to normalize the distribution of data. The models were adjusted for gestational age, as well as maternal age and BMI at first trimester of pregnancy. Results were considered statistically significant at Bonferroni-adjusted p-value ≤0.01 (0.05 (p-value threshold)/5 tests). (F) DESeq2 normalized read counts and triglyceride levels were ln-transformed to normalize the distribution of data. The model was adjusted for gestational age, as well as maternal age and BMI at first trimester of pregnancy. Results were considered statistically significant at Bonferroni-adjusted p-value ≤0.0042 (0.05 (p-value threshold)/12 tests: four miRNAs and three lipids). BMI, body mass index; IS, insulin sensitivity; miRNAs, microRNAs.
Prediction of estimated IS assessed between the 24th and the 29th week of pregnancy
Starting with the 39 miRNAs associated with IS and applying lasso regression, we identified 18 miRNAs independently predicting IS measured between the 24th and 29th week of pregnancy. These 18 miRNAs along with gestational age, as well as maternal age and BMI in early pregnancy, explained 36% of the variability of Matsuda Index-estimated IS assessed at the end of the second trimester (table 2).
Lasso regression model for prediction of insulin sensitivity estimated by the Matsuda Index at the end of the second trimester of pregnancy
For five miRNAs, higher levels were associated with a higher IS when considered independently in DESeq2 and were associated with lower IS when considered together with the other 13 miRNAs in the predictive lasso model. After excluding collinearity to explain this apparent discrepancy (DESeq2 vs lasso regression models), we explored the possibility of interactions between predictive miRNAs using regression analyses including an interaction term (online supplemental table 2). In summary, for miRNAs with discrepant sign of association between DESeq2 and lasso, one or more significant interaction terms were found and restored initial results.
Supplemental material
Biological pathway analysis of miRNA predicting IS
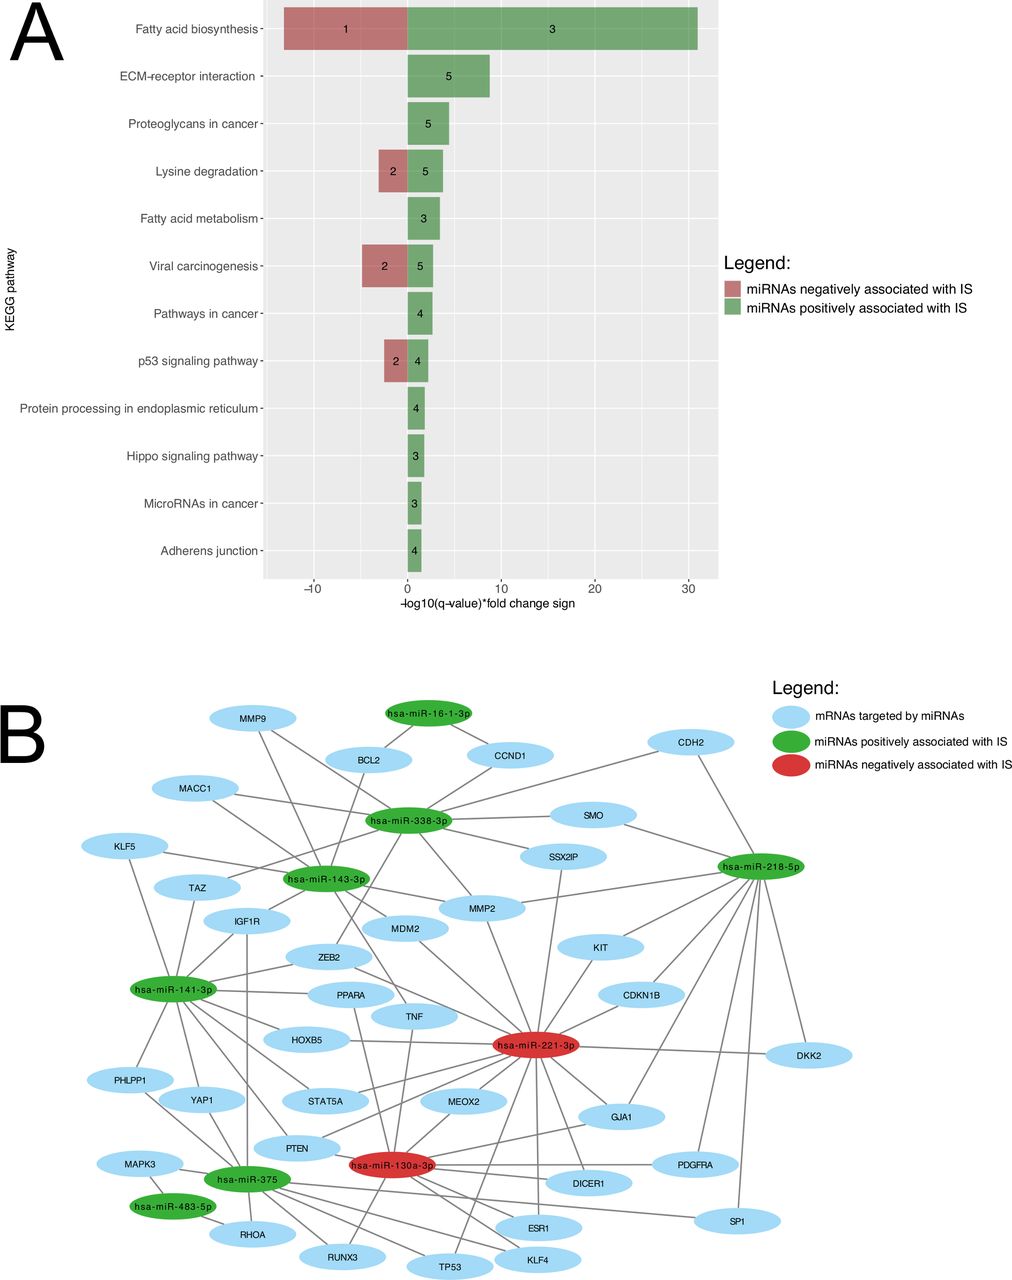
Union pathway analysis identified 12 KEGG pathways that were targeted by 18 miRNAs associated with and predicting IS. These include lipid metabolism-related pathways, among others (figure 3A). A miRNA-mRNA network is shown in figure 3B to visualize how the miRNAs predicting IS and the mRNAs they are regulating are linked together. Fatty acids biosynthesis was ranked 1st for miRNAs both positively (FDR-adjusted p-value <1×10−325; hsa-miR-143-3p, hsa-miR-218-5p, hsa-miR-338-3p) and negatively (FDR-adjusted p-value=6.28×10⁻¹⁴; hsa-miR-130a-3p), while fatty acid metabolism was ranked 5th for miRNAs positively associated with IS (hsa-miR-143-3p, hsa-miR-218-5p, hsa-miR-338-3p).
Biological pathway’s enrichment analysis and miRNA-mRNA interaction analysis of miRNAs predicting IS. (A) KEGG pathways are presented according to their respective FDR-adjusted p-value. Green bars represent miRNAs positively associated with IS, whereas pathways negatively associated miRNAs are shown as red bars. The number of miRNAs regulating the identified pathway are shown within the green and red bars. (B) Interactome showing relation between miRNAs predicting IS and their mRNA targets. For a better visualization, only interactions between miRNAs and mRNAs targeted by two or more miRNAs (35 mRNAs and seven miRNAs) were included. Green and red circles, respectively, represent miRNAs positively and negatively associated with IS. Blue circles represented mRNAs targeted by those miRNAs. ECM, extracellular matrix; FDR, false discovery rate; IS, insulin sensitivity; KEGG, Kyoto Encyclopedia of Genes and Genomes; mRNA, messenger RNA; miRNA, microRNA.
In an attempt to investigate the four independent miRNAs driving emergence of the fatty acid pathways, we investigated associations between lipid levels and the four plasma miRNAs in our Gen3G participating pregnant women: we found that hsa-miR-338-3p was significantly associated with triglyceride levels measured between 24th and 29th week of pregnancy after correction for multiple testing (figure 2F).
Discussion
In this study, we have comprehensively characterized the plasma microtranscriptomic profile in a large cohort of 421 women in samples collected between the 4th and 16th week of pregnancy. We identified 39 miRNAs significantly associated with maternal IS assessed by the Matsuda Index computed at the end of the second trimester (between the 24th and the 29th week). We built a predictive model using 18 miRNAs explaining more than a third of IS variance when including gestational age, maternal age and maternal BMI.
Circulating miRNAs can be imported within cells, where they can repress gene translation.13 Accordingly, plasma miRNAs secreted by the placenta or other maternal organs into the bloodstream could be novel endocrine factors having a role in the adaptation of maternal metabolism to pregnancy. Interestingly, most identified miRNAs were positively associated with IS suggesting they promote IS gene expression or repress insulin resistance pathways. Our results also suggest that modulation of maternal IS changes and drastic decrease in IS developing in the second half of pregnancy might in fact have been initiated, at least partially, by circulating miRNAs earlier in pregnancy.
An exciting hypothesis suggests that miRNAs secreted by the placenta into the maternal bloodstream would more specifically contribute to feto-maternal communication and metabolism adaptation to pregnancy.13 In this study, among the 39 IS-associated miRNAs, 15 (38.5%) are encoded in the C19MC. C19MC is exclusive to primates, maternally imprinted (paternally expressed) and encodes 46 miRNA genes producing 58 mature miRNAs.11 In a previous study from our group,19 we have identified miRNAs upregulated and downregulated in pregnancy and varying in concentration between 4th and 16th week of pregnancy. Out of the 15 miRNAs we have identified from C19MC and being associated with IS, 7 miRNAs were upregulated in pregnancy and 11 miRNAs (5 were common) were showing increasing levels as the pregnancy progresses from 4th to 16th week. This adds to the supportive evidence that the miRNAs we have identified might have a role in pregnancy and likely in its metabolic adaptations.19
Interestingly, our lasso predictive model also allowed to identify potential interactions between circulating miRNAs. Indeed, we found a significant statistical interaction for all five miRNAs for which a change in the direction of the association with IS was observed between the DESeq2 and the lasso regression models, suggesting that these apparently discordant results were resulting from interaction between miRNAs. For example, we found a significant statistical interaction between hsa-miR-141-3p and hsa-miR-143-3p, which is supported by biological evidence as they both target insulin-like growth factor 1 receptor (IGF1R) gene based on our interactome analysis. IGF1R may improve IS by acting as a parallel pathway for insulin and restoring IS,26 and our results suggest that both miR-141-3p and miR-143-3p may work synergistically to regulate the translation of their common target. Although post-transcriptional regulation of gene translation by miRNAs seems straightforward at first, miRNA subcellular localization, abundance of the miRNAs and their mRNA targets and the affinity of the miRNA for its miRNA response element are all contributing to their effectiveness. The apparent synergy between the few pairs of miRNAs we have possibly identified will have to be experimentally proven.27
We also found supportive evidence that 5 out of 18 miRNAs predicting IS have been previously associated with IS in animal models and in human.28–33 Our results are consistent with those reported for miR-141-3p, miR-143-3p and miR-375, all of which were positively associated with IS using cellular and animal models including knock-out mice for miR-375.28–30 Our result for miR-873-5p is also in line with a previous study in our cohort in which placental DNA methylation at the MIR873 locus was found to be negatively associated with IS.31 Although DNA methylation is generally associated with repression of gene expression, it could be the opposite scenario as it was already demonstrated.34 However, and contrary to our findings, miR-483-5p was positively correlated with fasting insulin in fasting serum of healthy participants32 while miR-873 inhibition was associated with lower IS in GDM rats.33 Altogether, our results support that circulating miRNAs in early pregnancy may contribute to progressive decrease in pregnancy occurring in pregnancy. Although we still must confirm and understand the roles of the identified miRNAs in IS regulation in pregnancy, previous results28–33 support that some of them have a true biological role in glycemic regulation during pregnancy.
Actually, four of the identified miRNAs predicting IS were enriched in biological pathways related to lipid metabolism (fatty acid biosynthesis and metabolism). Insulin is known to inhibit lipolysis with the consequence that lower IS stimulates lipolysis resulting in an increase in circulating free fatty acids.35 Indeed, we did find in secondary analyses that hsa-miR-3383p is negatively correlated with triglyceride levels. miRNAs targeting fatty acid biosynthesis and metabolism may thus also contribute to regulate plasmatic concentration of free fatty acids.
Strengths and limitations
Among the strengths, our study has been conducted in a large, well-phenotyped and prospective pregnancy birth cohort, allowing the possibility to consider risk factors affecting IS in our prediction model. Also, our analyses were performed on plasma samples collected weeks before the flagrant decrease in IS, allowing to study how miRNAs might be implicated in early pregnancy physiology and progression. The use of next-generation sequencing, a sensitive and robust analytical method,36 is another strength of our study and allowed to discover new miRNAs that have not been associated with IS so far. A limitation of this study is the estimation of IS using the Matsuda Index, which is an indirect IS measure but was validated and highly correlated with the gold standard euglycemic-hyperinsulinemic clamp values,17 37 including in pregnancy.38 Another limitation is that our miRNAs were quantified from plasma samples collected in non-fasting state and 1-hour post-50-g GCT, although this could also be viewed as a strength as it could reveal the regulatory role of some miRNAs in response to the glucose challenge. The acute impacts of glucose on the plasmatic miRNA profile are currently unknown as well as whether miRNAs contribute or not to acute glucose regulation. Also, our study remains associative and further functional studies will be needed to validate the role of the identified miRNAs in IS regulation during pregnancy.
Conclusion
We identify novel plasma miRNAs detectable between 4th and 16th week of pregnancy that are associated with and predictive of IS assessed between 24th and 29th week of pregnancy. These miRNAs are enriched in metabolic pathways that could be involved in the pathogenesis of GDM. If so, these circulating miRNAs may participate to maternal IS adaptation during pregnancy which opens new and innovative avenues to understand the complexity of glucose metabolism regulation in pregnancy and to develop novel prevention and therapeutic strategies to prevent GDM development and its consequences for both the mothers and their offspring.
Data availability statement
Data are available on reasonable request. The datasets generated during and/or analyzed during the current study are available from the corresponding author on reasonable request.
Data availability statement
The datasets generated during and/or analyzed during the current study are available from the corresponding author on reasonable request.
Ethics statements
Patient consent for publication
Ethics approval
This study involves human participants and was approved by CIUSSS de l’Estrie-CHUS Projet No MP-31-2019-3059 - DxDG. Participants gave informed consent to participate in the study before taking part.
Acknowledgments
We are grateful to the McGill University and Génome Québec Innovation Centre staff for their work in miRNA libraries’ quality control and sequencing. We also thank Calcul Québec and Compute Canada for their support in this research. We also want to thank all the participants of the Gen3G cohort.
References
Supplementary materials
Supplementary Data
This web only file has been produced by the BMJ Publishing Group from an electronic file supplied by the author(s) and has not been edited for content.
Footnotes
Contributors CL performed data collection and statistical analysis, contributed to bioinformatics analysis and wrote the manuscript. VD contributed to data collection and to manuscript writing and revision. CP and KT contributed to data collection and revision of the manuscript. FW and A-AC contributed to bioinformatics analysis and to manuscript revision. MSS and P-EJ contributed to data analysis and revised the manuscript. PP, M-FH, RG, LB conceived the study design, supervised all steps of the study and participated in manuscript writing and revision. LB is the guarantor of this work and, as such, had full access to all the data in the study and takes responsibility for the integrity of the data and the accuracy of the data analysis.
Funding CL, KT and A-AC were recipients of a doctoral research award from Fonds de la recherche du Québec en santé (FRQS). VD was supported by Diabète Québec. MSS, P-EJ and LB are research scholars from the FRQS and a member of the CR-CHUS, a FRQS-funded research center. This study was supported by the Canadian Institutes of Health Research (Grant No IGH-155183).
Competing interests None declared.
Provenance and peer review Not commissioned; externally peer reviewed.
Supplemental material This content has been supplied by the author(s). It has not been vetted by BMJ Publishing Group Limited (BMJ) and may not have been peer-reviewed. Any opinions or recommendations discussed are solely those of the author(s) and are not endorsed by BMJ. BMJ disclaims all liability and responsibility arising from any reliance placed on the content. Where the content includes any translated material, BMJ does not warrant the accuracy and reliability of the translations (including but not limited to local regulations, clinical guidelines, terminology, drug names and drug dosages), and is not responsible for any error and/or omissions arising from translation and adaptation or otherwise.