Article Text

Abstract
Introduction This study aimed to identify serum metabolomic signatures associated with gestational diabetes mellitus (GDM), and to examine if ethnic-specific differences exist between South Asian and white European women.
Research design and methods Prospective cohort study with a nested case–control analysis of 600 pregnant women from two Canadian birth cohorts; using an untargeted approach, 63 fasting serum metabolites were measured and analyzed using multisegment injection-capillary electrophoresis-mass spectrometry. Multivariate logistic regression modeling was conducted overall and by cohort.
Results The proportion of women with GDM was higher in South Asians (27.1%) compared with white Europeans (17.9%). Several amino acid, carbohydrate, and lipid pathways related to GDM were common to South Asian and white European women. Elevated circulating concentrations of glutamic acid, propionylcarnitine, tryptophan, arginine, 2-hydroxybutyric acid, 3-hydroxybutyric acid, and 3-methyl-2-oxovaleric acid were associated with higher odds of GDM, while higher glutamine, ornithine, oxoproline, cystine, glycine with lower odds of GDM. Per SD increase in glucose concentration, the odds of GDM increased (OR=2.07, 95% CI 1.58 to 2.71), similarly for metabolite ratios: glucose to glutamine (OR=2.15, 95% CI 1.65 to 2.80), glucose to creatinine (OR=1.79, 95% CI 1.39 to 2.32), and glutamic acid to glutamine (OR=1.46, 95% CI 1.16 to 1.83). South Asians had higher circulating ratios of glucose to glutamine, glucose to creatinine, arginine to ornithine, and citrulline to ornithine, compared with white Europeans.
Conclusions We identified a panel of serum metabolites implicated in GDM pathophysiology, consistent in South Asian and white European women. The metabolic alterations leading to larger ratios of glucose to glutamine, glucose to creatinine, arginine to ornithine, and citrulline to ornithine in South Asians likely reflect the greater burden of GDM among South Asians compared with white Europeans.
- pregnancy
- metabolism
- diabetes, gestational
- cohort studies
Data availability statement
Data are available upon reasonable request.
This is an open access article distributed in accordance with the Creative Commons Attribution Non Commercial (CC BY-NC 4.0) license, which permits others to distribute, remix, adapt, build upon this work non-commercially, and license their derivative works on different terms, provided the original work is properly cited, appropriate credit is given, any changes made indicated, and the use is non-commercial. See: http://creativecommons.org/licenses/by-nc/4.0/.
Statistics from Altmetric.com
Significance of this study
What is already known about this subject?
Emerging epidemiological studies in pregnant women have identified metabolites associated with gestational diabetes mellitus (GDM); however, few have examined the metabolome of South Asian women with GDM.
What are the new findings?
We identified a panel of serum metabolites involved in amino acid, carbohydrate, nitrogen, and lipid pathways that were altered in those with GDM, generally consistent in two ethnically distinct cohorts of South Asian and white European women.
The larger ratios of glucose to glutamine, glucose to creatinine, arginine to ornithine, and citrulline to ornithine in South Asian women may reflect early metabolic remodeling that contributes to the greater burden of GDM among South Asians compared with white Europeans.
How might these results change the focus of research or clinical practice?
Identification of metabolites implicated in GDM pathophysiology may help with targeted prevention strategies and to identify populations at high risk of incident metabolic complications (eg, type 2 diabetes).
Introduction
Gestational diabetes mellitus (GDM) is defined as hyperglycemia first recognized during pregnancy that is not attributable to previous diabetes.1 2 GDM can lead to several metabolic changes and clinical complications for pregnant women and their offspring, including stillbirth, preterm birth, neonatal macrosomia, and higher adiposity in offspring.1–3 Evidence is mounting of lasting intergenerational metabolic sequelae of GDM, where women and offspring have higher rates of incident type 2 diabetes, obesity, hypertension, dyslipidemia, and cardiovascular disease later in life.1 2 4 5 Globally, GDM rates are highest among South Asian (ie, people who originate from the Indian subcontinent), Latin American, Middle Eastern, and Indigenous populations.6 7 Specifically, the proportion of women with GDM is almost twofold higher among South Asians living in Canada compared with white Europeans.3 The reason for the increased risk of GDM among South Asian women is not well understood, but is hypothesized to be related to higher genetic risk, greater adiposity, and differences in dietary intake in pregnancy.3 6 8–10
The field of metabolomics is contributing to rapid improvements in our understanding of diseases of complex etiology at critical stages of development, such as GDM. This is because the human metabolome reflects the interplay of many of the complex factors that contribute to the disease phenotype, including gene expression, environmental exposures, and physiological responses.11 12 To date, 61 metabolomic studies have investigated the pathophysiology of GDM, but most were small studies conducted primarily in either white European (42% of studies) or East Asian (30% of studies) populations (online supplemental tables S1 and S2). Despite being a high-risk population, only seven studies to date8 13–18 have examined the metabolome of South Asian women with GDM, of which most included fewer than 20 GDM cases (online supplemental table S1). Non-targeted metabolomic profiling in a large population-based sample may reveal new insights into why South Asian women are disproportionately impacted by GDM as compared with other populations.8 Thus, we sought to identify serum metabolites associated with GDM, to characterize metabolic pathways related to GDM, and to determine if these metabolites differ between South Asian and white European pregnant women.
Supplemental material
Research design and methods
Study participants
We compared GDM cases to non-cases from two prospective birth cohorts of pregnant women in Canada: the South Asian Birth Cohort (START) study and the Family Atherosclerosis Monitoring in Early Life (FAMILY) study.9 19 Each cohort enrolled pregnant women from Ontario, Canada, in their second or third trimester and followed the women and infants prospectively. Recruitment for the START study began in July 2011, and enrolled 1012 women with 1002 newborns.9 Recruitment for the FAMILY study occurred between 2004 and 2009, and enrolled 857 women and 901 newborns.19 A sample of 600 women (300 from START and 300 from FAMILY), selected for a nutrition substudy to be balanced across low, intermediate, and high diet quality scores within each cohort, and who had prior non-targeted metabolomics data, were eligible for this analysis.12
GDM classification
All women underwent a 75 g oral glucose tolerance test (OGTT) between 24 and 28 weeks of gestation to diagnose GDM. In START and FAMILY, GDM (ie, ‘case’ status) was diagnosed if any one of the following criteria was met: (1) The OGTT returned a result consistent with GDM based on the International Association of the Diabetes and Pregnancy Study Groups (IADPSG) definition: fasting glucose ≥5.1 mmol/L, 1-hour glucose ≥10.0 mmol/L, and/or 2-hour glucose ≥8.5 mmol/L, (2) a woman self-reported GDM at baseline or post partum, (3) a review of a woman’s birth chart indicated positive GDM status, or (4) a woman reported taking insulin during pregnancy, without prior diabetes diagnosis. In START, we additionally assessed GDM using the South Asian-specific Born in Bradford (BiB) criteria: fasting glucose level ≥5.2 mmol/L, or a 2-hour postload level of ≥7.2 mmol/L. The BiB GDM criteria were developed and validated in 4821 South Asian women living in the UK and showed that lower glucose thresholds predicted adverse perinatal outcomes, including infant adiposity and high infant birth weight.20
Serum metabolomics analysis by multisegment injection-capillary electrophoresis-mass spectrometry
Overnight fasted serum samples were collected from women and stored in liquid nitrogen at the Hamilton Clinical Research Laboratory. The workflow for the metabolomics analysis in START and FAMILY was the same and is described in detail elsewhere.21 In brief, multisegment injection-capillary electrophoresis-mass spectrometry (MSI-CE-MS) was used for the identification and quantification of polar ionic metabolites measured consistently in serum filtrate samples with rigorous quality control (QC).21 Most serum metabolites were unambiguously identified by spiking authentic standards, and subsequently quantified (μM) using a calibration curve, where ion responses were normalized to a single internal standard (ie, relative peak area (RPA)).21 Unknown serum metabolites were annotated based on their most likely molecular formula, relative migration time, and mode of detection with most compounds identified following acquisition of high-resolution tandem mass spectrometry (MS/MS) spectra at different collision energies (10, 20, 40 V).21 In START and FAMILY, 63 and 62 serum metabolites, respectively, met the selection criteria using MSI-CE-MS, namely they were frequently measured (>75% of serum samples) with adequate technical precision (coefficient for variation for QC <30%). Maternal serum metabolome coverage was similar in both cohorts, except for an unknown cation (m/z: 334.689, identified as a doubly charged peptide) only detected in START (online supplemental table S3). Ratios of serum metabolites previously identified to be related to glucose homeostasis, type 2 diabetes, or GDM were also investigated, including the ratios of glutamic acid to glutamine, isoleucine to glutamine, leucine to glutamine, valine to glutamine, glucose to creatinine, glucose to glutamine, arginine to ornithine, citrulline to ornithine, tyrosine to methionine, alanine to glycine, and Fischer’s ratio.22–27 Fischer’s ratio is a ratio of branched-chain amino acids (BCAAs) leucine, valine, isoleucine to aromatic amino acids (AAs) phenylalanine and tyrosine.27 Ratios for other serum metabolites with better discriminative ability for GDM as compared with glucose were also reported in our work.
Statistical analysis
Metabolites were autoscaled and natural logarithm transformed to correct for skewness. Student’s two-tailed t-tests were performed to compare means and Mann-Whitney U tests for medians using QC-based batch-corrected metabolite concentrations (or RPA for metabolites with no authentic standards commercially available) between pregnant women with and without GDM, and between South Asian and white European women. Each natural log-transformed metabolite was tested independently for its association with GDM, and those with univariate p<0.10 were candidates for subsequent multivariable logistic regression. There was no adjustment for multiple testing during this exploratory phase of analysis. Unknown serum metabolites significant at p<0.10 were eligible for additional MS/MS experiments. In multivariable logistic regression, the association between metabolite and GDM was expressed per 1 SD increase of log-transformed metabolite RPA, adjusted for ethnicity, maternal age, maternal height, pre-pregnancy body mass index (BMI), gestational age at recruitment, family history of diabetes, smoking history, and a diet quality score.12 These covariates were selected as they were found to be associated with GDM and various metabolites in previous analyses.2 8 9 12 15 16 28 29 Standardized protocols were used to measure anthropometrics (eg, weight, height). Participants self-reported ethnicity, with options of Hispanic, European, South Asian, Arab, East/Southeast Asia, African, First Nation, Mixed, and Other. Only participants of European and South Asian ethnicities were included for this study. Maternal age was calculated by subtracting the date of birth from the date of baseline visit. Pre-pregnancy BMI was calculated at baseline, using measured height and self-reported or measured weight. Gestational age at recruitment was defined as the number of weeks the woman has been pregnant, as reported from her expected delivery date. Participants had a family history of diabetes if at least one of their immediate family members (parents and full-blooded siblings) was diagnosed with diabetes. Smoking history was self-reported, with options of never smoking, quitting before pregnancy, quitting during pregnancy, or currently smoking. The diet quality score was calculated as the sum of daily servings of ‘healthy’ foods (eg, fermented dairy, vegetables, fruits) less the sum of daily servings of ‘unhealthy foods’ (eg, processed meats, refined grains), as previously described.12 To assess the robustness of regression models, we conducted a k-fold cross-validation (k=10). The associations between serum metabolites and GDM status were calculated overall, as well as stratified by cohort to examine any differences between South Asian and white European women. Multiplicative interactions between serum metabolites and ethnicity were tested. Analyses were conducted in SAS V.9.4 and R V.4.0.2.
Pathway analysis
Pathway analysis was performed using freely available online software, MetaboAnalyst V.5.0.30 Metabolites were generalized logarithm transformed, autoscaled, and then mapped into metabolic pathways using the Kyoto Encyclopedia of Genes and Genomes database. Pathway enrichment analysis compares the number of significant metabolites with an expected value within a specific pathway to determine the significant pathways (p<0.05) with false discovery rate correction. A pathway importance value was calculated for each metabolite based on its position relative to other molecules within the same pathway.30 Topology analysis calculates the pathway impact as the sum of the importance measures of the matched metabolites normalized by the sum of the importance measures of all the metabolites of each pathway. Pathways were retained if p<0.05 and impact was >0.10, thresholds consistent with prior MetaboAnalyst pathway analyses.31–33
Sensitivity analyses
The primary analysis was a complete-case analysis that assessed the associations of metabolites with GDM status, adjusted for ethnicity, maternal age, maternal height, pre-pregnancy BMI, gestational age at recruitment, family history of diabetes, smoking history, and diet quality. Sensitivity analyses compared this model with: (1) results of unadjusted models; (2) models using a different method of GDM diagnosis in START (IADPSG vs BiB); (3) using multiple imputation (m=10) because 7.7% of women (n=46) had missing data on at least one covariate; and (4) models additionally adjusting for total plant protein intake (% of total energy). To assess the consistency of our results, we also conducted partial least-squares discriminant analysis (PLS-DA), a supervised multivariate data analysis method for ranking serum metabolites of significance based on their variable importance in projection (VIP >1.5) score.
Results
Participant characteristics
Women with GDM were older, shorter, had higher pre-pregnancy BMI, and more likely to have a family history of diabetes than women without GDM (table 1). Despite lower pre-pregnancy BMI, South Asian women were more likely to have GDM (27.1%) than white European women (17.9%) (p=0.008; table 1). South Asian women were almost twice as likely to report a family history of diabetes (58.0%), compared with white European women (32.7%) with GDM (p<0.001). While both cohorts had similar total protein intakes, South Asian women with GDM consumed more plant protein (7.2% vs 4.8% of total energy, p<0.001) and less animal protein (8.7% vs 11.4% of total energy, p<0.001), respectively, compared with white European women with GDM.
Participant characteristics for nested case–control metabolite analysis, IADPSG criteria for GDM diagnosis
Association between serum metabolites and GDM
Twenty-eight candidate serum metabolites were associated with GDM at the initial statistical threshold of p<0.10 (online supplemental tables S4 and S5; figure S1). Nine serum metabolites were associated with GDM in multivariable logistic regression models (figure 1). Higher levels of glucose, glutamic acid, propionylcarnitine, pyruvic acid, 2-hydroxybutyric acid, 3-hydroxybutyric acid, and 3-methyl-2-oxovaleric acid were associated with higher odds of GDM (figure 1). Greater ratios of glucose to glutamine, glucose to creatinine, glutamic acid to glutamine, and arginine to ornithine also corresponded with higher odds of GDM (figure 1). In contrast, higher levels of unknown m/z 129.066 (C5H8N2O2) were associated with lower odds of GDM (figure 1). With additional MS/MS experiments, this cation was tentatively classified as an AA analog, which was correlated with serum creatinine (r=0.44) and glutamine (r=0.32)31 (online supplemental figure S2). Our 10-fold cross-validation of multivariable logistic regression models demonstrated good predictive performance (area under the curve ranging from 0.69 to 0.76, sensitivity 0.94–0.97, online supplemental table S6), but the PLS-DA model was not robust (average Q2=0.05, R2=0.18).

Associations between serum metabolites and odds of gestational diabetes mellitus (GDM) (IADPSG diagnosed), per 1 SD increase in metabolite concentration, START and FAMILY (n=590 women). *Reported as most likely molecular formula (m/z). Adjusted for ethnicity, maternal age, maternal height, pre-pregnancy BMI, gestational age at recruitment, family history of diabetes, smoking history, and diet quality score. †Identified as a cation amino acid analog.21 ‡Identified as doubly charge peptide, containing alanine, glutamic acid, and histidine. BMI, body mass index; FAMILY, Family Atherosclerosis Monitoring in Early Life; IADPSG, International Association of the Diabetes and Pregnancy Study Groups; RPA, relative peak area; START, South Asian Birth Cohort.
Pathway analysis
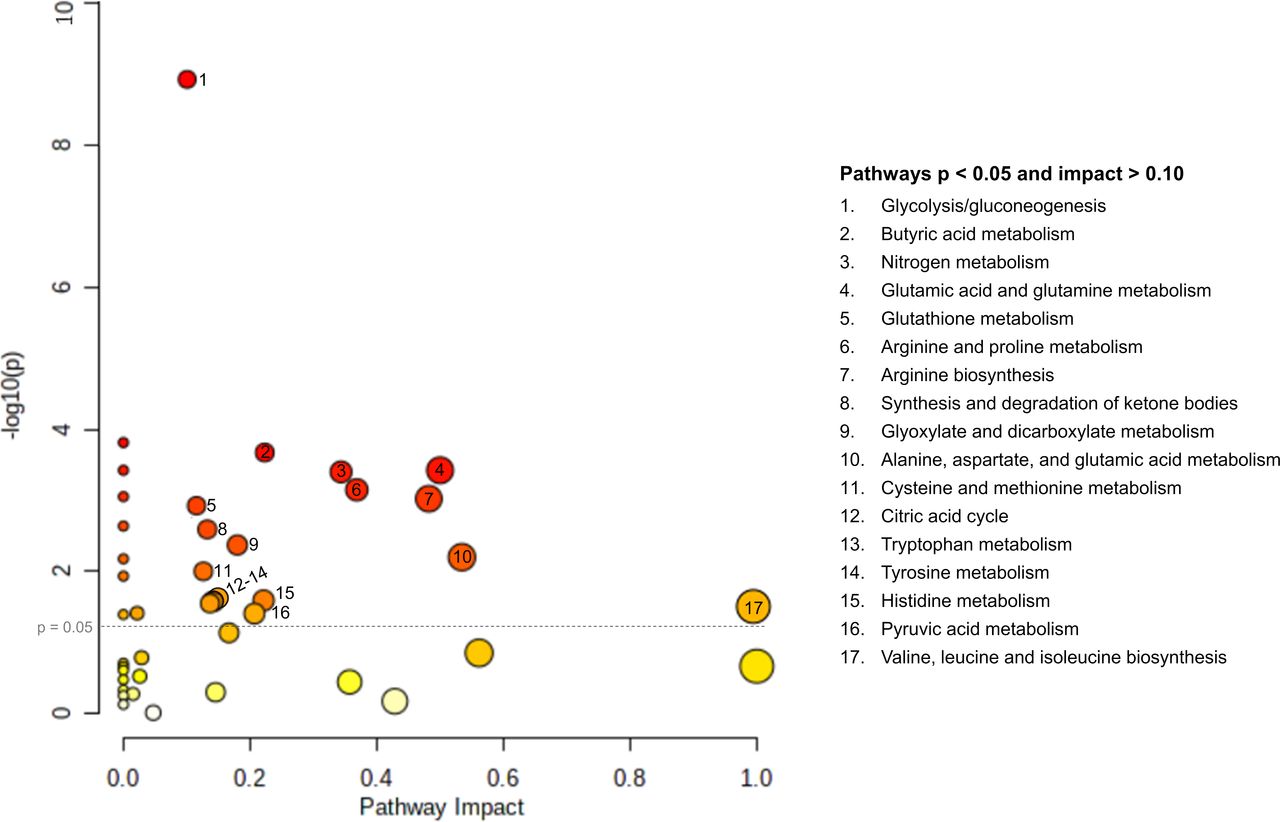
Seventeen pathways were associated with GDM, including several AA metabolism pathways, as well as carbohydrate metabolism, nitrogen metabolism, and lipid metabolism pathways (table 2; figure 2; online supplemental figure S3).
Metabolic pathways significantly impacted by GDM, with p<0.05 and impact >0.10, sorted by impact, KEGG database*

Pathway impact by significance, metabolites significantly associated with gestational diabetes mellitus (GDM), South Asian Birth Cohort (START) and Family Atherosclerosis Monitoring in Early Life (FAMILY) (n=590 women). The size of pathway symbols represent the significance level, and the color is based on impact factor. (Adapted from MetaboAnalyst30 results (https://www.metaboanalyst.ca/)).
Ethnic-specific differences
Comparing the two groups, the ratios of glucose to glutamine, glucose to creatinine, citrulline to ornithine, and arginine to ornithine were 0.4–1.0 SD higher in South Asians compared with white European women (online supplemental figure S4). Among women with GDM, there were significant differences in the adjusted metabolite concentrations between South Asians (n=81) and white Europeans (n=52) (online supplemental figures S5 and S6). Concentrations of several AAs, carboxylic acids, and hydroxy acids were higher among white European women with GDM, except for 2-aminooctanoic acid, tryptophan betaine, arginine, glucose to creatinine, and arginine to ornithine ratios (online supplemental figure S6). Despite ethnic differences in the distribution of many serum metabolites, ORs associating metabolites with GDM were of similar magnitude and direction in both groups (table 2; online supplemental tables S7 and S8).
Sensitivity analysis
Multiple imputation, compared with complete case, or further adjusting for plant protein intake, did not meaningfully change the results (online supplemental table S9). For most serum metabolites, adjusted models, compared with unadjusted, slightly attenuated the relationship between metabolites and GDM (online supplemental table S9). Multivariate-adjusted models using BiB-defined GDM in START and IADPSG in FAMILY resulted in the same nine serum metabolites associated with IADPSG-defined GDM, plus an additional five metabolites: tryptophan, ornithine, alanine to glycine ratio, and citrulline to ornithine ratio (online supplemental table S9). Results from a PLS-DA model with VIP score ranking were also consistent with the main analysis results (online supplemental figure S7).
Discussion
This metabolomics analysis in two ethnically distinct cohorts of women in pregnancy highlighted several pathways that were altered with GDM and common to both South Asian and white European women. These GDM-altered pathways included AA metabolism (eg, BCAA biosynthesis, tryptophan metabolism), carbohydrate metabolism, and fatty acid metabolism (eg, ketone body production, butyric acid metabolism). Further, several pathways involving glutamic acid and glutamine were consistently associated with GDM, such as glutathione metabolism and nitrogen metabolism. Within these pathways, higher concentrations of glutamic acid, propionylcarnitine, tryptophan, arginine, 2-hydroxybutyric acid, 3-hydroxybutyric acid, pyruvic acid, and 3-methyl-2-oxovaleric acid were associated with higher odds of GDM. Higher circulating glutamine, ornithine, oxoproline, cystine, glycine, and unknown m/z 129.066 (C5H8N2O2, identified as a cation AA derivative) were inversely related to GDM. This is the first study to consider serum metabolite ratios as predictors of GDM, discovering increased odds for GDM with increasing ratios of glucose to glutamine, glucose to creatinine, glutamic acid to glutamine, and arginine to ornithine. Increasing evidence suggests that GDM reflects an early stage of type 2 diabetes disease progression that manifests due to the metabolic stress caused by pregnancy.2 4 5 Overall, our study results support this hypothesis, as we identified GDM-altered pathways consistent with previous investigations in participants with GDM or type 2 diabetes2 15 16 34 35 (online supplemental table S1).
We observed a positive association between the glutamic acid to glutamine ratio and GDM. This ratio is an established type 2 diabetes risk marker, but ours is the first study to show that this ratio was also associated with GDM.22 34 Glutamic acid and glutamine also play important roles in seven of the 17 pathways we identified to be associated with GDM, including AA metabolism (alanine, aspartic acid, histidine, arginine, proline), nitrogen metabolism, and glyoxylic and dicarboxylic acid metabolism. Glutamine and glutamic acid provide carbon for glucose production in the kidney and liver, where glutamic acid promotes insulin secretion from pancreatic β-cells.22 Abnormal glutamic acid homeostasis is associated with increased pancreatic β-cell damage, insulin secretion, and gluconeogenesis, which can be mitigated, in part, by increased glutamine.22 36 In type 2 diabetes studies, even after adjusting for insulin resistance and BCAA levels, the glutamic acid to glutamine ratio remained a strong predictor of incident type 2 diabetes.22 In a systematic review of 19 clinical trials and animal studies, glutamine improved fasting plasma glucose, postprandial blood glucose, and increased insulin production in patients and animals with type 2 diabetes.36 Therefore, glutamine may be an important therapeutic target for GDM, as well as a marker of future metabolic risk; however, additional studies are warranted to investigate this hypothesis.36
While several studies identify elevated BCAAs as important risk markers for insulin resistance, pre-diabetes, and type 2 diabetes, the relationship between circulating BCAAs and GDM is inconsistent34 35 (online supplemental table S1). Seven previous studies have identified positive relationships between BCAAs and GDM, while 12 studies found no difference (online supplemental table S1). We did not identify significant associations between either BCAAs or Fischer’s ratio and GDM. We did, however, find that the BCAA biosynthesis pathway was related to GDM, along with significant positive associations of 3-methyl-2-oxovaleric acid and propionylcarnitine with GDM, two downstream leucine metabolism by-products, both previously linked to impaired fasting glucose and type 2 diabetes mellitus.34 35 We also identified that tryptophan metabolism was associated with GDM, consistent with prior investigations.15 16 35 Elevated tryptophan can result in higher production of the diabetogenic xanthurenic acid via the tryptophan-kynurenine pathway, which may explain why it was elevated in women with GDM.2
We observed that higher levels of 2-hydroxybutyric acid and 3-hydroxybutyric acid were associated with increased odds of GDM, consistent with previous studies (online supplemental table S1). It is postulated that the increased fatty acid catabolism, oxidative stress, and enhanced glutathione synthesis observed in GDM are related to higher circulating concentrations of 2-hydroxybutyric acid.37 This shift to fatty acid oxidation is further supported by increased 3-hydroxybutyric acid, which is a major ketone body in circulation in a fasted state.37 Elevated levels of 2-hydroxybutyric acid and 3-hydroxybutyric acid have been implicated as predictive biomarkers several years prior to the onset of type 2 diabetes, highlighting the potential clinical utility of these compounds for early detection of glucose intolerance in women during pregnancy prior to onset of GDM.37
Ethnic-specific differences
Consistent with the BiB study of 4072 white European and 4702 South Asian women living in the UK, among all pregnant women, our study demonstrated that South Asian women had higher levels of glucose, while white Europeans had higher levels of histidine, creatinine, and pyruvic acid.8 Contrary to the BiB study, we did not observe higher levels of glutamine, alanine, BCAAs, or aromatic AAs in South Asian women.8 We did, however, observe higher levels of serine, arginine, tryptophan betaine, 3-methyl-2-oxovaleric acid, and acetylcarnitine. Variability between studies may reflect our lower sample size, or dietary pattern and socioeconomic status differences. In our study, the higher ratios of glucose to glutamine, glucose to creatinine, arginine to ornithine, and citrulline to ornithine in South Asians compared with white Europeans are important ethnic-specific findings. These four ratios are strongly related to GDM and incident type 2 diabetes and could reflect early metabolic perturbations that contribute to the larger burden of GDM, incident type 2 diabetes, and other endocrine disorders in South Asians compared with white Europeans.22–27 34 35 Elevated circulating arginine and larger ratios of arginine to ornithine, and citrulline to ornithine related to increased risk for GDM in South Asian women are signs of abnormal urea cycle metabolism.23 Increased arginine relative to ornithine levels can also indicate an impairment of nitric oxide synthesis and vasodilation properties, which has previously been documented in people with type 2 diabetes.23 Our study suggests that AAs in urea cycle may be candidate markers for predicting GDM, particularly among South Asian women.
Metabolite differences by ethnicity were robust after adjustments for age, height, pre-pregnancy BMI, gestational age at recruitment, family history of diabetes, smoking, and diet quality. However, differences in specific food groups may not have been fully captured in the diet quality score.12 For example, the higher amount of tryptophan betaine in South Asian women may be explained by higher legume intake, while higher 3-methylhistidine in white Europeans by their larger protein and meat intake.12 38 However, ethnic-specific metabolite concentrations were robust to further adjustments for total intake of plant protein (online supplemental figure S6). There is a growing body of literature that physical activity and sedentary behavior are associated with various metabolite concentrations, including BCAAs, alanine, proline, and lactic acid.39 Nevertheless, further adjustment for self-reported physical activity (data not shown) did not significantly change ethnic-specific metabolite concentrations in our study. Other lifestyle and genetic variations not explored herein may also contribute to observed differences.
Strengths and limitations
This study investigated the metabolic phenotype differences associated with GDM risk among South Asian women, an understudied population, as compared with white European women; an important strength compared with previous metabolomic studies (online supplemental tables S1 and S2). Both cohorts provided fasting measurements, used a validated and identical technical platform for metabolomic analyses with stringent QC and batch correction adjustment.21 We conducted internal cross-validation, and sensitivity analyses to demonstrate robustness and similar outcomes using complementary univariate and multivariate statistical models. We adjusted our analyses for known important confounders; however, we cannot exclude the possibility of residual confounding from those that were unmeasured. Our study was limited as only polar ionic metabolites in serum filtrates were analyzed, but not fatty acids or lipids.40 Also, blood samples were collected at the same time as the OGTT was measured, and thus some degree of reverse causation is possible. Our analysis included 62 serum metabolites measured in two birth cohorts; however, larger scale investigations may be needed to validate metabolic differences implicated in GDM risk in different ethnic populations.
Conclusion
In summary, we identified a panel of serum metabolites involved in AA, carbohydrate, nitrogen, and lipid pathways that were altered with GDM. Although there was a large overlap in metabolites associated with GDM in South Asian and white European women, the larger ratios of glucose to glutamine, glucose to creatinine, arginine to ornithine, and citrulline to ornithine in South Asians may reflect early metabolic remodeling that contributes to the greater burden of GDM among South Asians compared with white Europeans. Further work is necessary to understand if interventions to alter these metabolite ratios can help alleviate the burden of GDM. GDM research, prevention, diagnosis, and management predominately focus on glycemic control, but this may be an oversimplified framework in the era of precision medicine.
Data availability statement
Data are available upon reasonable request.
Ethics statements
Patient consent for publication
Ethics approval
This study involves human participants and was approved by the McMaster Hamilton Integrated Research Ethics Board for the South Asian Birth Cohort (START) study (HiREB 10-640) and the Family Atherosclerosis Monitoring in Early Life (FAMILY) study (HiREB 02-060). Participants gave informed consent to participate in the study before taking part.
Acknowledgments
The authors thank the study participants who kindly donated their time, information, and serum samples.
References
Supplementary materials
Supplementary Data
This web only file has been produced by the BMJ Publishing Group from an electronic file supplied by the author(s) and has not been edited for content.
Footnotes
Contributors SSA, MG, RJdS (START study); SAA, KM, KT (FAMILY study) conceived and supervised the studies, including participant recruitment, data collection, and coordination of biospecimen collection. MS, SA and PB-M were involved in non-targeted metabolite profiling of plasma samples. CS conducted the statistical analysis and wrote the first draft of the manuscript, with data interpretation by CS, PB-M, MS, and SA. All authors edited the manuscript, reviewed the article, verified the underlying data, and approved the final version before submission. SSA is the guarantor of the work.
Funding The South Asian Birth Cohort (START) study data were collected as part of a program funded by the Indian Council of Medical Research and in Canada by the Canadian Institutes of Health Research (grant INC-109205), and the Heart and Stroke Foundation (grant NA7283) with founding principal investigators: SSA, Anil Vasudevan, MG, KM, Anura Kurpad, KT, and Krishnamachari Srinivasan. The Family Atherosclerosis Monitoring in Early Life (FAMILY) study is funded by the Canadian Institutes of Health Research, the Population Health Research Institute, and the McMaster Children’s Hospital Foundation, with founding principal investigators: KM, SAA, Salim Yusuf, Jacqueline Bourgeois, Sarah McDonald, Matthew J McQueen, Richard Persadie, Barry Hunter, Janice Pogue, and KT. PB-M acknowledges the support from the Natural Sciences and Engineering Research Council of Canada and Genome Canada. SSA holds the Tier 1 Canada Research Chair in Ethnicity and Cardiovascular Disease (Canadian Institutes of Health Research) and the Michael G DeGroote Heart and Stroke Foundation Chair in Population Health (Heart and Stroke Foundation).
Disclaimer The funders had no role in study design, data collection, analysis, decision to publish, or manuscript preparation.
Competing interests None declared.
Provenance and peer review Not commissioned; externally peer reviewed.
Supplemental material This content has been supplied by the author(s). It has not been vetted by BMJ Publishing Group Limited (BMJ) and may not have been peer-reviewed. Any opinions or recommendations discussed are solely those of the author(s) and are not endorsed by BMJ. BMJ disclaims all liability and responsibility arising from any reliance placed on the content. Where the content includes any translated material, BMJ does not warrant the accuracy and reliability of the translations (including but not limited to local regulations, clinical guidelines, terminology, drug names and drug dosages), and is not responsible for any error and/or omissions arising from translation and adaptation or otherwise.