Article Text

Abstract
Introduction Cerebral small vessel disease (cSVD) is highly prevalent and results in irreversible cognitive impairment and reduced quality of life. Previous studies reported controversial associations between insulin resistance and cSVD. Here, we estimated the association between insulin resistance and cSVD in non-diabetic communities in southeastern China.
Research design and methods The Polyvascular Evaluation for Cognitive Impairment and Vascular Events study (NCT03178448) recruited 3067 community-dwelling adults. We estimated the association of insulin resistance, assessed by the insulin sensitivity index (ISI0,120) and the homeostatic model assessment for insulin resistance (HOMA-IR) based on the standard oral glucose tolerance test, with cSVD in those without a history of diabetes mellitus. cSVD was measured for both main neuroimaging manifestations of cSVD and total SVD burden scores.
Results A total of 2752 subjects were enrolled. In the multivariable logistic regression analysis, the first quartile of ISI0,120 was found to be potentially associated with an increased risk of lacunes (OR 1.96, 95% CI 1.15 to 3.36), severe age-related white matter changes (OR 1.97, 95% CI 1.15 to 3.38), and higher total SVD burden (4-point scale: common OR (cOR) 1.34, 95% CI 1.04 to 1.72; 6-point scale: cOR 1.43, 95% CI 1.14 to 1.80). The associations between HOMA-IR and lacunes (OR 1.90, 95% CI 1.11 to 3.25) and the 4-point scale of total SVD burden (cOR 1.33, 95% CI 1.04 to 1.70) were also significant after adjustment for age, gender, medical history, and medications. However, the associations were not statistically significant after further adjustment for blood pressure/hypertension and body mass index (BMI).
Conclusions A potential association was found between insulin resistance and cSVD, and the ISI0,120 index presented a greater association with increased risk of cSVD as compared with the HOMA-IR. However, these associations were greatly influenced by blood pressure and BMI.
- insulin resistance
Data availability statement
Data are available on reasonable request. The data that support the findings of this study are available from the corresponding author on reasonable request. Supplementary data are available online.
This is an open access article distributed in accordance with the Creative Commons Attribution Non Commercial (CC BY-NC 4.0) license, which permits others to distribute, remix, adapt, build upon this work non-commercially, and license their derivative works on different terms, provided the original work is properly cited, appropriate credit is given, any changes made indicated, and the use is non-commercial. See: http://creativecommons.org/licenses/by-nc/4.0/.
Statistics from Altmetric.com
WHAT IS ALREADY KNOWN ON THIS TOPIC
The high prevalence of cerebral small vessel disease (cSVD) requires effective predictors to identify high-risk populations for early prevention.
Insulin resistance is a major vascular risk factor for macrovascular and microvascular changes.
The association between insulin resistance and cSVD remains controversial.
WHAT THIS STUDY ADDS
Our study found a potential association between insulin resistance and increased risk of cSVD, especially ischemic changes such as white matter lesion and lacune.
We also found that the insulin sensitivity index (ISI0,120) presented a greater association with increased risk of cSVD as compared with HOMA-IR, indicating that the ISI0,120 might be a more effective index.
Blood pressure and body mass index may have a significant impact on the association between insulin resistance and cSVD.
HOW THIS STUDY MIGHT AFFECT RESEARCH, PRACTICE OR POLICY
The associations of insulin resistance with cSVD suggest early detection of insulin sensitivity may help identify individuals at high risk for cSVD.
Introduction
Cerebral small vessel disease (cSVD) is prevalent in aging population with insidious onset, almost affecting all levels of the brain vasculature, and challenges the social and healthcare system worldwide.1 The main neuroimaging manifestations of cSVD include white matter hyperintensity (WMH), lacunes, cerebral microbleeds (CMBs), and enlarged perivascular spaces (PVS).2 Similar to macrovascular disease, the pathophysiological process of cSVD is multifactorial, with aging, hypertension, dyslipidemia, and abnormal glucometabolic all involved.3 Identifying high-risk population is essential and can help alleviate disease stress through early intervention.
Insulin resistance as a key component of metabolic syndrome, plays an important role in carbohydrate and lipid metabolism in peripheral system and adversely affects heart and brain. Increasing amount of evidence showed that insulin resistance was associated with increased risk of macrovascular and microvascular complications even in patients without diabetes. Previous studies reported the association between insulin resistance and cSVD using the homeostatic model assessment for insulin resistance (HOMA-IR), with mixed results.4–7 As HOMA-IR is based on fasting glucose and fasting insulin, the accuracy in reflecting insulin sensitivity might be limited. The insulin sensitivity index (ISI0,120) defined by Gutt et al, based on postglucose load measures, shows a better correlation with hyperinsulinemic-euglycemic clamp than HOMA-IR, and reflects both peripheral and hepatic insulin sensitivity.8 However, few studies have focused on the association between postglucose load measures of insulin resistance and risk of cSVD. In this study, we assessed the association of ISI0,120 with different neuroimaging manifestations of cSVD and total SVD burden, as compared with HOMA-IR.
Methods
Study design and participants
The study participants were selected from the Polyvascular Evaluation for Cognitive Impairment and Vascular Events (PRECISE) study (NCT03178448), a population-based prospective cohort study recruiting community-dwelling seniors in Lishui, southeastern China. The rational and study design have been described in detail previously.9 Subjects in the PRECISE study were recruited by subgroup sampling in six villages and four communities in Lishui, all of them were community residents aged 50–75 years. Exclusion criteria were subjects with artificial tooth, implantable automatic defibrillator, or any implanted metal device that prevented them from undergoing MRI. The primary objectives of the PRECISE study were to access the prevalence of polyvascular lesion and evolution of intracranial or carotidal arteries plaque, and to investigate the genetic, metabolomic and environmental risk factors related to existing intracranial and carotidal plaque and their progression. A total of 3067 eligible subjects with comprehensive evaluation of atherosclerotic stenosis and plaque were enrolled in the PRECISE study from 2017 to 2019. In the present study, subjects with diabetes mellitus according to self-reported medical history, previous diagnosis by a physician or current use of hypoglycemic agents, and those with missing data of fasting glucose or insulin, or non-interpretable MRI images for cSVD were excluded.
Data collection
Centralized well-trained interviewers collected demographic, medical history, vascular risk factors, and medical treatment through face-to-face interviews following a standard data collection protocol. Medical history encompassed hypertension, coronary artery disease, atrial fibrillation, dyslipidemia, and stroke events.10 Vascular risk factors encompassed blood pressure, total cholesterol, low-density lipoprotein, high-density lipoprotein, estimated glomerular filtration rate, and body mass index (BMI; calculated as weight (kg) divided by the square of height in meters (m2)). Medication used currently was also recorded.
Assessment of insulin resistance
The standard oral glucose tolerance test (OGTT) was performed at baseline in subjects without previously diagnosed diabetes mellitus. The initial venipuncture was performed after an overnight fast and then participants were asked to drink a calibrated dose (75 g) of glucose and to have a second venipuncture 2 hours later. The fasting and 2-hour postload glucose, insulin and C-peptide levels were measured. Fasting and 2-hour postload glucose levels were measured with an enzymatic method, and fasting and 2-hour postload insulin levels were measured with a competitive radioimmunoassay (Diagnostic Products).11
Two measures of insulin resistance, HOMA-IR and ISI0,120, were calculated. The HOMA-IR was calculated as fasting insulin (μU/mL)×fasting glucose (mmol/L)/22.5.12 The ISI0,120 was calculated as m/[G×log10(I)], where m=[75 000 mg+(fasting glucose−2-hour glucose)×0.19×body weight kg]/120 min, G represents the mean of fasting and 2-hour glucose concentrations from the OGTT, and I represents the mean of fasting and 2-hour insulin concentrations. Unit for the ISI0,120 is mg×L2/mmol×mU×min.13 Insulin resistance was defined by the highest HOMA-IR quartile (Q4) and the lowest quartile (Q1) of ISI0,120.
MRI acquisition and processing
MRI scans were obtained on a 3.0 T scanner (Ingenia 3.0 T, Philips, Best, The Netherlands) at baseline and submitted to the imaging research center of Beijing Tiantan Hospital for central adjudication of neuroimaging features of cSVD, including lacunes, WMH, enlarged PVS, and CMBs, by trained neurologists (M Zhou, Y Chen, J Pi, and M Zhao, one rater is responsible for two markers) who were blinded to clinical details (details shown in online supplemental methods). Images with inconsistent results were finally assessed by another senior neurologist (Y Yang) who was blinded to initial results. Inter-rater agreement was evaluated and showed a good reliability with Cohen’s kappa of 0.80, 0.82, 0.90, and 0.80 for lacunes, WMH, enlarged PVS, and CMBs, respectively.
Supplemental material
All neuroimaging markers of cSVD were rated in accordance with the Standards for Reporting Vascular Changes on Neuroimaging criteria.2 Assessment of WMH was based on two semi-quantitative visual scales, the Fazekas score and age-related white matter changes (ARWMC) score,14 15 which provided maximum scores of 6 and 30, respectively. WMH burden was defined as Fazekas score 3 in periventricular or score 2–3 in deep.14 The severity of ARWMC was stratified into three groups: 0 for no ARWMC, 1–10 for mild to moderate and >10 for severe.16 Moderate-to-severe PVS was defined as the number of enlarged PVS in the basal ganglia (BG) >10.17 The location and number of CMBs were recorded in accordance with the Microbleed Anatomical Rating Scale.18 The total SVD score ranging from 0 to 4 was calculated as follows: 1 for presence of lacunes, 1 for presence of microbleeds, 1 for moderate-to-severe PVS in BG (>10), and 1 for WMH burden.3 The modified total SVD score ranging from 0 to 6 was calculated as follows: 1 for presence of lacunes, 1–4 microbleeds, moderate-to-severe PVS (>20) in BG, moderate WMH (total periventricular+deep WMH grade 3–4), 2 for ≥5 microbleeds and severe WMH (total periventricular+deep WMH grade 5–6).17
Statistics
Numeric variables were expressed as means±SD or median (IQR) values, depending on normal or non-parametric distribution evaluated by Kolmogorov-Smirnov test. Categorical variables were expressed as counts and frequencies. Statistical comparison was conducted across quartiles of insulin resistance indices with the χ2 test for categorical variables and with analysis of variance or the Kruskal-Wallis test for continuous variables.
Association of two indices of insulin resistance with cSVD was estimated. Logistic regression model was performed for imaging markers calculated as binary-dependent variables, including lacunes and CMBs, and adjusted ORs with their 95% CIs were estimated. Ordinal logistic regression model was performed for WMH burden, total ARWMC score, BG-PVS burden, and total SVD burden scores, and adjusted common ORs (cOR) with their 95% CIs were estimated. Three multivariable regression models were performed. In model 1, we adjusted for age and gender. In model 2, we also adjusted for medical history including coronary artery disease, atrial fibrillation, dyslipidemia and stroke, smoking, alcohol intake, and medications including lipid-lowering, antiplatelet, anticoagulants. In model 3, we additionally adjusted for medical history of hypertension, medications of antihypertension, systolic blood pressure, diastolic blood pressure and BMI. Logistic regression model with restricted cubic splines for HOMA-IR and ISI0,120 (continuous measures), adjusted for model 2, was performed to evaluated the pattern and magnitude of associations between the two indices of insulin resistance and neuroimaging burden of cSVD. The five knots for spline were placed at the 5th, 25th, 50th, 75th, and 95th percentiles of the two indices of insulin resistance, and the first quartile of the HOMA-IR and the third quartile of the ISI0,120 was treated as the reference.
All analyses were conducted with SAS V.9.4 (SAS Institute). All p values were two-sided with p<0.05 considered statistically significant.
Results
Neuroimaging analysis for cSVD and OGTT were conducted in 2752 subjects, after excluding patients with history of diabetes mellitus, missing data on glucose, insulin, or non-interpretable MRI data for cSVD (online supplemental figure S1). Distribution of age, sex, and vascular risk factors differed significantly across the quartiles of ISI0,120 and HOMA-IR (online supplemental tables S1 and S2). Patients with lower ISI0,120 values and higher HOMA-IR values were more likely to be female, and to have higher levels of blood pressure, BMI, fasting glucose, 2-hour OGTT glucose, hemoglobin A1c and total cholesterol, lower high-density lipoprotein cholesterol, and history of hypertension and dyslipidemia, administration of antihypertensive, lipid-lowering, and antiplatelet agents. These patients were, unexpectedly, less likely to be current or previous smokers or drinkers. There was an opposite trend with respect to age for the two parameters, with patients with lower ISI0,120 values being older and those with higher HOMA-IR values being younger.
Association of insulin resistance with total SVD burden
Table 1 shows the associations of ISI0,120 and HOMA-IR with total burden scores of cSVD defined by two methods. Patients with lower level of ISI0,120 (indicating higher insulin resistance) were intended to have higher total burden score, after adjustment for model 2 (cOR 1.34, 95% CI 1.04 to 1.72, p=0.02 (4-point scale); cOR 1.43, 95% CI 1.14 to 1.80, p=0.002 (6-point scale)). The association was only found between HOMA-IR and 4-point scale of total SVD burden (adjusted for model 2: cOR 1.33, 95% CI 1.04 to 1.70, p=0.03). However, these associations were not significant after additionally adjusted for blood pressure, BMI, history of hypertension, or use of antihypertensive agents.
Ordinal logistic regression analysis for the association of insulin resistance indices and total burden of cSVD
Association of insulin resistance with neuroimaging markers of cSVD
Table 2 shows associations between the ISI0,120 and neuroimaging markers of cSVD. Patients in the lower ISI0,120 category were associated with a higher risk of severe ARWMC (OR 1.97, 95% CI 1.15 to 3.38, p=0.01) and lacune (OR 1.96, 95% CI 1.15 to 3.36, p=0.01) with adjustment for model 2. The association between the ISI0,120 level and WMH burden was marginally significant after additionally adjusted by model 2 (OR 1.37, 95% CI 1.00 to 1.89, p=0.053). The fourth quartile of the HOMA-IR was also associated with lacune after adjustment for model 2 (OR 1.90, 95% CI 1.11 to 3.25, p=0.02). However, after additional adjustment for blood pressure, BMI, history of hypertension or use of antihypertensive medication, these associations became statistically insignificant, indicating a non-negligible role of blood pressure and obesity. Neither a significant association was found between ISI0,120 and PVS burden or CMBs, nor between HOMA-IR and WMH burden, severe ARWMC, BG-PVS, or CMBs (table 3).
The association of insulin resistance assessed by ISI0,120 and neuroimaging markers of cSVD
The association of insulin resistance assessed by HOMA-IR and imaging features of cSVD
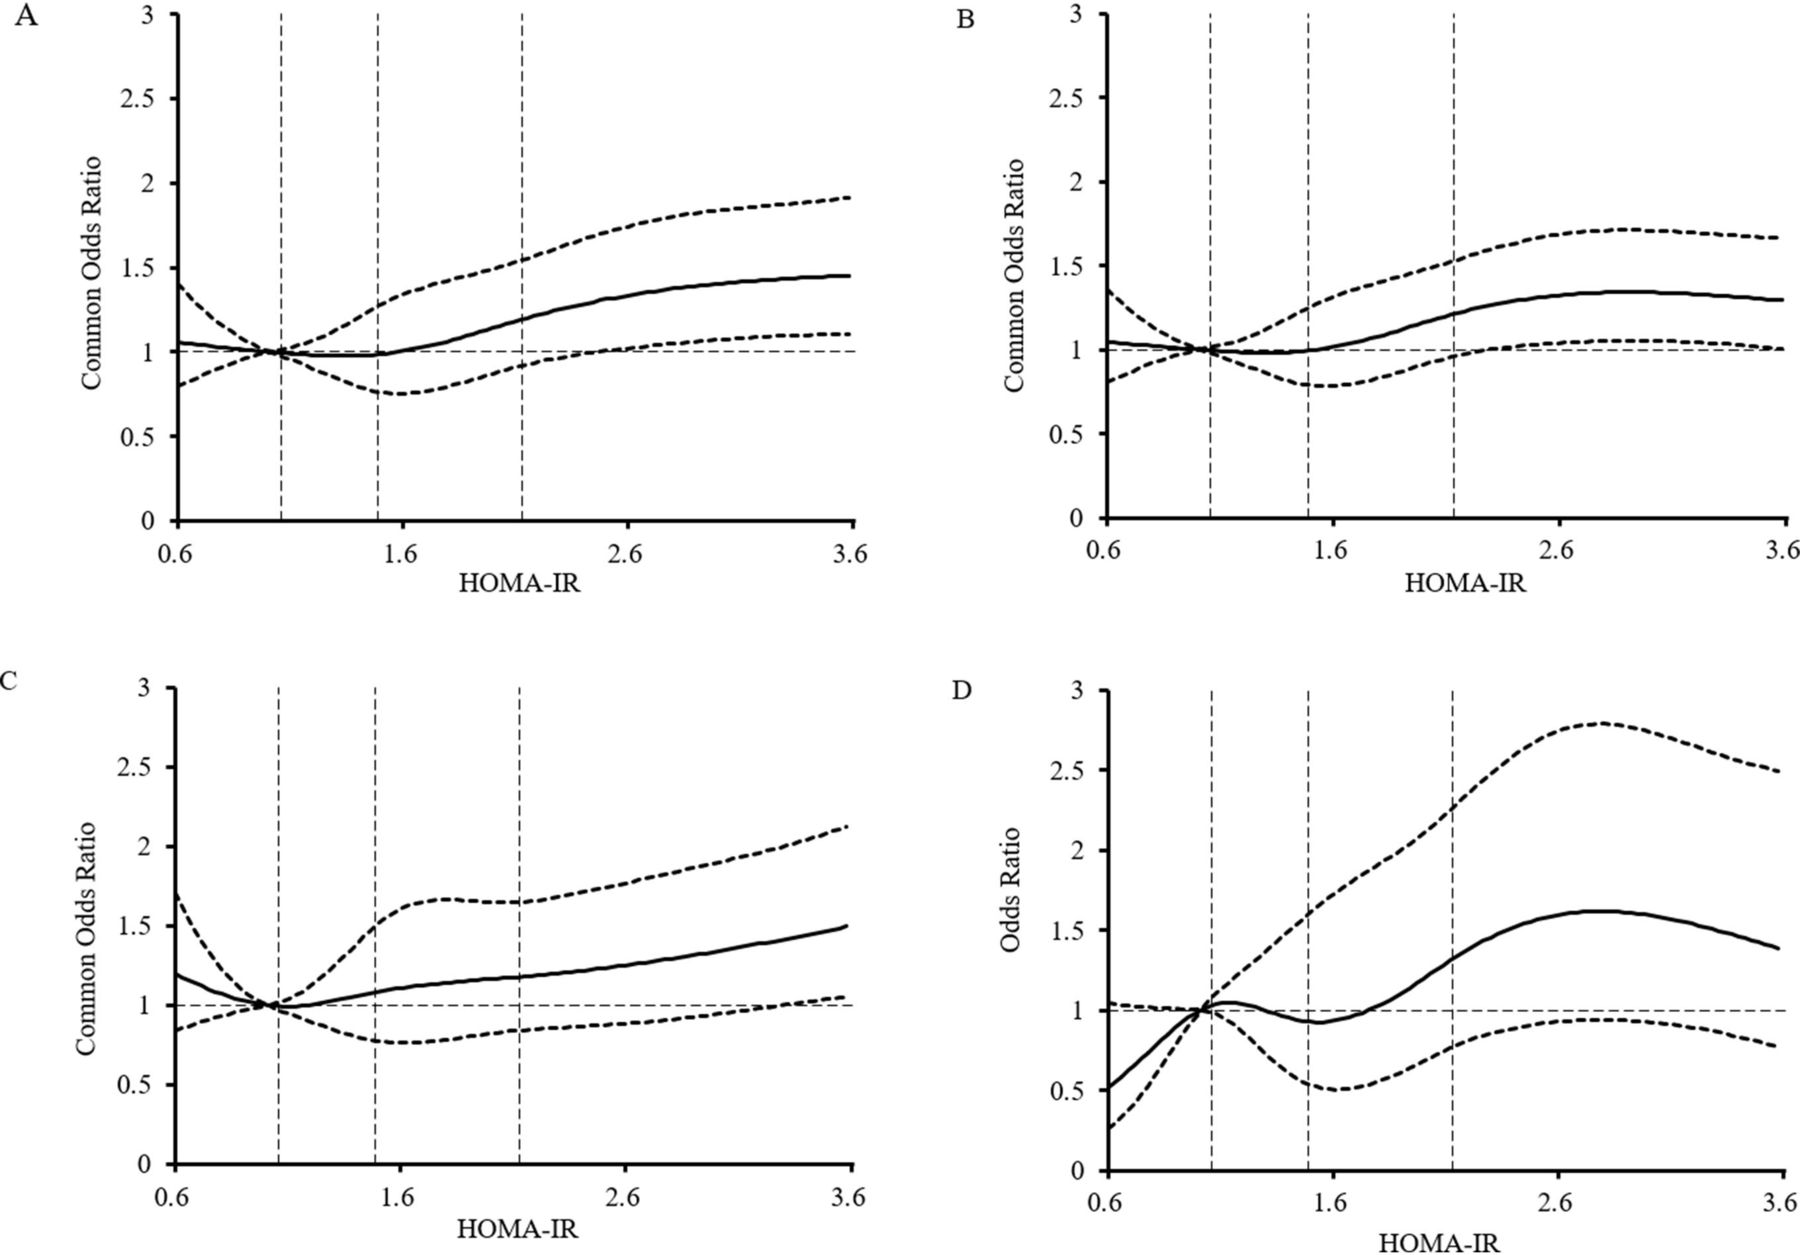
Using a multivariable regression model with restricted cubic spline, we found that a lower ISI0,120 level was associated with a higher risk of WMH, lacunes, and total SVD burden (figure 1). However, the association between HOMA-IR and SVD burden was inapparent (figure 2).
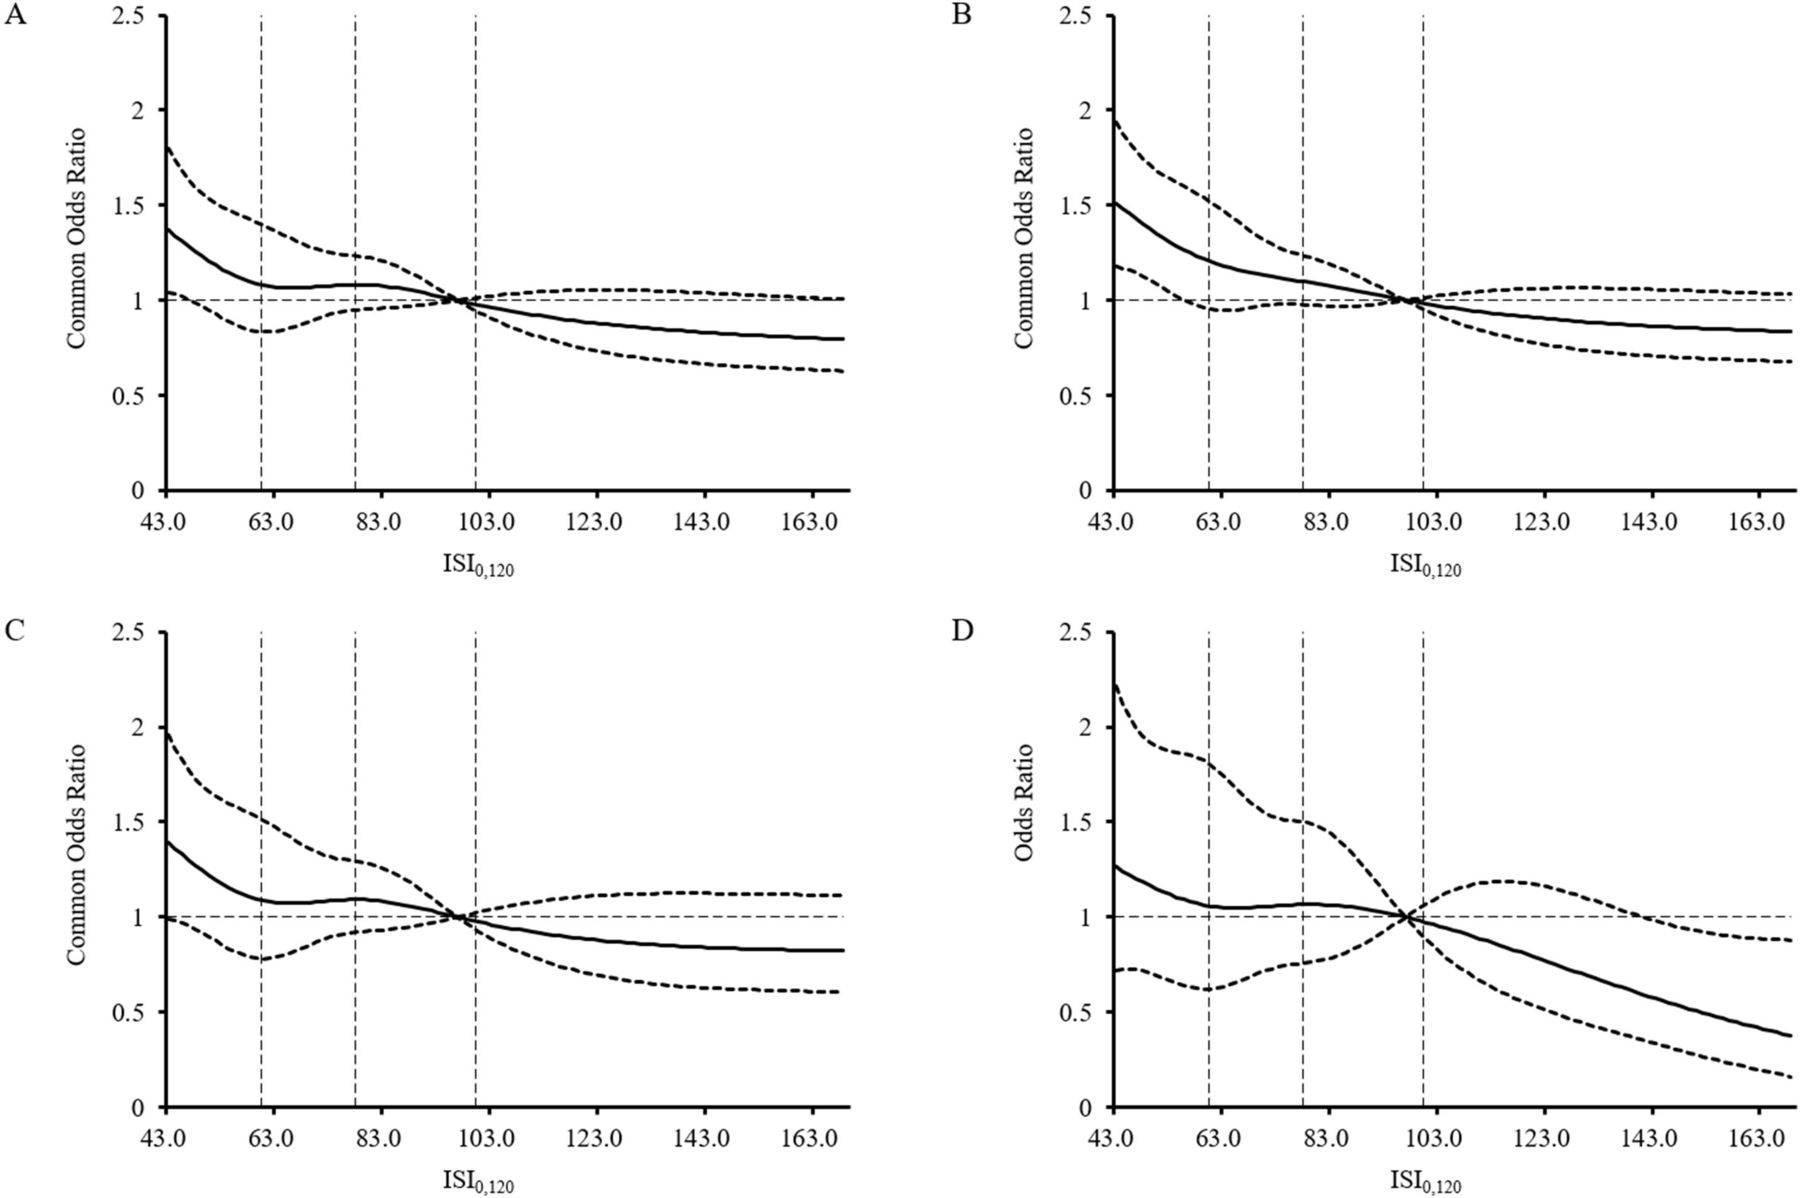
Adjusted ORs for (A) total SVD score (4-point scale), (B) total SVD score (6-point scale), (C) white matter hyperintensities, (D) lacunes according to the ISI0,120. The solid line indicates adjusted common ORs/ORs, and the dashed lines indicate the 95% CI bands. Reference is the third quartile of the ISI0,120 (97.08). The vertical dashed lines indicate the first, second, and third quartiles of the ISI0,120. Data were fitted using an ordinal logistic regression model of restricted cubic spline with five knots (the 5th, 25th, 50th, 75th, 95th percentiles) for ISI0,120 and two total SVD scores, and binary logistic regression model for ISI0,120 and white matter hyperintensities and lacunes, all adjusting for age, gender, medical history including coronary artery disease, atrial fibrillation, dyslipidemia and stroke, smoking, alcohol intake, and medications including lipid-lowering, antiplatelet, anticoagulants. The lowest 5% and highest 5% of participants are not shown. ISI, insulin sensitivity index; SVD, small vessel disease.

Adjusted ORs for (A) total SVD score (4-point scale), (B) total SVD score (6-point scale), (C) white matter hyperintensities, (D) lacunes according to the HOMA-IR. The solid line indicates adjusted ORs and the dashed lines indicate the 95% CI bands. Reference is the first quartile of the HOMA-IR (1.07). The vertical dashed lines indicate the first, second, and third quartiles of the HOMA-IR. Data were fitted using an ordinal logistic regression model of restricted cubic spline with five knots (the 5th, 25th, 50th, 75th, 95th percentiles) for HOMA-IR and two total SVD scores, and binary logistic regression model for HOMA-IR and white matter hyperintensities and lacunes, all adjusting for age, gender, medical history including coronary artery disease, atrial fibrillation, dyslipidemia and stroke, smoking, alcohol intake, and medications including lipid-lowering, antiplatelet, anticoagulants. The lowest 5% and highest 5% of participants are not shown. HOMA-IR, homeostatic model assessment for insulin resistance; SVD, small vessel disease.
Discussion
In this population-based cohort of 2752 resident population without diabetes, we found that insulin resistance was potentially associated with an increased risk of cSVD, particularly white matter changes and lacunes. The association was a little more pronounced for ISI0,120 based on postglucose load measurements as an index of insulin resistance, as compared with HOMA-IR based on fasting glucose and insulin. However, the results were greatly influenced by blood pressure/hypertension and BMI.
Previous studies have focused on the association of insulin resistance, mostly defined by HOMA-IR, typically with a single neuroimaging feature of the cSVD or the total SVD burden score developed by Wardlaw et al.4–6 19 20 A comprehensive assessment of the association between insulin resistance and cSVD is lacking. Our study adopted two measures of insulin resistance and comprehensively evaluated different neuroimaging markers and total burden of cSVD. We found an association between insulin resistance and cSVD, which varies among different phenotypes of cSVD. Previous mendelian randomization studies unraveled that genetic predisposition to insulin resistance was associated with small vessel stroke.21 22 And cross-sectional studies added evidence to the association between insulin resistance and white matter lesions and lacunes.4 5 20 In line with previous study, our study indicated that insulin resistance is more significantly associated with ischemic lesions, such as white matter changes and lacunes, rather than hemorrhagic lesions (CMBs) of cSVD. The CMBs and PVS are reported to be age-related and hypertension-related changes. Although a previous study reported association between insulin resistance and enlarged PVS, the authors did not adjust for confounding factors, which made the results less reliable.23 And a meta-analysis showed strong evidence that age and hypertension, rather than diabetes mellitus, were associated with enlarged PVS.24 Likewise, as CMBs are caused by microvascular breakdown, aging and hypertension-related vessel wall injury and secondary permeable BBB may be more critical in the hemorrhagic process.25 26
However, the association between insulin resistance and cSVD was greatly influenced by blood pressure/hypertension and BMI. Hypertension, obesity, and insulin resistance are critical components of metabolic syndrome, and there is an interaction between insulin resistance and hypertension and obesity. Previous studies have indicated that insulin resistance might act as a trigger for the development of hypertension27–29 through multiple mechanisms, including induction of sodium retention, increased circulatory fluid volume, and activation of the sympathetic nervous system and renin-angiotensin system.30 31 Leveraging genome-wide association study summary data demonstrated a causal relationship between obesity and small vessel stroke and also a possible role for mediation through hypertension.32 Given this, adjustment for blood pressure/hypertension and BMI may cause multicollinearity, which may distort the interpretation of regression models and increase inaccuracy in the estimation of regression coefficients.33 Further investigations are needed to clarify the association among them.
Composite SVD scale provides a measure of the overall burden of cSVD, advances the assessment of disease severity, and improves inter-rater reliability among investigators. The 4-point scale of cSVD burden proposed by Wardlaw et al dichotomizes established rating systems for each neuroimaging markers and incorporates them, which may limit the intended use.34 Lau et al refined the composite scale by incorporating different weightings based on microbleeds and WMH burden, yet, they did not find the modification improve its utility in clinical practice.17 However, we performed both scales and found a more obvious association between ISI0,120 and the modified total burden scale (with higher cOR and lower p value), indicating that differential weighting of each MRI feature seems to make sense but still needs to be validated in larger studies.
Our study indicated a slightly more pronounced association between the ISI0,120 and cSVD as compared with HOMA-IR. Such difference between different insulin resistance indices has also been observed previously.5 27 35 This is probably due to the fact that ISI0,120 incorporates both peripheral and hepatic insulin sensitivity and has superior concordance with the hyperinsulinemic-glycated clamp (the gold standard for measuring insulin resistance) than HOMA-IR, which reflects hepatic insulin sensitivity alone,8 the use of which may lead to misclassification of a proportion of patients.36 37 In addition, the effect of body weight on the glucose uptake rates in peripheral tissues is taken into account in the development of ISI0,120, and log-transforms insulin values was used to correct for skewness of distribution.13
Several limitations of our study should be mentioned. First, all participants in this study were from a rural region of China, which may lead to unavoidable selection bias and limited generalizability of our findings. However, as the population is relatively fixed and less mobile, and the demographic characteristics and medical history are similar to those of the nationwide sample survey,9 the enrolled population is representative, which can improve generalizability in our nationwide sample. Second, although the PRECISE study is a prospective study, only baseline imaging data are currently available, the association between insulin resistance and the evolution of cSVD neuroimaging markers is unclear, and the causal relationship between insulin resistance and cSVD needs further investigation. Third, there were some patients with high fasting glucose and postload glucose may be included in the present analysis according to the exclusion criteria. Those subjects were treated as non-diabetic because they had not been diagnosed as diabetics nor had they received medical treatment for diabetes. This would potentially lead to an overestimation of the association between insulin resistance and cSVD and caution is needed in interpreting the results.
Conclusion
In conclusion, insulin resistance is potentially associated with increased risk of cSVD, particularly the white matter changes and lacunes, in the general population. Additionally, the ISI0,120 index presented a somewhat more pronounced association with increased risk of cSVD, as compared with HOMA-IR. However, blood pressure/hypertension and BMI may have a significant impact on the association between insulin resistance and cSVD, which needs further investigations.
Data availability statement
Data are available on reasonable request. The data that support the findings of this study are available from the corresponding author on reasonable request. Supplementary data are available online.
Ethics statements
Patient consent for publication
Ethics approval
This study was approved by Beijing Tiantan Hospital (IRB approval number: KY2017-010-01) and Lishui Hospital (IRB approval number: 2016-42). Participants gave informed consent to participate in the study before taking part.
Acknowledgments
We thank Yiyi Chen, Jingtao Pi, and Mengxi Zhao for their contribution in imaging interpretation.
References
Supplementary materials
Supplementary Data
This web only file has been produced by the BMJ Publishing Group from an electronic file supplied by the author(s) and has not been edited for content.
Footnotes
MZ and SW contributed equally.
Contributors YLW acted as the Guarantor. YP and YLW accept full responsibility for the work and/or the conduct of the study, had access to the data, and controlled the decision to publish. Study design and conception: MZ, SW, YP. Acquisition of data: SW, XC, LM, SL, TW, and YP. Data analysis: MZ and YP. Interpretation of analysis: MZ, SW, YLW, and YP. Drafting of the manuscript: MZ, SW, YLW, and YP. Manuscript review for scientific content: YLW and YP. Supervision: JJ, JL, XM, HL, YLW, YJW, and YP.
Funding This study is supported by grants from the National Natural Science Foundation of China (No. 81825007, 81971091), Beijing Outstanding Young Scientist Program (No. BJJWZYJH01201910025030), Beijing Hospitals Authority Youth Program (QML20190501), Youth Beijing Scholar Program (No. 010), Beijing Talent Project—Class A: Innovation and Development (No. 2018A12), 'National Ten-Thousand Talent Plan'—Leadership of Scientific and Technological Innovation, National Key R&D Program of China (No. 2017YFC1307900, 2017YFC1307905), Key Science & Technologies R&D Program of Lishui City (2019ZDYF18), Zhejiang provincial program for the Cultivation of High-level Innovative Health talents, and AstraZeneca Investment (China).
Competing interests None declared.
Provenance and peer review Not commissioned; externally peer reviewed.
Supplemental material This content has been supplied by the author(s). It has not been vetted by BMJ Publishing Group Limited (BMJ) and may not have been peer-reviewed. Any opinions or recommendations discussed are solely those of the author(s) and are not endorsed by BMJ. BMJ disclaims all liability and responsibility arising from any reliance placed on the content. Where the content includes any translated material, BMJ does not warrant the accuracy and reliability of the translations (including but not limited to local regulations, clinical guidelines, terminology, drug names and drug dosages), and is not responsible for any error and/or omissions arising from translation and adaptation or otherwise.