Article Text

Abstract
Introduction Disentangling the specific factors that regulate glycemia from prediabetes to normoglycemia could improve type 2 diabetes prevention strategies. Metabolomics provides substantial insights into the biological understanding of environmental factors such as diet. This study aimed to identify metabolomic markers of regression to normoglycemia in the context of a lifestyle intervention (LSI) in individuals with prediabetes.
Research design and methods We conducted a single-arm intervention study with 24 weeks of follow-up. Eligible study participants had at least one prediabetes criteria according to the American Diabetes Association guidelines, and body mass index between 25 and 45 kg/m2. LSI refers to a hypocaloric diet and >150 min of physical activity per week. Regression to normoglycemia (RNGR) was defined as achieving hemoglobin A1c (HbA1c) <5.5% in the final visit. Baseline and postintervention plasma metabolomic profiles were measured using liquid chromatography-tandem mass spectrometry. To select metabolites associated with RNGR, we conducted the least absolute shrinkage and selection operator-penalized regressions.
Results The final sample was composed of 82 study participants. Changes in three metabolites were significantly associated with regression to normoglycemia; N-acetyl-D-galactosamine (OR=0.54; 95% CI 0.32 to 0.82), putrescine (OR=0.90, 95% CI 0.81 to 0.98), and 7-methylguanine (OR=1.06; 95% CI 1.02 to 1.17), independent of HbA1c and weight loss. In addition, metabolomic perturbations due to LSI displayed enrichment of taurine and hypotaurine metabolism pathway (p=0.03) compatible with biomarkers of protein consumption, lower red meat and animal fats and higher seafood and vegetables.
Conclusions Evidence from this study suggests that specific metabolomic markers have an influence on glucose regulation in individuals with prediabetes after 24 weeks of LSI independently of other treatment effects such as weight loss.
- prediabetic state
- life style
- biomarkers
Data availability statement
Data are available on reasonable request.
This is an open access article distributed in accordance with the Creative Commons Attribution Non Commercial (CC BY-NC 4.0) license, which permits others to distribute, remix, adapt, build upon this work non-commercially, and license their derivative works on different terms, provided the original work is properly cited, appropriate credit is given, any changes made indicated, and the use is non-commercial. See: http://creativecommons.org/licenses/by-nc/4.0/.
Statistics from Altmetric.com
WHAT IS ALREADY KNOWN ON THIS TOPIC
Lifestyle interventions (LSI) provide benefits to glucose regulation in prediabetes.
There is a considerable variation in the individuals to receive the benefits of a LSI.
Metabolomics provides substantial insights into the interplay between disease, and environmental exposures to explain individual responses to treatment.
WHAT THIS STUDY ADDS
Three metabolites were significantly associated with regression to normoglycemia in prediabetes: N-acetyl-D-galactosamine, putrescine, and 7-methylguanine.
In addition, changes in taurine and hypotaurine metabolism pathways were observed after a LSI.
The metabolomic changes associated with a LSI are compatible with biomarkers of protein consumption, lower red meat and animal fats, and higher seafood and vegetables.
HOW THIS STUDY MIGHT AFFECT RESEARCH, PRACTICE OR POLICY
Metabolites associated with regression to normoglycemia can provide a potential route for therapeutic target discovery.
Food profiles illuminated from these results can help to design more effective therapeutic strategies for diabetes prevention.
Introduction
Type 2 diabetes (T2D) is a major threat to global health. T2D occurs at varying rates in people from different ethnic backgrounds.1 Prediabetes is a prevalent condition that identifies individuals with hyperglycemia who do not meet the criteria for T2D but whose glucose levels are higher than those considered normal.2 Individuals with prediabetes are at increased risk of developing T2D and cardiovascular risk.3 The seminal event in the progression from prediabetes to T2D is β-cell failure and can be reversible.4 5 And among individuals with prediabetes, regression to normoglycemia is the most frequent outcome.6 7
Lifestyle interventions (LSI) can prevent future diagnosis of T2D.8 Yet, patients at high risk of diabetes have considerable variation in their likelihood of seeing the benefit of diabetes prevention treatments,9 responding differently to the same diet. High-throughput metabolomics technologies have provided insights into the pathophysiological pathways and understanding T2D and prediabetes,10 as well as markers of food and nutrient consumption that uncovered metabolic pathways that are potentially modified by diet.11 There is evidence of differences in the lipidomic profile of high-density lipoprotein and low-density lipoprotein particles of individuals with prediabetes who regress to normoglycemia after ~2 years of follow-up without treatment.12 However, the extent to which these or other metabolites are modified in a lifestyle intervention has not been described.
Metabotypes refer to the process of grouping similar individuals based on phenotypic or metabolomic profiles13 and have helped to identify differential responses to dietary interventions14 and weight loss.13 Identifying the metabolomic profile of individuals with prediabetes who regress to normoglycemia can provide substantial insights into the dietetic and physiological modulators of glucose regulation during a LSI that could be nutritional intervention targets for T2D prevention. In this study, we aimed to identify metabolomic markers of regression to normoglycemia in the context of a LSI in individuals with prediabetes.
Research design and methods
Study population and design
We conducted a single-arm intervention study with 24 weeks of follow-up. The study sample included individuals who responded to physical and electronic advertisements posted in the Research Unit of Metabolic Diseases (Unidad de Investigacion en Enfermedades Metabolicas (UIEM)) within the Instituto Nacional de Ciencias Medicas y Nutricion (INCMNSZ). Eligibility for study participation was first determined in a screening visit by the presence of at least one prediabetes criteria according to the American Diabetes Association: fasting glucose between 100 and 125 mg/dL, hemoglobin A1c (HbA1c) 5.7%–6.4%, and/or 2-hour blood sugar between 140 and 199 mg/dL after an oral load of 75 g of glucose.2 Additional criteria were age between 18 and 69 years and body mass index (BMI) in the overweight or obesity categories (BMI 25–45 kg/m2). Exclusion criteria included using glucose-lowering drugs such as metformin or corticosteroids, pregnancy, and subjects under nutritional or physical activity counseling prescribed by a medical professional.
Procedures
The study included four visits: screening, intervention, follow-up, and final. All visits took place at UIEM within the INCMNSZ. For the screening visit, subjects were asked to attend at 07:00 hours after an overnight fast. Participants underwent a 3-hour oral glucose tolerance test (OGTT) using 75 g of glucose. Anthropometric measures were performed in the screening visit following standardized protocols. Subjects were evaluated in fasting with light clothes and without shoes on. Body weight was measured with Seca mBCA 514 (Hamburg, Germany) medical body composition analyzer. Height was measured with Seca 284 (Hamburg, Germany) stadimeter. Weight and height were used to compute BMI as the ratio of weight (kilograms nearest 0.01) to squared height (m2), computed with a Microsoft Excel formula. Waist and hip circumference (centimeters nearest 0.5) were measured at the midpoint between the lower ribs and the iliac crest and the level of the trochanter major, respectively. Both measures were used to calculate the waist-to-hip ratio.
Subjects with eligible criteria were asked to attend the intervention visit 1 week after the screening visit. During the intervention visit, participants underwent a body composition evaluation through dual-energy X-ray absorptiometry (General Electric, Lunar Prodigy, Madison, Wisconsin, USA).
Lifestyle intervention
Standardized dietitians implemented the LSI. This intervention included a hypocaloric diet (500 kcal reduction of daily energy expenditure), distributed as follows: 45% of the total calorie daily intake of carbohydrates, 30% lipids, and 15% from protein sources. Individuals received instructions to organize their meals with an educational handbook containing food groups and personalized servings. In addition, the intervention included tailored physical activity recommendations to reach >150 min medium intensity per week. Goals were stabilized to reach >3% weight loss over the follow-up.15 Participants were trained to log their food habits and physical activity three times per week. After 12 weeks, subjects attended a follow-up visit with the dietitian to reinforce knowledge and goals. The final visit took place 24 weeks after the intervention visit, and all measurements were repeated. Across visits, we evaluated participants’ food and physical activity habits with a 24-hour food recall and a log of activities. This information helped to assess the patient’s adherence to diet and physical activity modifications.
Outcomes
Regression to normal glucose regulation (RNGR) was defined as HbA1c <5.5% in the final visit to avoid the regression to the mean bias,16 frequently observed in single measurements such as fasting glucose and 2-hour glucose. Prediabetes maintenance was defined as having at least one of the prediabetes criteria in the last visit. Incident T2D was defined as fasting plasma glucose >126 mg/dL and/or glucose post load of >200 mg/dL and/or HbA1c >6.5 in any of the visits; these individuals were removed from the analysis to avoid comparison imbalance between groups since they represented a small proportion of the sample (n=6).
Calculations
Daily energy, macronutrient and micronutrient intakes were assessed through a 24-hour food recall. Data were analyzed using ESHA’s Food Processor Nutrition Analysis software (Salem, Oregon, USA). For measuring insulin secretion, we used the early insulin response, defined as the ratio of the 30 min change in insulin concentration to the 30 min change in glucose concentration after oral glucose loading, that is, (Ins30–Ins0)/(Gluc30–Gluc0)17; and the oral disposition index defined as O (Ins0–30/Gluc0–30×1/Ins0).18 Furthermore, insulin sensitivity was estimated with Matsuda index19 as follows:  , Oral Glucose Insulin Sensitivity Index (OGIS)20 through the website http://webmet.pd.cnr.it/ogis/, and homeostasis model assessment for insulin resistance that was computed as fasting glucose×fasting insulin/405.21
Metabolomic analyses
The plasma metabolomics profiling was performed in the Metabolomics Platform at the Broad Institute of Harvard University and Massachusetts Institute of Technology (Cambridge, Massachusetts, USA) using high-throughput liquid standardization. A total of 219 named metabolites were qualified for primary analyses (online supplemental table 1). To reduce noise in the profiling data, we implemented a quality control (QC) pipeline and metabolite signals with noisy trends were removed from the study. The QC steps included: normalization with internal standards and pooled samples, removal of metabolites with >25% of missing values, missing value imputation, and normalization and covariate adjustment. Missing metabolites values were imputed using mice (https://cran.r-project.org/web/packages/mice/index.html) package.
Supplemental material
Statistical analysis
Differences in baseline clinical characteristics, as well as differences before and after treatment, were analyzed with a t-test and Mann-Whitney U test according to the variable’s distribution. Metabolomic fold changes (FC) were computed using a paired approach using the limma R package (https://bioconductor.org/packages/limma/). Generalized estimating equation models were used to account for HbA1c at baseline. Metabolites were log-transformed and adjusted by age and sex. Residuals of the regression were normalized by inversed normal transformation. The changes of the metabolites before versus after the intervention were computed using an FC analysis setting a cut-off point of an FC >0.25 and a p value adjusted for multiple comparisons <0.05 as significant (q value). For metabolite selection, we conducted the least absolute shrinkage and selection operator-penalized regressions (LASSO) with 10-fold cross-validation to select metabolites before the intervention (baseline) and after intervention accounting for baseline abundances (log2FC). We used RNGR as outcome variable b giving minimum mean cross-validated error 9. We repeated this process 100 times and accumulated the selection frequency across 100 iterations for each metabolite separately and used a threshold of 10 selections to prioritize the top metabolites selected. This analysis was performed using the glmnet (https://cran.r-project.org/web/packages/glmnet/index.html) package implemented in R V.3.6.1 program (https://www.r-project.org/). We considered two-sided p<0.05 to denote evidence against the null hypothesis.
Results
A total of 205 individuals were screened, of which 138 were confirmed prediabetes cases in the screening visit, and 131 attended the intervention visit (online supplemental figure 1). The retention rate at the end of the study was 67.1%. The most frequently reported cause of withdrawal was the lack of time to attend the visits. Subjects who did not complete the study were younger than those who completed the study (45.02±11 vs 49.45±11, p=0.035).
After 24 weeks of LSI, 27 (30.6%) individuals regressed to normal glucose regulation, 55 (62.5%) maintained their prediabetes status and 6 individuals (6.8%) progressed to T2D. The characteristics at baseline overall and by groups are shown in table 1. RNGR subjects were younger (44.33±13.87 vs 52.23±10.88, p=0.008). Surrogates of insulin secretion and sensitivity did not show significant differences at baseline among groups (p>0.05), indicating that RNGR was not entirely driven by relatively better glycemic health at baseline (online supplemental table 2).
Baseline characteristics of the study population according to their final status (n=82)
Intervention effectiveness
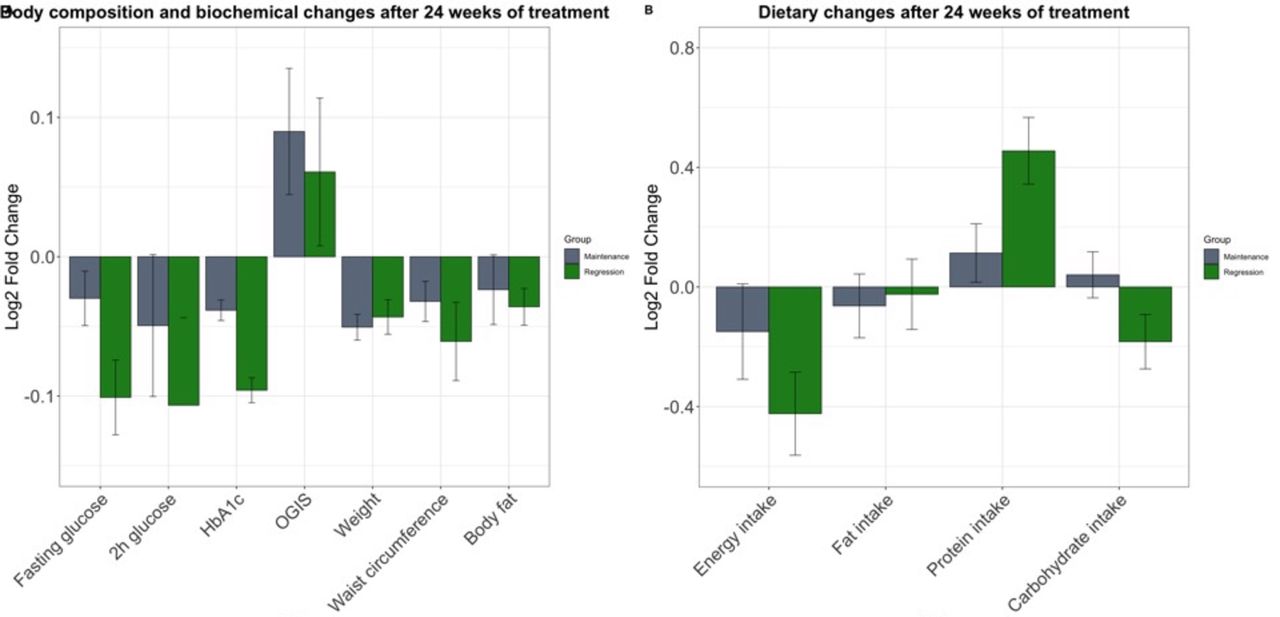
After 24 weeks of LSI, the mean weight loss was 2.46±3.48 kg, with 47.5% (n=39) of the subjects reaching the >3% weight loss goal. The intervention was effective in reducing weight, waist circumference, body fat, fasting glucose, HbA1c, and increasing insulin sensitivity measured by OGIS (p<0.05) (online supplemental table 3). Participants displayed favorable changes in their dietary behavior: significant reduction in total energy and sugar intake, and increased protein intake (p<0.01) (figure 1). The increment of protein consumption was associated with a lower probability of maintenance (HR 0.97, 95% CI 0.94 to 0.99) independent of age, sex, HbA1c at baseline, and weight loss (table 2). Increased protein consumption increased after the intermediate visit (online supplemental figure 2).

Changes after 24 weeks of lifestyle intervention in body composition, biochemical (A) and dietary traits (B). Changes are displayed as Log2 fold change and SE. The intervention effectively reduced fasting glucose, HbA1c, weight, waist circumference, and energy intake (p<0.001). After adjusting for confounders, subjects regressed to normal values of HbA1c and increased their protein consumption (p=0.023). Before and after significance values were computed with paired t-test. Significances with covariate adjustment (age, age2, sex, and BMI (in non-anthropometric variables)) were computed in a logistic regression model. BMI, body mass index; HbA1c, hemoglobin A1c; OGIS. Oral Glucose Insulin Sensitivity Index.
Clinical variables associated with regression to normal glucose tolerance
Metabolites associated with RNGR
Before the intervention (baseline), three metabolites were selected at least 10 times in the LASSO regression (online supplemental table 4): PS (P-36.1)/PS (O.36.2) (OR=0.51; 95% CI 0.28 to 0.90), C5.1 carnitine (OR=0.58; 95% CI 0.32 to 0.97), and Cer (d18:1/24:1) (OR=0.59; 95% CI 0.33 to 0.98). Nevertheless, these metabolites appeared to be affected by BMI and HbA1c since neither of them maintained the significance level after the adjustment.
After 6 months of intervention, 40 metabolites measured by their FC were prioritized 10 or more times in the LASSO regression (online supplemental figure 3, online supplemental table 5). The profile was composed mainly by changes in amino acids (N(6)-methyllysine, thyroxine, creatine, N-acetylalanine, glutamine), lysophosphatidylcholines (LPC (18.3), LPC (14.0), LPC (16.0)), carnitines (C18 carnitine, C10:2.carnitine, C5-DC.carnitine, C12:1.carnitine), sphingolipids (Sd18.1.22.1, SM[d18:1/14.0], SM[d18.1.20.0]), and organic compounds (1,7-dimethyluric acid, trigonelline, tryptophan, allantoin, N-carbamoyl-beta-alanine, 1-methylhistamine, 2-methylguanosine, 7-methylguanine). This profile displays metabolites biomarkers of vegetables, fruits, and legumes (trigonelline, tryptophan, allantoin, N-carbamoyl-beta-alanine) consumption, as well as sources of protein and fat (amino acid, fatty acid, acylcarnitines, and glycerophospholipid). After adjusting for HbA1c and weight loss, only three metabolites remained significant: N-acetyl-D-galactosamine (OR=0.54; 95% CI 0.32 to 0.82), 7-methylguanine (OR=1.06; 95% CI 1.02 to 1.17), and putrescine (OR=0.90, 95% CI 0.81 to 0.98) (figure 2).

Metabolites associated with regression to normoglycemia. Metabolite abundances were adjusted by age and sex and normalized using inverse normal transformation. Values fold change before versus intervention. Logistic regression model was computed using regression to normoglycemia as outcome adjusted by hemoglobin A1c and Δ weight.
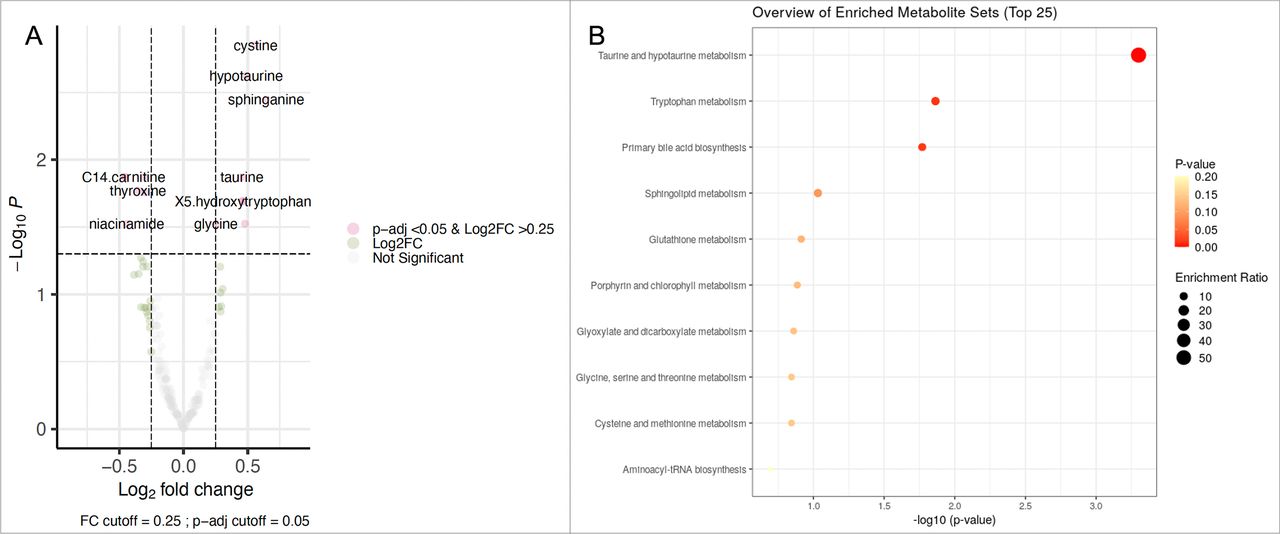
Metabolomic changes after LSI
Finally, we sought to identify metabolites with substantial change after the LSI. Fourteen metabolites displayed significant changes before and after LSI (log2FC >0.25 and q<0.05) (figure 3, online supplemental table 6). After the LSI, we observed lower levels of C14 carnitine (log2FC −0.46 and q=0.013), PS/P36 (log2FC −0.30 and q=0.013), inosine (log2FC −0.45 and q=0.013), thyroxine (log2FC −0.35 and q=0.01), myristoleic acid (log2FC −0.29 and q=0.01), and niacinamide (log2FC −0.44 and q=0.02). Our sample also displayed increased levels of cystine (log2FC 0.56 and q=0.001), hypotaurine (log2FC 0.48 q=0.002), sphinganine (log2FC 0.64 and q=0.003), taurine (log2FC 0.45 and q=0.01), 5-hydroxytryptophan (log2FC 0.46 and q=0.02), serotonin (log2FC 0.46 and q=0.02), glycine (log2FC 0.25 and q=0.02), and pro-glycine (log2FC 0.47 and q=0.02) (figure 3A). These metabolites enriched the taurine and hypotaurine metabolism pathway (p=0.03) (figure 3B). The metabolomic profile after LSI reflects activity in biomarkers of protein consumption, lower red meat and animal fats (C14 carnitine, inosine, myristoleic acid), and higher seafood and vegetables (cystine, sphinganine, taurine, serotonin).
(A) Metabolites associated with lifestyle intervention. (B) Enrichment analysis of the significantly modified metabolites (log2FC >0.25 and q=0.05) after 24 weeks of intervention. FC, fold change.
Discussion
This study set out with the aim of identifying metabolomic markers of regression to normoglycemia in the context of a 24 weeks of LSI in individuals with prediabetes. Changes in three metabolites (N-acetyl-D-galactosamine, putrescine, and 7-methylguanine) were significantly associated with regression to normoglycemia independent of other treatment factors such as HbA1c at baseline and weight loss. In addition, the metabolomic changes associated with a LSI were represented by activity in biomarkers of protein consumption, lower red meat and animal fats, and higher seafood and vegetables (cystine, sphinganine, taurine, serotonin). These metabolites enriched the taurine and hypotaurine metabolism pathway (p=0.03).
In our study, low concentrations of N-acetyl-D-galactosamine were associated with a higher probability to regress to normoglycemia; this is consistent with previous reports that associate higher concentrations of N-acetyl-D-galactosamine with incident cardiovascular disease,24 diabetes mellitus,25 as well as the longitudinal risk of all-cause, cardiovascular, and cancer mortality after 20.5 years among initially healthy individuals.26 N-acetyl-D-galactosamine identifies glycan residues on circulating glycoproteins, the majority of which are acute phase reactants. A large proportion of the potential risk associated with elevated N-acetyl-D-galactosamine would relate to systemic inflammatory pathways.26 Further studies are needed to explore potential modulators and causes of N-acetyl-D-galactosamine concentrations.
Low levels of putrescine were associated with a higher probability of regression to normoglycemia in our study. Putrescine is a polyamine. In mouse models, the dysregulation of polyamine metabolism impacts glucose, lipid, and energy homeostasis.27 28 Fernandez-Garcia et al reported high levels of serum putrescine in patients with T2D and a positive correlation with HbA1c.29 This is consistent with the deleterious role of putrescine in glucose regulation found in our study. External sources of putrescine include fruits, vegetables, and seeds, which might reflect the changes in the pattern of consumption of the participants.
Finally, 7-methylguanine was positively associated with regression to normoglycemia. 7-Methylguanine is a hypoxanthine. In previous studies, this metabolite has shown a positive association with T2D.30 Differences between these findings and our findings could be related to sample size differences and longer follow-ups.
In this study, subjects who increased their protein consumption were more likely to regress to normal glucose tolerance than those who maintained it. Stentz et al31 found that a high protein diet had 100% remission of prediabetes compared with only 33% on a high carbohydrate diet with similar weight loss. This association may partly be explained by increases in incretin hormones gastric inhibitory polypeptide, glucagon-like peptide-1, and ghrelin in a high protein diet, which improves insulin sensitivity and β-cell function.32
Finally, taurine and hypotaurine increased their abundance in plasma after the LSI. These metabolites are antioxidant and anti-inflammatory agents.33 The main natural dietary sources are foods of animal origin, particularly seafood.34 Regarding its effect on glucose metabolism, taurine and hypotaurine have been shown to lower blood glucose levels and improve hyperglycemia and hyperglycemia-induced insulin resistance in mouse models.35
The findings in this study are limited by the sample size and lack of replication in an independent cohort. Also, the method used to assess diet in this study, 24 hours recall, can be subject to substantial reporting bias and misreporting. Furthermore, a recent report36 described the importance of classifying individuals with prediabetes based on their diagnosis criteria since this heterogeneity is crucial for their treatment response. In our study, we included individuals with any prediabetes diagnostic criteria to maximize our power, and our results might be limited by not accounting for this heterogeneity. Further studies, which consider these limitations, and longer follow-ups to measure outcomes associated with T2D incidence are recommended.
Conclusions
The evidence from this study suggests that changes in three metabolites, N-acetyl-D-galactosamine, putrescine, and 7-methylguanine, were significantly associated with regression to normoglycemia independent of other treatment factors such as HbA1c at baseline and weight loss. In addition, our results show that increased protein consumption could positively impact the treatment of individuals with prediabetes. The findings of this study have several practical implications for treating individuals at high risk of T2D.
Data availability statement
Data are available on reasonable request.
Ethics statements
Patient consent for publication
Ethics approval
This study was approved by the Insituto Nacional de Ciencias Medicas y Nutricion Salvador Zubiran ethics committee (ID 2208) and was conducted according to the principles of the Declaration of Helsinki. All individuals provided written informed consent.
Acknowledgments
The authors express their gratitude to the study subjects and the investigators that have made significant contributions to the work: Pedro Cisneros-Guzman, Fernanda Garibay-Gutierrez, Laura Lazaro-Carrera, and Elvia Santoyo-Ainslie. And the investigators from the Department of Endocrinology and Metabolism (Luz Elizabeth Guillen Pineda and Carmen Moreno) of the Instituto Nacional de Ciencias Médicas y Nutrición Salvador Zubirán.
References
Supplementary materials
Supplementary Data
This web only file has been produced by the BMJ Publishing Group from an electronic file supplied by the author(s) and has not been edited for content.
Footnotes
Twitter @magdasevilla22
Contributors CAA-S and MdRS-G designed research, and MdRS-G, AD, and CBC conducted research. MdRS-G performed the statistical analysis, and MdRS-G, KEW, and AKM wrote the paper. MdRS-G is the guarantor of this work and, as such, had full access to all the data in the study and takes responsibility for the integrity of the data and the accuracy of the data analysis. All authors read and approved the final manuscript.
Funding The project was supported by a grant from the 'Consejo Nacional de Ciencia y Tecnología (CONACyT)' (S0008-2009-1-115250)
Competing interests None declared.
Provenance and peer review Not commissioned; externally peer reviewed.
Supplemental material This content has been supplied by the author(s). It has not been vetted by BMJ Publishing Group Limited (BMJ) and may not have been peer-reviewed. Any opinions or recommendations discussed are solely those of the author(s) and are not endorsed by BMJ. BMJ disclaims all liability and responsibility arising from any reliance placed on the content. Where the content includes any translated material, BMJ does not warrant the accuracy and reliability of the translations (including but not limited to local regulations, clinical guidelines, terminology, drug names and drug dosages), and is not responsible for any error and/or omissions arising from translation and adaptation or otherwise.