Article Text

Abstract
Introduction We aimed to investigate ethnic differences in two urinary inflammatory markers in participants with type 2 diabetes mellitus (T2DM).
Research design and methods We included 55 Dutch, 127 South-Asian Surinamese, 92 African Surinamese, 62 Ghanaian, 74 Turkish and 88 Moroccan origin participants with T2DM from the HEalthy LIfe in an Urban Setting study. Using linear regression analyses, we investigated differences in urinary monocyte chemoattractant protein-1 (MCP-1) and heparanase-1 (HPSE-1) levels across ethnic minorities compared with Dutch. Associations between the urinary markers and albuminuria (albumin:creatinine ratio (ACR)) was investigated per ethnicity.
Results Urinary MCP-1 levels were higher in the Moroccan participants (0.15 log ng/mmol, 95% CI 0.05 to 0.26) compared with Dutch after multiple adjustments. Urinary HPSE-1 levels were lower in the African Surinamese and Ghanaian participants compared with the Dutch, with a difference of −0.16 log mU/mmol (95% CI −0.29 to −0.02) in African Surinamese and −0.16 log mU/mmol (95% CI −0.31 to −0.00) in Ghanaian after multiple adjustments. In all ethnic groups except the Dutch and Ghanaian participants, MCP-1 was associated with ACR. This association remained strongest after multiple adjustment in South-Asian and African Surinamese participants, with an increase in log ACR of 1.03% (95% CI 0.58 to 1.47) and 1.23% (95% CI 0.52 to 1.94) if log MCP-1 increased 1%. Only in the Dutch participants, an association between HPSE-1 and ACR was found, with increase in log ACR of 0.40% (95% CI 0.04 to 0.76) if log HPSE-1 increased 1%.
Conclusions We found ethnic differences in urinary MCP-1 and HPSE-1 levels, in a multi-ethnic cohort of participants with T2DM. In addition, we found ethnic differences in the association of MCP-1 and HPSE-1 levels with albuminuria. These findings suggest differences in renal inflammation across ethnic groups.
- ethnicity
- MCP-1
- inflammation
- diabetes mellitus, type 2
Data availability statement
Data are available on reasonable request. Raw data were generated at the Amsterdam University Medical Center. Derived data supporting the findings of this study are available from the corresponding author AIMvdV on request.
This is an open access article distributed in accordance with the Creative Commons Attribution Non Commercial (CC BY-NC 4.0) license, which permits others to distribute, remix, adapt, build upon this work non-commercially, and license their derivative works on different terms, provided the original work is properly cited, appropriate credit is given, any changes made indicated, and the use is non-commercial. See: http://creativecommons.org/licenses/by-nc/4.0/.
Statistics from Altmetric.com
WHAT IS ALREADY KNOWN ON THIS TOPIC
There are major differences in the onset and progression of diabetic nephropathy across ethnic groups.
Inflammation plays an important role in the pathophysiology of diabetic nephropathy.
WHAT THIS STUDY ADDS
We found ethnic differences in urinary monocyte chemoattractant protein-1 and heparanase-1 levels in participants with type 2 diabetes mellitus, suggesting differences in renal inflammation across ethnic groups.
HOW THIS STUDY MIGHT AFFECT RESEARCH, PRACTICE OR POLICY
Differences in renal inflammation may explain the heterogeneity of diabetic nephropathy across ethnic groups and warrant further research.
Introduction
Over the years, our knowledge of underlying processes involved in the pathophysiology of diabetic nephropathy (DN) has evolved tremendously. Growing evidence indicates that inflammatory pathways play a central role in the development and progression of the disease.1 Elucidating important molecular and cellular pathways in the pathophysiology of DN is highly important, as this diabetic complication is one of the leading cause of end-stage renal disease (ESRD) worldwide.2
There are striking differences in the prevalence and progression of DN across various regions of the world and among different ethnic groups.3–5 Interestingly, these disease disparities still remain even after migration to other continents. In ethnic minority groups of non-European descent, DN is more prevalent and progresses faster to ESRD.6 7 Patients with type 2 diabetes mellitus (T2DM) originally from South-Asian or African descent seem to be more prone to develop albuminuria,8–11 show a faster decline of kidney function9 12 and have a higher risk at developing ESRD compared with Caucasian patients with diabetes.13 14 These ethnic differences in disease phenotype have not been fully elucidated. However, variances in the degree of inflammation in the diabetic kidney may give insight in possible mechanisms to explain ethnic differences in DN phenotype.
The role of chronic low-grade inflammation in the multifactorial pathogenesis of DN has been widely accepted.1 Metabolic alterations, with the production of toxic metabolites (advanced glycation end products, free fatty acids and inflammatory cytokines), together with hemodynamic changes, provide a chronic low inflammatory environment in patients with T2DM. This inflammatory environment induces the activation of glomerular cells (endothelial cells, podocytes) and macrophages to express adhesion molecules and to produce pro-inflammatory metabolites, such as monocyte chemoattractant protein 1 (MCP-1), tumor necrosis factor-α (TNF-α) and heparanase-1 (HPSE-1). Chronic exposure to the diabetic stressors and inflammatory metabolites results in structural glomerular and tubular damage leading to albuminuria and eventually kidney function decline.1
Both MCP-1 and HPSE-1 are known as key players in the development and progression of the disease.15–18 HPSE-1 is a beta-glucuronidase that is capable of cleaving heparan sulfate in the glomerular endothelial glycocalyx. The glycocalyx is an important carbohydrate-rich layer that covers the luminal and abluminal side of fenestrated endothelium, where it acts as the first barrier in the glomerular filtration barrier. MCP-1 is a potent chemokine that regulates the renal influx of macrophages and activation of tissue resident macrophages. Several studies found that MCP-1 and HPSE-1 are released in renal tissue and urine of patients with DN, correlating with the degree of albuminuria and kidney function.19–25 These urinary markers may give insight in the degree of inflammation in the diabetic kidney.
We sought to investigate differences in urinary levels of MCP-1 and HPSE-1 in a multi-ethnic cohort of patients with T2DM living in Amsterdam, the Netherlands. In addition, the association between urinary inflammatory markers and the albumin:creatinine ratio (ACR) may differ across populations of various ethnicity, for instance, due to differences in systemic low-grade inflammation.26 Therefore, we investigated the association between these urinary markers and the degree of albuminuria per ethnicity.
Research design and methods
Participants
For this study, baseline data and morning urine samples from participants from the HEalthy LIfe in an Urban Setting (HELIUS) study were used. The HELIUS study is a large multi-ethnic prospective cohort study conducted in Amsterdam, the Netherlands. Between 2011 and 2015, the study included people of Turkish, Moroccan, South-Asian Surinamese, African Surinamese, Ghanaian and Dutch origin between 18 and 70 years old. Inclusion and exclusion criteria for the HELIUS study together with detailed study design and methods is described elsewhere.27
Participants were asked to bring a morning urine sample the day of the physical examination on the baseline visit. Creatinine and albumin were determined directly at the Clinical Chemistry Laboratory of the AMC. Remainder urine samples were stored at −80°C.
The country of birth of the participants as well as that of his/her parents, both obtained from the municipal registry, was defining for the participant’s ethnicity. If the participant was born abroad and has at least one parent born abroad (first generation), or was born in the Netherlands but both parents were born abroad (second generation), the participant was considered of non-Dutch ethnic origin. After data collection, participants from Surinamese ethnic origin were classified into ‘African Surinamese’ or ‘South-Asian Surinamese’ according to self-reported ethnic origin. The Dutch participants had to be born in the Netherlands and their parents also had to be born in the Netherlands to be considered as of Dutch ethnic origin.
For the present study, data from a subsample of participants with T2DM within the HELIUS study were included. Participants were considered to have diabetes if the measured fasting blood glucose level was ≥7.0 mmol/L and/or a measured hemoglobin A1c (HbA1c) level of ≥6.5% (48 mmol/mol), and/or antidiabetic medication was used, and/or a self-reported physician diagnosis of diabetes mellitus. Within this selection, the participants with diabetes were divided into normo-albuminuria (ACR <3 mg/mmol), micro-albuminuria (ACR 3–30 mg/mmol) and macro-albuminuria (ACR >30 mg/mmol) groups based on the ACR in the morning urine sample, with a maximum of 50 participants with normo-albuminuria per group. This maximum was set to prevent a too large sample size of patients with normo-albuminuria. Exclusion criteria were the use of low-molecular weight heparin, as this can interfere with heparanase production.28 Eventually, 127 South-Asian Surinamese, 92 African Surinamese, 55 Dutch, 62 Ghanaian, 74 Turkish and 88 Moroccan participants with T2DM were included in this study.
Urinary MCP-1 concentration and HPSE-1 activity
Stored morning urine samples of the participants were obtained to determine MCP-1 and HPSE-1 activity in the LUMC. Urinary MCP-1 concentration was measured with a commercially available immunoassay (R&D Systems Europe, Abingdon, UK). Urinary samples were diluted 1:10 with Calibrator Diluent, added to a polystyrene microplate coated with a monoclonal antibody specific for human MCP-1 and incubated for 2 hours at room temperature. The wells were washed with washing buffer consisting of phosphate-buffered saline (PBS) containing 0.1% Tween 20. Then, the human MCP-1 conjugate was added to incubate for 1 hour at room temperature. After washing the plate, a mix of hydrogen peroxide and tetramethylbenzidine was added to start the peroxidase reaction. The reaction was stopped after 20 min by adding 2N sulfuric acid and the absorbance was measured at 450 nm with a microplate reader. MCP-1 activity was determined according to a recombinant human MCP-1 standard and corrected for urinary creatinine concentration.
Urinary HPSE-1 activity was measured with a commercially available ELISA assay (Takara Bio, Shiga, Japan). Urine samples were first run through Zeba Spin Desalting Columns (ThermoFisher, Waltham, Massachusetts, USA) for removal of salts and other small molecules (<1000 MW). Then, urine samples were diluted 1:1 with reaction buffer and added to 55 μL of dissolved biotinylated Heparan Sulfate. After 120 min incubation at 37°C, the reactants were transferred to a well coated with cell-binding domain of fi broblast growth factor (CBD-FGF), an HS-binding protein. During the 15 min incubation at 37°C, non-degraded HS substrates bound to the CBD-FGF in the wells. The plate was washed with washing buffer consisting of PBS containing 0.1% Tween 20. After that, avidin phenacetin O-de-ethylase (POD) conjugate was added to each well and incubated for 45 min at 37°C. The plate was washed again and the POD substrate was added to start the peroxidase reaction at room temperature. The reaction was stopped by adding 2 M sulfuric acid and the absorbance was measured at 450 nm with a microplate reader. Heparanase activity was determined according to the provided HS standard and corrected for urinary creatinine concentration.
Additional variables
A history of cardiovascular disease (CVD) was determined with the questions if the person ever had a heart attack, stroke or a catheter intervention on heart or legs. Prevalent CVD was defined as having experienced one of the above conditions. Educational level was based on the highest qualification gained either in the Netherlands or in the country of origin: (1) never been to school or elementary schooling (non-elementary or elementary), (2) lower vocational schooling or lower secondary schooling (lower secondary), (3) intermediate vocational schooling or intermediate/higher secondary education schooling (higher secondary), (4) higher vocational schooling or university (tertiary education). Current smoking was self-reported. Medication use was identified using the ACT classification system. Estimated glomerular filtration rate (eGFR) was calculated using the 2021 Chronic Kidney Disease Epidemiology Collaboration (CKD-EPI) creatinine equation, without race coefficient.29 Blood pressure was measured twice after 5 min of rest with a validated automated sphygmomanometer, the mean of the two measurements was used. Hypertension was defined as a systolic blood pressure ≥140 mm Hg or a diastolic blood pressure ≥90 mm Hg. Body mass index (BMI) was calculated as weight (kg) divided by height squared (m2). Fasting blood samples were drawn at the morning of the study visit.
Statistical analysis
The study population was stratified by ethnicity. Continuous variables with normal distribution are presented as mean with SD and non-parametric variables by median with IQR. Categorical data are expressed as proportions. Descriptive statistical analyses were carried out on the characteristics of the participants. Normal distributions of the variables were tested with histograms. For comparison of means across the ethnicities, the parametric Welch’s analysis of variance for unequal variances with Games Howell post hoc test was used. The Welch’s tests were used as the sample sizes of the groups were unequal. Differences were considered statistically significant if p<0.05. For comparison of skewed distributed variables across the ethnicities, the non-parametric Kruskal-Wallis test was used followed by the Mann-Whitney U test, the significance level was corrected according to the Bonferroni correction (α/number of test). Categorical data were compared using the χ2 test with post hoc test with Bonferroni correction.
To investigate the association of ethnicity with urinary MCP-1 levels and HPSE-1 activity, linear regression analyses was used. Because of skewed distributions, urinary MCP-1 and HPSE-1 activity levels were log-transformed before the analysis to achieve normal distribution (of residuals). Due to the occurrence of HPSE-1 levels of 0 mU/mmol, a constant of 0.001 was added prior to transformation, therefore, no back-transformation of HPSE could be performed. Ethnicity was used as independent variable with the Dutch ethnicity as reference group. Multivariable models were constructed. Model 1 was adjusted for age and sex. Model 2 was used to adjust for variables that affect inflammation which additionally included duration of diabetes in years, BMI, hypertension, current smoking, HbA1c and total cholesterol levels. In model 3, the eGFR (2021 CKD-EPI) and ACR were included as continuous variables to investigate if the differences were mediated by these variables. Model 4 additionally included the use of renin-angiotensin-aldosterone system (RAAS) inhibitors, as this can influence MCP-1 and HPSE-1 levels in the urine.30–32
Subsequently, we examined the association of the urinary markers MCP-1 levels and HPSE-1 activity with ACR, stratified by ethnicity. To achieve normal distribution (of residuals), ACR was log-transformed before the analysis. We adjusted for known determinants for the ACR such as age, sex, BMI, hypertension, smoking, HbA1c, cholesterol, kidney function and the use of RAAS inhibitors. We also tested formally for interaction between MCP-1 or HPSE-1 and ethnicity by adding a multiplicative interaction term to the fully adjusted model.
Associations were considered statistically significant if p<0.05. Statistical analysis was performed using SPSS statistical software V.25 (SPSS, Chicago, Illinois, USA) and GraphPad Prism V.8 (GraphPad, La Jolla, California, USA).
Results
Characteristics of the study population
Table 1 shows the baseline characteristics of the study population by ethnicity. In total, 55 Dutch, 127 South-Asian Surinamese, 92 African Surinamese, 62 Ghanaian, 74 Turkish and 88 Moroccan participants with T2DM were included in this study. In concordance with earlier HELIUS publications, baseline differences between the ethnic groups could be detected. The Dutch participants were significantly older compared with the other ethnic minorities, but the age of diabetes onset did not differ across the ethnic groups. Ghanaian and Moroccan participants were less likely to be smokers as compared with the other ethnic groups. The South-Asian Surinamese group had more participants with prevalent CVD compared with the Moroccan participants (29.1% compared with 10.2%). In addition, Moroccan participants were less likely to have hypertension, 35% in the Moroccan group compared with >50% of the participants in the other ethnic groups. Average BMI was significantly higher in the Ghanaian participants compared with the Dutch and South-Asian Surinamese groups, with respectively an average of 33.2 kg/m2 in the Ghanaian group compared with 29.7 kg/m2 and 30.1 kg/m2. HbA1c levels appeared to be lowest in the Dutch group, with an average of 6.9% (51.9 mmol/mol). Urinary creatinine levels did not significantly differ across the ethnic groups except for a higher median urinary creatinine level in the Moroccan group (9.4 mmol/L, IQR 6.9–13.5) compared with the Ghanaian group (7.1 mmol/L, IQR 4.8–11.1). The number of participants with normo-albuminuria, micro-albuminuria and macro-albuminuria was not equally distributed among the ethnicities. This is in concordance with literature as South-Asian Surinamese and African Surinamese individuals with T2DM had a higher prevalence of albuminuria.10 11 As a consequence, median albuminuria levels were highest in the South-Asian Surinamese group compared with the other ethnic groups. In addition, the South-Asian Surinamese and African Surinamese had a lower eGFR compared with the other ethnic groups, suggesting a more advanced stage of DN in these participants.
Characteristics of the participants with type 2 diabetes mellitus stratified by ethnicity
Ethnic differences in urinary MCP-1 levels and HPSE-1 activity
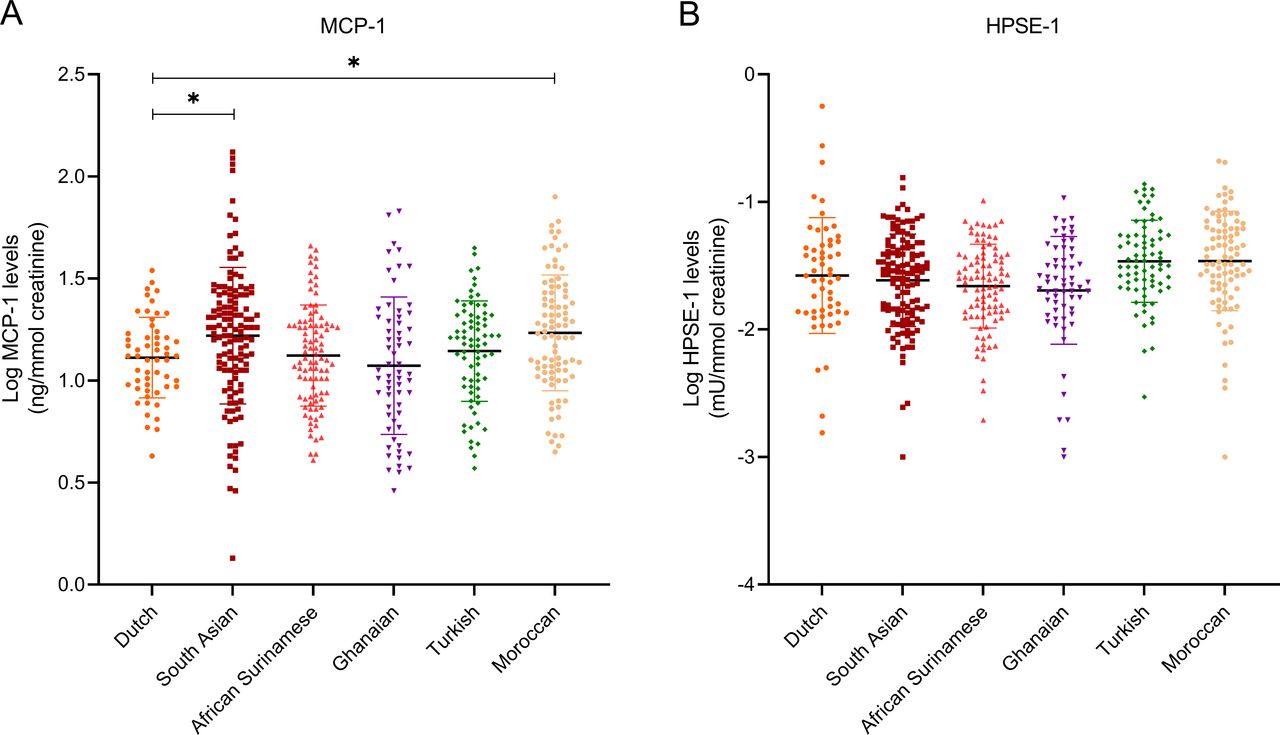
Urinary MCP-1 concentrations and HPSE activity levels were corrected for urinary creatinine levels and log transformed due to their skewed distributions. Urinary MCP-1 could be detected in every participant. Comparing urinary MCP-1 levels in the ethnic groups with the Dutch participants revealed that in South-Asian Surinamese and Moroccan participants, MCP-1 levels were significantly higher with a difference of 0.11 log ng/mmol in the South-Asian Surinamese (95% CI 0.02 to 0.20) and 0.12 log ng/mmol (95% CI 0.03 to 0.22) in the Moroccan group, respectively, compared with the Dutch group (figure 1A and table 2). Without an effect of adjusting for age and sex (model 1, table 2) only after adjusting for age, sex, duration of diabetes, BMI, HbA1c, total cholesterol, smoking and hypertension (model 2, table 2), differences in MCP-1 levels compared with Dutch participants slightly increased in the Moroccan group (difference of 0.16 log ng/mmol 95% CI 0.05 to 0.27) with minimal effects in the South-Asian Surinamese group (difference of 0.11 log ng/mmol 95% CI 0.01 to 0.21). However, after additional adjusting for kidney function (2021 CKD-EPI) and ACR (model 3, table 2), only Moroccan participants with diabetes still revealed a significant higher MCP-1 level compared with Dutch participants, with a difference of 0.15 log ng/mmol (95% CI 0.05 to 0.26). Instead, adjusting for eGFR and ACR normalized urinary MCP-1 levels in the South-Asian Surinamese group (difference of 0.04 log ng/mmol 95% CI −0.06 to 0.14). The differences compared with the Dutch participants remained similar when additionally adjusting for the use of RAAS inhibitors in model 4 (table 2).

Ethnic differences in urinary monocyte chemoattractant protein-1 (MCP-1) and heparanase (HPSE-1) levels. (A) Log urinary MCP-1 levels per ethnic group. (B) Log urinary HPSE-1 levels per ethnic group. Linear regression with Dutch as the reference group, *p<0.05.
Ethnic differences in urinary MCP-1 and HPSE-1 levels
In all participants, low urinary HPSE-1 activity was observed, of which in several patients, no HPSE-1 activity could be detected at all. HPSE-1 levels revealed to be non-significant elevated in the Turkish and Moroccan participants compared with the Dutch, and significantly lower in the African Surinamese and Ghanaian participants (figure 1B). After adjusting for age, sex, duration of diabetes, BMI, smoking, HbA1c, total cholesterol, hypertension, eGFR, ACR and the use of RAAS inhibitors (model 1–4, table 2), HPSE-1 levels were 0.16 mU/mmol (95% CI 0.02 to 0.29) lower in the African Surinamese participants and 0.16 mU/mmol (95% CI 0.00 to 0.31) lower in the Ghanian participants compared with Dutch participants.
Association of urinary MCP-1 levels and HPSE-1 activity with albuminuria
Table 3 shows the association of urinary MCP-1 concentration and HPSE-1 activity with the degree of albuminuria stratified by ethnicity. Linear regression analyses revealed that in the South-Asian and African Surinamese participants the association between urinary MCP-1 levels and ACR was stronger compared with the other ethnic groups and Dutch participants. For every 1% increase in log MCP-1, log ACR increased with about 1.40% in the South-Asian Surinamese participants (95% CI 0.94 to 1.86) in the unadjusted model. In Moroccan participants, every 1% increase in log MCP-1 is accompanied by a 0.70% increase in log ACR (95% CI 0.26 to 1.15). In contrast, no association between log MCP-1 and log ACR was seen in the Dutch and Ghanian participants. After adjusting for known risk factors for albuminuria, eGFR and the use of RAAS inhibitors (model 4), weaker but still significant associations between log MCP-1 and log ACR were seen in all ethnic groups except for the Dutch and Ghanaian.
Associations between urinary MCP-1 or HPSE-1 levels and albumin:creatinine ratio stratified by ethnicity
Notably, only in the Dutch participants, an association with log HPSE-1 activity and log ACR levels was found, with around 0.42% increase in log ACR for every 1% increase in log HPSE-1 (95% CI 0.10 to 0.74) in the unadjusted model. This association became less strong (but still significant) after adjustment for age, sex, known risk factors for albuminuria, eGFR and the use of RAAS inhibitor (model 4). In the other ethnic groups, no significant association between log HPSE-1 activity and log ACR levels were observed.
However, the formal test for interaction provided no evidence for a differential association for both urinary markers across ethnic groups.
Discussion
In this multi-ethnic cohort study of participants with T2DM, we found ethnic differences in urinary MCP-1 and HPSE-1 levels. The Moroccan participants had significantly higher urinary MCP-1 levels compared with the Dutch participants. This difference could not be explained by differences in age, sex, factors that may influence inflammation (ie, duration of diabetes, BMI, smoking, hypertension, HbA1c and total cholesterol levels) or kidney function, degree of albuminuria or RAAS inhibition. In South-Asian Surinamese participants, significant higher urinary MCP-1 levels compared with the Dutch group were seen after correcting for confounders that influence inflammation (ie, age, sex, BMI, smoking, hypertension, HbA1c and total cholesterol levels). However, adjusting for eGFR and ACR attenuated this difference, suggesting that MCP-1 levels are partly elevated due to a higher degree of albuminuria and decreased renal function between these groups. In contrast, lower urinary HPSE-1 activity were found in the African Surinamese and Ghanian participants compared with the Dutch participants. These differences could not be explained by differences in age, sex, factors that may influence inflammation (ie, duration of diabetes, BMI, smoking, hypertension, HbA1c and total cholesterol levels), kidney function, degree of albuminuria or the use of RAAS inhibition.
Several studies report that higher levels of certain systemic and urinary inflammatory biomarkers such as MCP-1, TNF-α, vascular cell adhesion molecule 1 (VCAM-1) or urinary Intercellular adhesion molecule 1 (ICAM-1) are associated with kidney function or albuminuria in patients with diabetes and a specific ethnic background, such as African-Americans33 34 or Asians.35 We found that in all ethnic minority groups studied, a higher urinary MCP-1 level was associated with a higher level of albuminuria. These associations were still apparent after adjustment for factors that may influence albuminuria (ie, age, sex, BMI, smoking, hypertension, HbA1c, total cholesterol levels, kidney function and the use of RAAS inhibitors). To this, we found strongest associations in African Surinamese and South-Asian Surinamese, and Turkish participants which could suggest that renal inflammation may contribute to the development of albuminuria in these ethnic groups. Similar to our results, several studies showed positive correlations with urinary MCP-1 activity and degree of albuminuria in patients with diabetes.20 22 23 Using a larger participant cohort in a recent post hoc analysis of the ROADMAP (Randomized Olmesartan and Diabetes Microalbuminuria Prevention) study revealed that even despite very high variations in outcome, serum and urinary MCP-1 levels were significant predictors of the onset of albuminuria in patients with diabetes.36
Only in the Dutch participants, a positive association was found between urinary HPSE-1 activity and albuminuria levels. Several studies found increased HPSE-1 activity levels in patients with diabetes24 25 but only one study found a correlation between urinary HPSE-1 activity and the degree of albuminuria.19 Urinary HPSE-1 activity appeared to be low in all participants. It is known that active heparanase has an important role in the cleavage of heparan sulfate in the glomerulus, contributing to the development of albuminuria.19 37 However, it is not known how much of this activity is still detectable in the urine. It is possible that heparanase is bound to heparan sulfates shed by other renal or bladder cells, as every cell in the urinary tract expresses heparan sulfates. This may give an underestimation of the amount of active heparanase in urine with the currently available ELISA kits that uses an indirect method to detect HPSE-1 activity. Therefore, a new test to detect active HPSE-1 and inactive proHPSE-1 directly in urine is needed in future research.38 39
We corrected urinary MCP-1 and HPSE-1 levels for urinary creatinine levels to correct for variations in urine concentration and flow rate. However, it is known that urinary creatinine levels may vary across ethnic groups due to differences in muscle mass. Therefore, major differences in urinary creatinine levels may influence the levels of MCP-1 and HPSE-1. We, however, found no major differences in urinary creatinine levels across the ethnic groups.
The attenuation of the difference in urinary MCP-1 levels in South-Asian Surinamese compared with the Dutch after adjusting for eGFR and ACR could be related to the possible negative correlation between eGFR and urinary MCP-1 levels in South-Asian individuals with T2DM. This negative correlation with kidney function has already been found for serum MCP-1 levels,34 40 attenuating the positive association between ethnicity and MCP-1.
The strength of our study is the representation of six large ethnic groups based in Amsterdam with participants between 18 and 70 years of age making it possible to early on detect possible disease-related risk factors. Our study also has several limitations. Due to the cross-sectional nature of the study, no conclusions on causal relations between urinary MCP-1 or HPSE-1 levels and progression of albuminuria can be drawn. As no renal biopsy material was collected in the HELIUS study, no correlations with local glomerular expression of the inflammatory markers could be investigated. Due to the low number of patients with micro-albuminuria and macro-albuminuria in the Dutch and Ghanaian groups, those groups may be underpowered to show an effect or association. In addition, high variability of the urinary MCP-1 (as also shown earlier36) within the ethnic groups prevents for further stratification in quartiles to assess a more robust association with the occurrence of micro-albuminuria and macro-albuminuria. The ACR was used based on a single urine sample. A 24-hour urine collection may give a more accurate estimation of the ACR than a single urine sample. However, several studies showed that in patients with diabetes, a morning urine sample correlates well with the 24-hour urine collection.41 42
It can be discussed that the urinary levels of MCP-1 and HPSE-1 activity may not reflect local inflammation in the kidney. Although the nature of the HELIUS study ruled out collection of renal biopsy material, it has been confirmed previously that urinary MCP-1 levels were elevated in accordance with the progression of diabetic glomerular lesions.43 44 For HPSE-1 activity, increased local glomerular and tubular HPSE-1 expression has been found in patients with T2DM, however, without a direct correlation between histological findings and urinary HPSE-1 activity levels.19 37 It therefore needs to be established whether urinary HPSE-1 activity levels will reflect renal perturbation in early diabetes-related disease progression. An interesting approach to study the ethnic differences in developing DN would be in dissecting possible genetic predispositions and epigenetic modifications, although a recent study within the HELIUS cohort revealed the specific admixed genetic variability within the three mayor Surinamese ethnic groups (besides the Africans and South Asians also the Java Surinamese) increasing the complexity of determining such modifications at a global ethnic level.45
To our knowledge, no prior studies have studied the difference in these urinary markers between ethnic groups to give more insight in differences in the degree of inflammation in the diabetic kidney. It is known that the pathogenesis of DN is a multifactorial pathway where inflammation appears to be a relevant contributor to its development. Ethnic differences in urinary inflammatory markers can be of interest and may explain the heterogeneity in DN across ethnic groups. In addition, it could indicate that some ethnic groups may respond well to targeted anti-inflammatory therapy whereas other ethnic groups may experience less therapeutic response. MCP-1 and HPSE-1 are known as in important promotors of inflammation, however, the meaning of differences in urinary MCP-1 and HPSE-1 levels found in our study has yet to be determined. It would be interesting to investigate other inflammatory markers across ethnic groups and relate these findings to DN markers.
In the present study, we found ethnic differences in urinary MCP-1 and HPSE-1 levels, in a multi-ethnic cohort of participants with T2DM. In addition, we found ethnic differences in the association of urinary MCP-1 and HPSE-1 levels with the degree of albuminuria. This suggests that the contribution of renal inflammation in the pathogenesis of DN may vary between ethnic groups.
Data availability statement
Data are available on reasonable request. Raw data were generated at the Amsterdam University Medical Center. Derived data supporting the findings of this study are available from the corresponding author AIMvdV on request.
Ethics statements
Patient consent for publication
Ethics approval
The study protocols were approved by the Academic Medical Center Ethical Review Board (protocol ID NL32251.018.10, approval number 10/100# 10.17.1729), and all participants provided written informed consent.
Acknowledgments
We are grateful to the participants of the HELIUS study and the management team, research nurses, interviewers, research assistants and other staff who have taken part in gathering of this study. We also gratefully acknowledge Sandra W van der Kooy (Division of Nephrology, Department of Internal Medicine & Einthoven Laboratory of Vascular and Regenerative Medicine, Leiden University Medical Center, Leiden, The Netherlands) for technical assistance.
References
Footnotes
Contributors AIMvdV and DHTI designed the analysis plan. AIMvdV carried out the statistical analyses. AIMvdV, DHTI, BMvdB and HG drafted and revised the manuscript. AIMvdV, BMvdB, DHTI, BJvdB, HG and TJR read and approved the final manuscript. TJR is responsible for the overall content as guarantor. The results presented in this paper have not been published previously in whole or part, except in abstract form.
Funding The HELIUS study is conducted by the Amsterdam University Medical Center and the Public Health Service of Amsterdam. The HELIUS study is supported by the Dutch Heart Foundation (2010T084), the Netherlands Organization for Health Research and Development (ZonMw:200500003), the European Union (FP-7: 278901) and the European Fund for the Integration of non-EU immigrants (EIF: 2013EIF013).
Competing interests None declared.
Provenance and peer review Not commissioned; externally peer reviewed.