Article Text

Abstract
Introduction Insights into ethnic differences in the natural history of chronic kidney disease (CKD) among people with type 2 diabetes mellitus (T2DM) might inform clinical strategies to address disparities in hospitalization and mortality. Risks of CKD II–V stages over a 25-year period between New Zealand Europeans (NZEs), Māori and Pasifika, and with T2DM in Auckland, New Zealand (NZ) were compared.
Research design and methods As a primary care audit program in Auckland, the Diabetes Care Support Service was linked with national registration databases. People with existing CKD II–V were ruled out. To balance potential confounders, we applied a tapered matching method . ‘Quasi-trial’-matched cohorts were set up separately between Māori and NZE and between Pasifika and NZE. Ethnic population differences in risk of any and each stage of CKD over 1994–2018 were examined by weighted Cox regression model.
Results The HRs for developing any CKD, CKD stages II–V for Māori (n=2215) versus NZE (n=2028) were 1.18 (95% CI 0.99 to 1.41), 1.10 (95% CI 0.91 to 1.32), 1.70 (95% CI 1.19 to 2.43), 3.93 (95% CI 2.16 to 7.14), and 3.74 (95% CI 1.74 to 8.05), respectively. Compared with NZE (n=2474), the HRs for developing any CKD, CKD stages II–V for Pasifika (n=3101) were 1.31 (95% CI 1.09 to 1.57), 1.26 (95% CI 1.05 to 1.52), 1.71 (95% CI 1.14 to 2.57), 3.75 (95% CI 1.40 to 10.05), and 4.96 (95% CI 1.56 to 15.75), respectively.
Conclusions Among people with T2DM in NZ, significant ethnic differences exist in the risk of progressing to each stage of CKD (stage V in particular). Mechanism studies underlying these differences, as well as the need for identification of biomarkers to predict the early onset renal lesion, are warranted.
- Type 2 Diabetes
- Ethnic Groups
- Kidney Failure, Chronic
- Cohort Studies
Data availability statement
The datasets analysed in the current study are not publicly available because of agreements with the primary care organisations and the Ministry of Health, which provided the data.
This is an open access article distributed in accordance with the Creative Commons Attribution Non Commercial (CC BY-NC 4.0) license, which permits others to distribute, remix, adapt, build upon this work non-commercially, and license their derivative works on different terms, provided the original work is properly cited, appropriate credit is given, any changes made indicated, and the use is non-commercial. See: http://creativecommons.org/licenses/by-nc/4.0/.
Statistics from Altmetric.com
WHAT IS ALREADY KNOWN ON THIS TOPIC
An increased risk of chronic kidney diseases (CKDs) is associated with type 2 diabetes mellitus (T2DM).
Few studies have reported risks of each stage of CKD over long follow-up in the last two decades among Māori, Pasifika, and New Zealand Europeans (NZEs) with T2DM.
Few studies have formed ‘quasi-trial’ comparative cohorts to test the aforementioned differences using a novel tapered matching method.
WHAT THIS STUDY ADDS
Via a novel quasi-trial matching method to reduce model dependence, tapered matching method that transparently balanced potential confounders, we formed comparable cohorts for NZE versus Māori and NZE versus Pasifika with T2DM.
Over a 25-year period, significantly higher risks of each stage of CKD II–V among Māori and Pasifika with T2DM, despite matching for possible confounders.
HOW THIS STUDY MIGHT AFFECT RESEARCH, PRACTICE OR POLICY
These data emphasize the need to consider tailored CKD preventative and screening activities among people with T2DM of Māori/Pasifika ethnicity (who will have already received lifestyle advice).
Mechanism studies underlying these differences, as well as the need for identification of biomarkers to predict the early onset renal lesion, are needed.
Introduction
Type 2 diabetes mellitus (T2DM) has attained epidemic proportions in New Zealand (NZ) and is associated with a range of diabetes complications including diabetic kidney disease (DKD), a primary cause of end-stage renal disease (ESRD).1 In NZ, marked ethnic variation in the risk of ESRD exists among those with and without T2DM.2 Among those with T2DM, Māori and Pasifika experience more renal disease than New Zealand Europeans (NZEs), which is associated with more hospitalization, premature mortality,3 and renal replacement therapy.4 5 Māori are 13-fold of risks to die from nephropathy than NZE.6
The natural history of diabetes-related kidney disease in Māori and Pasifika would appear to differ from NZE.7 Microalbuminuria is often present prior to the diagnosis of T2DM, in those with normoglycemia as well as in those with impaired glucose tolerance.8 Microalbuminuria or macroalbuminuria are also more prevalent in Māori and Pasifika than in NZEs with T2DM. In one study of 65 171 patients with T2DM, 50% of Māori and 49% of Pasifika but only 28% of NZE had incipient or greater albuminuria.1 9 The cause for these ethnic differences remains unclear. The increased rates of renal-related hospitalization are present even after adjusting for diabetes duration, age, gender, socioeconomic status (SES), smoking and obesity.3 Higher blood pressure (BP) is unlikely to explain the higher rates either as NZEs have a higher BP than Māori and Pasifika among those with T2DM.10 Greater hyperglycemia10 is unlikely to be the sole explanation for this higher risk in view of the presence of ethnic differences before T2DM is present.
Curiously, although the incidence of chronic kidney disease (CKD) in the population with T2DM varies between countries (eg, the 5-year cumulative incidence of developing CKD stage II and over was 22.6% in Australia11 but 10.6% in Ethiopia12), it is currently unknown whether there are ethnic differences in the nature and/or incidence rate of developing each stage of CKD, a pivotal issue in designing intervention studies to prevent progression of diabetes-related renal disease.
To address this question, we have investigated ethnic differences (Māori vs NZE and Pasifika vs NZE) in the risk of progressing to each stage of CKD among people with T2DM and initial estimated glomerular filtration rate (eGFR) of ≥90 mL/min/1.73 m2 in NZ between 1994 and 2018, via a novel tampered matching method to establish ‘quasi-trial’ comparative cohorts.
Methods
Data source and study population
To audit diabetes management among all patients from volunteer general practices in East, West, and South Auckland in order to improve standards of care, the Diabetes Care Support Service (DCSS) was established as a pilot in 1991.13 From 1994, the DCSS was fully funded with the close of enrollment in 2018 (last enrollment July 31, 2018). The DCSS database was linked with databases from the Ministry of Health covering primary care, national death registration database, national hospital admission database, national pharmaceutical claim database, and national SES database. Patients’ linked, deidentified DCSS data covering demographics, diabetes clinical measurements (including smoking status, duration of having diabetes, body mass index (BMI), BP, glycated haemoglobin, and lipid profiles) and diabetes treatments (antidiabetes, antihypertensive, lipid-lowering treatment, antiplatelet and/or anticoagulant treatment) were extracted. These collected data have been validated through enumeration assessment and internal quality control policies with auditors regularly cross checking, routine and random sampling/checking of data entry, and active data management (eg, checking unusual numbers, queries, ranking of columns, and duplicates).13–15
The cohort incorporated patients aged 18 years and over with T2DM. T2DM in the DCSS database was defined by coding of primary care electronic medical records, with validation undertaken by trained diabetes auditors. Those with an initial eGFR of <90 mL/min/1.73 m2 were excluded. Urinary albumin:creatinine ratio (UACR) data were not used to define CKD. The enrollment date was the date of entry into the DCSS database. Patients were categorized into exposure groups by patients’ ethnicity (NZE, Māori, and Pasifika). Māori (indigenous Polynesian) were defined as patients that self-identified as having Māori ancestry. Pasifika (93% Polynesian) were defined as patients who self-identified as Samoan, Tongan, Fijian, Niuean, or other Pacific ethnicities. The focal cohort in the current study was Māori and Pasifika patients; the matched control cohort was drawn from NZE as the study aim is to understand disparities in renal outcomes between focal and matched control cohorts.
The area deprivation measurement, NZDep2013, was used to define patients’ SES. NZDep2013 derives a score of Index of Multiple Deprivation (IMD) for each NZ meshblock (local geographical unit incorporating a median of 81 people).16 The NZDep2013 scale of deprivation ranges from 1 to 10, divides NZ into 10ths of the distribution of the first principal component scores,16 and is consistent with prior deprivation measures. To maintain the statistical power, the IMD was redefined by recategorizing NZDep2013 into five groups: IMD-1 (least deprived: NZDep2013 1–2), IMD-2–IMD-4 (NZDep2013 3–4, 5–6, 7–8, respectively) and IMD-5 (most deprived NZDep2013 9–10).
Outcomes
Outcomes were defined as developing any stage of CKD including II, III, IV, and V (incorporating those accepting renal replacement therapy, ie, dialysis) and any incident CKD (stages II–V). Incident outcomes were defined as the first coded outcome in any of the linked databases. Risks of any CKD and each stage of CKD (II–V) were modeled separately.
Participants were excluded if they had their incident outcome within 1 year since their enrollment time to avoid the potential information bias. Participants were followed up from their enrollment time until they experienced an incident outcome of interest or death or by December 31, 2019 without experiencing any outcome of interest. All incident clinical events were the earliest records defined either by (1) clinical routine records in primary care settings defined by eGFR based on ADA guidelines17 or (2) clinical events recorded in the NZ nationally linked databases and defined both by International Statistical Classification of Diseases and Related Health Problems, 10th Revision and the primary International Classification of Diseases (ICD), 9th Revision codes.
Statistical analysis
Entropy balancing, the most popular tapered matching method,18 19 was used to incrementally match the control cohort (NZE) to the focal cohorts (Māori and Pasifika) with additional covariates. This allowed direct observation of how each matched cohort changed in terms of HR and in terms of unmatched covariates.
To reduce model dependence20 and the potential for irresolvable imbalances between comparative cohorts before tapered matching, coarsened exact matching (CEM) was used to restrict the comparison of patients in comparative cohorts to common support areas, that is, sufficient overlap between comparative cohorts, on key confounders (matching variables) over 11 matching steps (online supplemental figures S1 and S2). The CEM algorithm that is a monotonic imbalance reducing matching method, which indicates the balance between comparison groups is chosen by ex-ante user choice, rather than identified through the common laborious process of ‘checking after the fact, tweaking the method, and repeatedly re-estimating’.21 Patients in comparison groups matched on the 11th step remained (online supplemental figures S1 and S2).
Supplemental material

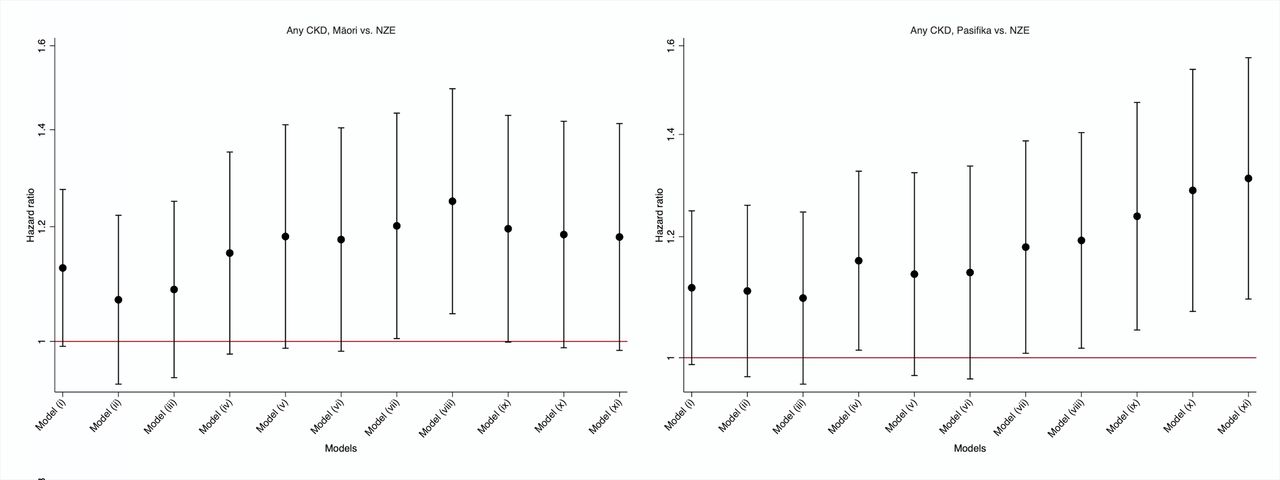
Adjusted HR for any CKDs in Māori and Pasifika with type 2 diabetes compared with NZEs with type 2 diabetes. Model i weighted for age and sex; model ii weighted for all adjusted variables in model i plus IMD group; model iii weighted for all adjusted variables in model ii plus smoking status; model iv weighted for all adjusted variables in model iii plus body measurements (body mass index and systolic and diastolic blood pressures); model v weighted for all adjusted variables in model iv plus baseline glycated haemoglobin; model vi weighted for all adjusted variables in model v plus baseline lipid profile (total cholesterol, low-density lipoprotein cholesterol, high-density lipoprotein cholesterol and triglyceride); model vii weighted for all adjusted variables in model vi plus baseline estimated glomerular filtration rate and albumin creatinine ratio; model viii weighted for all adjusted variables in model vii plus antidiabetes treatments; model ix weighted for all adjusted variables in model viii plus antihypertensive, lowering lipid and anticoagulant treatment; model x weighted for all adjusted variables in model ix plus entry cohorts; model xi weighted for all adjusted variables in model x plus duration of having diabetes at entry time. Log scale of HR is presented in the Y-axis. CKD, chronic kidney disease; IMD, Index of Multiple Deprivation; NZE, New Zealand European.
During the CEM, comparison was restricted between ethnic groups to common support areas, that is, sufficient overlap between the two groups. After excluding participants (online supplemental figures S1 and S2) who were off common support, we then applied entropy balancing18 to efficiently minimize differences in the distribution of matching variables between comparison groups. Entropy balancing involves maximum entropy reweighting of the control group (NZE cohort) by directly incorporating covariables balance into the weight function where the matched sample is reweighted in each matching step to key target moments (mean, variance, and skewness). For continuous variables, all three moments should be met; for binary variables, the only moment to meet is the mean, as it is only sufficient to match higher moments (skewness and variance).
Weighted Cox regression model, including matching weights estimated from each matching step by entropy matching, was used in each matching step, accounting for competing risk of all-cause death. This provided an estimated HR of outcomes between comparison groups, with NZE as reference. The risks of incident outcomes between comparable groups were also estimated based on the same model. Stata MP V.17.0 was used for data manipulation and analysis. The significance level was set as a two-tailed p value of <0.05.
Results
The original cohort incorporated 16 755 NZEs, 7093 Māori, and 12 044 Pasifika with T2DM between 1994 and 2018, among whom 11 297 NZEs, 3691 Māori, and 6668 Pasifika had eGFR of <90 mL/min/1.73 m2 or documented CKD prior to enrollment or within 12 months after the enrollment date (online supplemental figures S1 and S2). Table 1 shows the demographic and clinical characteristics of the unmatched cohort including 5458 NZEs, 3402 Māori, and 5376 Pasifika without CKD at baseline. Compared with NZE, after a mean duration of 4.5–5.0 years of T2DM, Māori and Pasifika were 7–8 years younger, more likely to be female and have lower SES, and have higher BMI, diastolic BP, and CVD-prone lipid profile but lower systolic BP. Māori were more likely to smoke than NZE, who were more likely to have ever smoked compared with Pasifika. Both eGFR and UACR were highest among Māori and Pasifika at baseline. Māori were more likely than NZE to be receiving antihyperglycemic, antihypertensive and statin treatment. Although Pasifika were more likely than NZEs to be receiving antihyperglycemic treatment, they were less likely to receive antihypertensive or statin therapies.
Characteristics in the unmatched comparison cohorts
The unmatched cohort of went through the 11 matching steps to create NZE–Māori and NZE–Pasifika matched cohorts as shown in online supplemental figures S1 and S2. Online supplemental table S1 and figure S3 show that the matched variables were highly similar after the cohorts were weighted by entropy balancing in terms mean, variance, and skewness. Figures 1–3 and online supplemental table S2 show the impact of each matching step on the HR for developing any CKD and each stage of CKD among Māori and Pasifika, respectively, with NZE as the reference. Among Māori (figures 1–2 and online supplemental table S2), final adjusted HRs for CKD stage II were not significantly increased (1.10, 95% CI 0.91 to 1.32), but were 1.70 (95% CI 1.19 to 2.43) for CKD stage III, 3.93 (95% CI 2.16 to 7.14) for CKD stage IV, and 3.74 (95% CI 1.74 to 8.05) for CKD stage V. Among Pasifika (figure 3 and online supplemental table S2), final adjusted HRs were 1.26 (95% CI 1.05 to 1.52) for CKD stage II, 1.71 (95% CI 1.14 to 2.57) for CKD stage III, 3.75 (95% CI 1.40 to 10.05) for CKD stage IV, and 4.96 (95% CI 1.56 to 15.75) for CKD stage V. The adjusted HR for any incident CKD was increased among Pasifika (1.31, 95% CI 1.09 to 1.57) but not Māori (1.18, 95% CI 0.99 to 1.41) (figure 1 and online supplemental table S2).
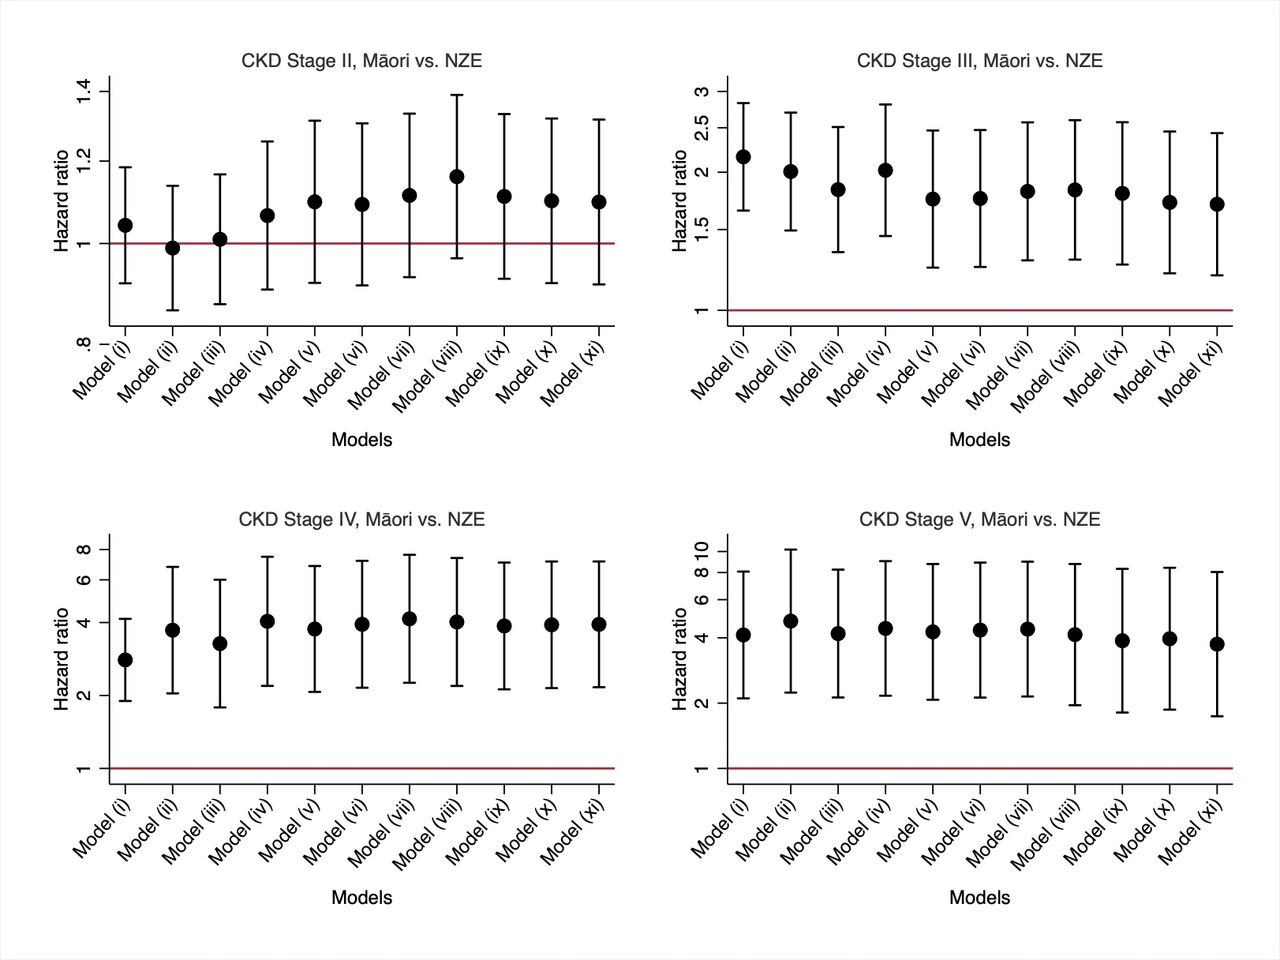
Adjusted HR for risk of each of II–V stages of CKD in Māori with type 2 diabetes compared with NZEs with type 2 diabetes. Model i weighted for age and sex; model ii weighted for all adjusted variables in model i plus IMD group; model iii weighted for all adjusted variables in model ii plus smoking status; model iv weighted for all adjusted variables in model iii plus body measurements (body mass index and systolic and diastolic blood pressures); model v weighted for all adjusted variables in model iv plus baseline glycated haemoglobin; model vi weighted for all adjusted variables in model v plus baseline lipid profile (total cholesterol, low-density lipoprotein cholesterol, high-density lipoprotein cholesterol and triglyceride); model vii weighted for all adjusted variables in model vi plus baseline estimated glomerular filtration rate and albumin creatinine ratio; model viii weighted for all adjusted variables in model vii plus antidiabetes treatments; model ix weighted for all adjusted variables in model viii plus antihypertensive, lowering lipid and anticoagulant treatment; model x weighted for all adjusted variables in model ix plus entry cohorts; model xi weighted for all adjusted variables in model x plus duration of having diabetes at entry time. Log scale of HR is presented in the Y-axis. CKD, chronic kidney disease; IMD, Index of Multiple Deprivation; NZE, New Zealand European.

Adjusted HR for risk of each of II–V stages of CKD in Pasifika with type 2 diabetes compared with NZE with type 2 diabetes. Model i weighted for age and sex; model ii weighted for all adjusted variables in model i plus IMD group; model iii weighted for all adjusted variables in model ii plus smoking status; model iv weighted for all adjusted variables in model iii plus body measurements (body mass index and systolic and diastolic blood pressures); model v weighted for all adjusted variables in model iv plus baseline glycated haemoglobin; model vi weighted for all adjusted variables in model v plus baseline lipid profile (total cholesterol, low-density lipoprotein cholesterol, high-density lipoprotein cholesterol and triglyceride); model vii weighted for all adjusted variables in model vi plus baseline estimated glomerular filtration rate and albumin creatinine ratio; model viii weighted for all adjusted variables in model vii plus antidiabetes treatments; model ix weighted for all adjusted variables in model viii plus antihypertensive, lowering lipid and anticoagulant treatment; model x weighted for all adjusted variables in model ix plus entry cohorts; model xi weighted for all adjusted variables in model x plus duration of having diabetes at entry time. Log scale of HR is presented in the Y-axis. CKD, chronic kidney disease; IMD, Index of Multiple Deprivation; NZE, New Zealand European.
Figure 4 and online supplemental figures S4 and S5 show the Cox regression models with the risk of CKD stages II and III tending to differ between NZE and Māori by 6 years after enrollment and of stages IV and V by 13 years after enrollment (all p<0.001) (online supplemental figure S4). The risk of incident CKD stages II–V tended to differ between NZE and Pasifika at 3, 7, 11, and 12 years (all p<0.001) (figure 4 and online supplemental figure S5).

Cumulative risk of any CKD stages II–V in Māori and Pasifika over 25 years in European and Māori patients with type 2 diabetes. Red and blue lines indicate Māori and European patients with type 2 diabetes, respectively. Risks were estimated from the final model, model xi for each outcome. CKD, chronic kidney disease; NZE, New Zealand European.
Discussion
Previous studies have identified a high risk of prevalent CKD in the general Māori and Pasifika populations; however, no studies have investigated ethnic differences in incident CKD in T2DM within or beyond NZ. Through this large nationally linked NZ dataset, we have compared the risk of any, and each, stage of incident CKD II–V over a 25-year period between Māori and NZE with T2DM, and between Pasifika and NZE with T2DM. After matching for demographic factors, SES, lifestyle risk factors, BMI, and routinely recorded clinical measurements including HbA1c, treatments, duration of T2DM, and period effects, there was an increased overall risk of each incident CKD stages III–V in Māori and Pasifika compared with NZE. Incident stage II CKD was more common among Pasifika (but not Māori) than NZE. Essentially, once CKD starts to develop, Māori and Pasifika are more likely to progress to more advanced stages of kidney disease, reflecting their higher incident need for renal replacement therapy.22
Previous studies in the general population have found that CKD disproportionately affects Māori as well as Pasifika, particular from Samoa, Tonga, and Fiji.23 As home to the largest Pasifika population, NZ (possibly more accurately Auckland, which is relevant to this dataset) fulfills the definition of a CKD hotspot.24 While diabetes is the most common CKD risk factor in the Māori and Pasifika populations,25 familial risk of any renal disease also has a significant role in the development of DKD.26 Our study now adds to these data, suggesting that while progression to CKD stages III–IV appears low in NZE, it is the progression through these stages which appears much higher among Māori and Pasifika leading to higher rates of development of CKD stage V. It is important to note that the T2DM among Māori and Pasifika commences at an average of 7–8 years younger than NZE,27 and that these analyses censor those individuals who died before progressing to CKD stage V. The observation that the progression to CKD stage II, and to any CKD overall, is roughly comparable between Māori and NZE, but greater among Pasifika, might reflect the censoring of those with existing CKD. While beyond NZ, black, Hispanics, other Indigenous peoples, South Asians and other ethnic groups are at increased risk of DKD,28 29 this is the first study to investigate ethnic differences in progression of CKD in those with no CKD on entry. Future analyses will investigate the characteristics and CKD natural history among those with CKD at enrollment.
Māori and Pasifika with T2DM but without CKD are much more likely to progress to more advanced stages of CKD after matching for SES, obesity, glycemia, BP, lipids, treatment, cohort and diabetes duration. The clinical implications of this finding are profound and build on our earlier findings, suggesting that the risk of nephropathy in T2DM is potentially built on independent factors existing even before T2DM has developed.30 The finding is also consistent with the greater risk of CKD in both the Māori and Pasifika populations without T2DM.30
The heterogeneity of nephropathy on renal biopsy among those with T2DM in Auckland has been well described26 with worse outcomes among those with DKD and mixed diabetic and non-diabetic nephropathy compared with those with non-diabetic nephropathy. The high rates of proteinuric kidney disease (independent of diabetes) among Māori and Pasifika have previously been thought to reflect obesity-related glomerulopathy and associated focal segmental glomerulosclerosis.31 Our study adjusted for BMI, and yet the HRs remained higher, suggesting that in those with T2DM, the increased CKD risk goes beyond those associated with obesity. Clearly, intensive research is urgently needed to investigate the pathoetiologic processes behind this excess CKD risk, which seems specific to Māori and Pasifika compared with NZE. This finding supports the recent funding for SGLT 2 inhibitors among Māori and Pasifika with T2DM independent of glycemia.32
Beyond a blanket SGLT 2 inhibitor prescription and tight glycemia and BP control, research among Māori and Pasifika needs to investigate how best to identify those who benefit from treatment (eg, are there new biomarkers), when treatment should commence (eg, before T2DM commences), and whether other treatment such as early ACE inhibitor use and other medications or diets might delay or prevent CKD and its progression.33 A key finding comes from the Delay Future End Stage Nephropathy due to Diabetes study. This unique randomized controlled trial (with 4-year follow-up) investigated the benefits of supported diabetes management among Māori and Pasifika with T2D, CKD stages III–IV with albuminuria. The intervention improved glycemia, BP and albuminuria, but the loss of renal function continued. This suggests that intensive intervention once CKD stages III–IV had developed was too late to prevent progression to ESRD.34 35
There are several potential areas for future research into the unexplained differences in the rate of renal function decline in Māori and Pasifika with T2D, which can broadly be divided into hereditary, molecular and social determinants, including inequities in treatment and racism. Over 150 genes have been associated with susceptibility or resistance to DKD through genetic association studies, while epigenomic-wide association studies have identified several genes that appear to have epigenetic effects.33 There is also growing evidence for the role of abnormal DNA methylation as a risk factor for development of DKD.34 Furthermore, there is increasing evidence for the role of biochemical markers to measure the multiple pathogenic mechanisms of DKD, which include tubulointerstitial injury due to hyper-reabsorption stress, chronic endothelial damage, disruption of the endothelial glycocalyx, and hyperfiltration-induced podocytopathy.35–37 There is also an increasing need to explore the social determinants of the unexplained differences in DKD outcomes, which include issues such as healthcare access, differential treatment, adherence to treatments, food security, health literacy, systemic racism, and more specific socioeconomic factors.20 38,39.
There are several strengths in the current study, incorporating the largest prospective study involving multiethnic matched cohorts of participants with T2DM in NZ to reveal risk of CKD stages II–V over 25 years. These cohorts included all patients with T2DM from participating general practices. By linking large, nationally representative databases, we were then able to prospectively follow-up patients to ascertain all cases with incident CKD stages II–V. All diagnosed CKD cases identified in this study were based on the linkage of specific registration datasets, which have good outcome validation. The accuracy of clinical recording and diagnoses in our study has been validated for outcomes defined by ICD codes, which have high precision.36 Another key strength of our work was the use of a novel, tapered matching method to form quasi-trial comparative cohorts to compare the risk of each CKD stages II–V between patients with T2DM from different ethnic groups. Through the tapered matching,37 38 we were able to transparently examine how the difference in specific sets of confounders contributed to the risk of each CKD stages II–V. By sequentially controlling for differences in demographic factors, SES, lifestyle risk factors, body measurements, key routinely recorded clinical measurements to patients with T2DM, antidiabetes treatments, antihypertensive treatments, anticoagulant treatments, duration of having diabetes, and period effects of enrollment, we observed how the risks of each stages II–V of CKD compared after each matching step between patients with T2DM from different ethnic backgrounds. Limitations of this study include heterogeneity in the NZE, Pasifika, and Māori cohorts, and the degree of national representativeness of the sample populations and of the participating general practices. Although the competing risk of all-cause death was adjusted in models, censoring by death and CKD at the time of enrollment may have biased the outcomes unpredictably, particularly against those with earlier development of CKD, itself possibly reflecting a different phenotype/genotype. Pasifika and Māori eGFRs may relate differently from true GFR due to their higher muscle mass; however, this study has compared rate of fall rather than absolute differences in eGFR. Finally, information on certain CKD risk factors examined in this study were either imprecise measures (eg, IMD for SES) or not available, including health literacy, medication adherence and private unsubsidised purchasing (relying on electronic pharmaceutical claim data, with the potential of introducing misclassification in terms of exact acquisition/intake information), cumulative long-term exposure of tobacco use, and dietary exposure information. Future studies taking into account these risk factors are warranted. Although it would help to have an understanding of the trajectory of the decline in renal function, the long-term change in eGFR could not be modeled in the current study due to the high volume of missing eGFR values. Future replication studies with longitudinal eGFR measurement over a long follow-up period are warranted. Although the sensitivity of a CKD diagnosis by electronic health records might be low in the general population, previous studies have revealed good validity of CKD diagnoses based on clinical codes for the population with diabetes. Moreover, we found that each incident diagnosed outcome based on laboratory testing was associated with at least one clinical diagnosis code recorded in the linked database within a 6-month time window around the laboratory-diagnosed date. The subtype of antihypertensive treatment was not separately matched to maintain proper statistical power and to avoid any potential prescribing biases. However, based on the higher prevalence of antihypertensive treatment prescription among the Māori and Pasifika groups, further subgroup matching would not change the current findings. In terms of new therapies such as SGLT2 inhibitors, these were not available in NZ by the end of study. It would not be possible to examine their impact on the research findings. Future studies of these treatments, perhaps by re-establishing audits such as the DCSS, are warranted.
In conclusion, we have shown significantly higher risks of each incidence of CKD stages II–V among Māori and Pasifika with T2DM with matching possible confounders. Our study suggests that studiesto identify predictive biomarkers for early detection of CKD risk, and studies of responsiveness to existing therapies and investigation into new therapeutic approaches among Māori and Pasifika with T2DM are warranted. Research into the health service, social, and biological mechanisms underlying these differences is also needed.
Data availability statement
The datasets analysed in the current study are not publicly available because of agreements with the primary care organisations and the Ministry of Health, which provided the data.
Ethics statements
Patient consent for publication
Ethics approval
This study involves human participants. The North Health Ethics Committee approved the DCSS for research purposes in 1992, and then as an ongoing audit in 1996 (92/006). Ethics review was waived by the New Zealand Health and Disability Ethics Committees on 25 March 25 2019. Anonymised data were used for this analysis. Signed consent to participate was provided by an authorised signatory for each general practice. The participants gave informed consent to participate in the study before taking part.
Acknowledgments
We thank the participating general practitioners, audit nurses and the Diabetes Care Support Service executive group for their support. The abstract was presented as an e-poster in the American Diabetes Association 2022 Conference (presentation number 1150-P; https://doi.org/10.2337/db22-1150-P).
References
Supplementary materials
Supplementary Data
This web only file has been produced by the BMJ Publishing Group from an electronic file supplied by the author(s) and has not been edited for content.
Footnotes
DY, ZW and YC are joint first authors.
ZZ and DS are joint senior authors.
Contributors DY, ZZ and DS contributed to the design and conduct of the study during all its phases; DY, ZW, YC, ZZ and DS contributed to the processing and the statistical handling of the data to generate the results; DY, ZW, YC, ULO, KP, JB, RC, BJO-W, GS, KJ, ZZ and DS contributed to the discussions on the interpretation of the results and their appropriate presentation; DS contributed to the patient and public input at all stages of the study; DY, ZW, YC, ULO, KP, JB, RC, BJO-W, GS, KJ, ZZ and DS commented on the draft of the final manuscript; DS initiated the project and secured the funding; DY, ZW, YC, ULO, KP, JB, RC, BJO-W, GS, KJ, ZZ and DS produced the first draft of the manuscript. DY and DS act as gaurantor for this study.
Funding The DCSS was funded by the New Zealand Ministry of Health through Counties Manukau District Health Board. The funders had no role in the study design, data collection, data analysis, data interpretation or writing of the report.
Competing interests None declared.
Provenance and peer review Not commissioned; externally peer reviewed.
Supplemental material This content has been supplied by the author(s). It has not been vetted by BMJ Publishing Group Limited (BMJ) and may not have been peer-reviewed. Any opinions or recommendations discussed are solely those of the author(s) and are not endorsed by BMJ. BMJ disclaims all liability and responsibility arising from any reliance placed on the content. Where the content includes any translated material, BMJ does not warrant the accuracy and reliability of the translations (including but not limited to local regulations, clinical guidelines, terminology, drug names and drug dosages), and is not responsible for any error and/or omissions arising from translation and adaptation or otherwise.