Article Text

Abstract
Introduction Metformin (MET) can regulate glucose and lipid levels, and the gut microbiota may be involved in the control of metabolism. We hypothesized that MET alleviates glucolipid metabolism disorder by modulating gut microbiota and microbial metabolites.
Research design and methods A total of 24 male C57BL/6 J mice were equally divided into three groups (normal control, model control (MC), and MET-treated groups). Model mice were established by feeding a high-fat diet for 6 weeks. The MET-treated group was administered MET solution (2.5 g/100 mL, 250 mg/kg). Fecal samples were collected to characterize the microbiota system using metagenomic shotgun sequencing and gas chromatography–time of flight–mass spectrometry analysis. Phenotypic and biochemical indices were obtained for further correlation analysis.
Results Compared with the MC group, MET reduced the levels of weight, glucose, areas under the glucose curve in the glucose tolerance test, triglyceride (TG), and total cholesterol (TC). A decreasing abundance of bacteria, including Parabacteroides distasonis, and an increasing abundance of bacteria, including Bacteroides vulgatus, were observed in the MET-treated group. The 2-deoxytetronic acid declined after MET intervention and was positively correlated with species over-represented in the MC group and negatively correlated with species enriched in the MET-treated group. Additionally, species enriched in the MET-treated group negatively correlated with glucose, areas under the glucose curve in the glucose tolerance test, and TGs. Further, the correlation between the differential metabolites, which decreased after MET intervention, and the phenotypic indices was positive.
Conclusions MET-induced restoration of intestinal homeostasis correlates with the amelioration of host glucolipid metabolism.
- Metformin
- Diabetes Mellitus, Experimental
- Hyperlipidemias
- Microbiology
Data availability statement
Data are available in a public, open access repository. All the raw sequence data will be deposited in the Genome Sequence Archive48 in National Genomics Data Centre,49 China National Centre for Bioinformation/Beijing Institute of Genomics, Chinese Academy of Sciences (under accession number CRA005611), which are publicly accessible at online (https://ngdc.cncb.ac.cn/gsa).
This is an open access article distributed in accordance with the Creative Commons Attribution Non Commercial (CC BY-NC 4.0) license, which permits others to distribute, remix, adapt, build upon this work non-commercially, and license their derivative works on different terms, provided the original work is properly cited, appropriate credit is given, any changes made indicated, and the use is non-commercial. See: http://creativecommons.org/licenses/by-nc/4.0/.
Statistics from Altmetric.com
WHAT IS ALREADY KNOWN ON THIS TOPIC
Metformin (MET) can regulate glucose and lipid metabolism, and gut microbiota and metabolites might be involved.
WHAT THIS STUDY ADDS
MET restores intestinal homeostasis and ameliorates the host metabolism.
HOW THIS STUDY MIGHT AFFECT RESEARCH, PRACTICE OR POLICY
This study provides a reference for the full understanding of the mechanism of MET in treating glucolipid metabolism disorders, especially the involvement of gut microbiota.
Introduction
Diabetes and dyslipidemia are risk factors for cardiovascular disease, and diabetes combined with dyslipidemia increases the risk of macrovascular and microvascular complications of cardiovascular disease.1 Moreover, dyslipidemia is the leading risk factor of fatal and non-fatal myocardial infarction among patients with diabetes.2 Epidemiological investigations in China have shown that 42% of patients with type 2 diabetes mellitus (T2DM) have dyslipidemia, and the control situation is far from satisfactory.1 Statins, ezetimibe and PCSK9 inhibitors have been recommended for the management of dyslipidemia in patients with T2DM.3 4 However, the occurrence of statin-associated muscle symptoms and the reduction in compliance caused by combination therapy have made it necessary for alternative and complementary treatment.5 6
Metformin (MET) has been used as a first-line therapy for T2DM, and a previous study reported the lipid-lowering effect of MET in patients with T2DM.7 Further research has demonstrated that MET can reduce TC and low-density lipoprotein cholesterol levels among patients without diabetes8 and even improve carbohydrate and lipid metabolic profiles in glucocorticoid-treated patients.9 A deeper exploration of the intervention mechanism suggested that the antidiabetic effect of MET is mediated by the alteration of the gut microbiota.10 Furthermore, prebiotic feeding leads to the normalization of the microbiota, which corresponds to the improvement of the metabolic situation in diabetic mice.11 Prebiotic feeding also exhibits beneficial effects on serum cholesterol metabolism in participants with dyslipidemia.12 Thus, we hypothesized that MET alleviates T2DM with dyslipidemia via modulation of gut microbiota and microbial metabolites.
In this study, we intended to obtain the correlation between the composition of the gut microbiome and glucolipid-related clinical parameters in the context of MET intervention. An exploratory experiment using 24 mice was designed, and these mice were randomly assigned to the normal control (NC), model control (MC), and MET groups. Metagenomic shotgun sequencing and gas chromatography–time of flight–mass spectrometry (GC-TOF-MS) analysis of the gut microbiota and microbial metabolites were used to characterize the gut microbiome.
Materials and methods
Animal models and study design
Male C57BL/6 J mice (Beijing Vital River Laboratory Animal Technology Co., Beijing, China) aged 7 weeks were housed under a 12-hour light–dark cycle in a specific pathogen-free facility. All mice were fed sterile water and rodent chow (SPF-F02-001; SPF (Beijing) Biotechnology Co., Beijing, China) ad libitum during a 1-week acclimatization period. To reduce the cage effect, four mice were housed in each cage. To reach the required minimum biological replicates13 14 and to reduce the number of experimental animals as possible, a total of 24 mice were randomly divided into the NC, MC and MET groups according to their body weights and glucose, and Excel software was used to generate the random number. Mice in the NC group were fed regular rodent chow, while mice in the MC and MET groups were fed a 6-week high-fat diet (HFD) providing 60 kcal% from fat (D12492; Research Diets, New Brunswick, New Jersey, USA) to develop an HFD-induced model mice (fasting blood glucose level of ≥7.0 mmoL/L and a weight increase of ≥30%). The mice in the MC and MET groups were fed the same HFD as before during the intervention period. The blood glucose level and weight of the mice were measured every week and every 2 weeks. Fecal samples were collected at the end of the 8-week intervention and then frozen and stored at −80°C until analysis. Cervical dislocation was performed after the mice were fasted overnight at the end of the 8-week intervention period.
Drug administration
The mice in the NC and MC groups were administered distilled water (10 mL/kg) to mimic the effects of oral gavage. The mice in the MET group were administered a MET solution (2.5 g/100 mL, 250 mg/kg). MET hydrochloride tablets (Sino-American Shanghai Squibb Pharmaceuticals) were grinded into powder and dissolved in distilled water. All administrations were conducted once a day for 8 weeks.
Biochemical examinations
A OneTouch glucometer (Roche, Basel, Switzerland) was used to measure tail vein glucose levels. Serum samples for lipid measurement were harvested from eyeball blood. The levels of triglyceride (TG) and total cholesterol (TC) were detected using the oxidase method, and high-density lipoprotein cholesterol (HDL-C) and low-density lipoprotein cholesterol (LDL-C) were detected using the selective inhibition method on an automatic biochemistry analyzer (Olympus AU480; Olympus Corporation, Tokyo, Japan). The oral glucose tolerance test (OGTT) for each mouse was performed 2–3 days prior to sacrifice. Glucose levels were plotted against time, and the areas under the glucose curve for the period of 0–120 min after the administration of an oral gavage of glucose at a concentration of 2 g/kg of body weight were calculated following the trapezoidal rule.
Metagenomic shotgun sequencing
Eight fecal samples were obtained from each of the eight mice in each group at the end of the 8-week intervention period. Bacterial chromatin was extracted using a DNA Stool kit (Qiagen Bioinformatics Co., Hilden, Germany) according to the manufacturer’s protocol. Subsequently, PCR was performed after ligating the adapters, size selection, and tailed random primers to obtain sufficient amplification products for library construction. The libraries were prepared using the NEBNext Ultra DNA Library Prep Kit for Illumina, and their quality was validated with a DNA LabChip 1000 kit on an Agilent 2100 Bioanalyzer (Agilent Technologies, Wokingham, UK). Clusters were generated by bridge amplification within paired-end flow cells using the Illumina TruSeq PE Cluster Kit v3-cBot-HS, according to the manufacturer’s instructions. After cluster generation, paired-end sequencing was performed on an Illumina HiSeq 2000 platform using the TruSeq SBS Kit v3-HS. Unpaired reads were excluded from the clean reads. High-quality sequencing reads were de novo assembled into long contigs or scaffolds, which were used for gene prediction, taxonomic classification, and functional annotation. Detailed process for metagenomic shotgun sequencing was provided in online supplemental additional file 1.
Supplemental material
Metagenome assembly and construction of the gene catalog
Metagenome assembly was performed using SOAPdenovo15 V.2.04. Open reading frames were predicted using MetaGeneMark16 V.3.26, and those shorter than 100 nt were filtered from the predicted results using default parameters. We then used 17Cluster Database at High Identity with Tolerance to obtain a non-redundant gene catalogue (at 95% identity and 90% coverage). The clean data of each sample were mapped to the non-redundant gene set using SoapAligner V.2.21. The abundance of each gene in each sample was calculated based on the number of reads mapped to each gene.
Taxonomic and functional assignment of genes
SoapAligner V.2.2118 was used to align clean reads with microbial reference genomes downloaded from the National Centre for Biological Information. Individual genes were binned into coabundance gene groups (CAGs) using a canopy-based algorithm.19 These CAGs were annotated to species, genus, etc, using associated profiles based on the Reference Sequence database of National Center for Biotechnology Information.20 Sequenced-based abundance profiling was performed as previously described.21 The relative gene abundance profile was summarized into the Kyoto Encyclopedia of Genes and Genomes (KEGG) database22 for the functional analysis using BLAST V.2.2.28+. We obtained the relative abundance of each KEGG Orthology (KO) based on the functional annotation results and gene abundances.
Microbial composition analysis
The Shannon–Wiener diversity index and Simpson diversity index based on the genera profiles were calculated to estimate the alpha diversity. Unconstrained principal coordinate analysis (PCoA) presented the overall differences in the microbial community structures using the ade4 package,23 which was confirmed by permutational multivariate analysis of variance (PERMANOVA, Adonis analysis) based on Bray-Curtis dissimilarity values and analysis of similarity (ANOSIM) with 9999 permutations using the vegan package. Linear discriminant analysis effect size (LEfSe)24 (using a default linear discriminant analysis (LDA) score of 3) was employed to identify high-dimensional biomarkers from the three groups. Two- way analysis of variance (ANOVA) test was conducted to validate the results from LEfSe. All visualizations were performed using the R platform.
GC-TOF-MS raw data preprocessing and annotation
All samples were analyzed using an Agilent 7890 gas chromatograph coupled with a Pegasus HT time-of-flight mass spectrometer. We performed peak extraction, baseline filtering and correction, deconvolution, peak integration, and peak alignment using the Chroma TOF 4.3X software (LECO Corporation, St. Joseph, Michigan, USA). The metabolites were identified based on the LECO-Fiehn Rtx5 database by matching the mass spectrum and retention index. Detailed process for GC-TOF-MS analysis is provided in online supplemental additional file 1.
Metabolomics profile analysis
Multivariate statistical analyses were performed based on the normalized peak areas of metabolites using the ade4 package,23 including orthogonal projection to latent structure–discriminate analysis (OPLS-DA). To obtain the unique metabolites of each sample, we set the variable importance in the projection (VIP) values to >1 and Student’s t-test to p<0.05. In addition, we used the KEGG database to link the differential metabolites to metabolic pathways.
Statistical analysis
Statistical analyses of the results were performed by assessors and statisticians blinded to the group allocation. All statistical analyses were performed using the R software. Data are presented as the mean±SE of the mean. ANOVA, Kruskal-Wallis or Wilcoxon rank-sum test was used for comparisons between groups when appropriate. We calculated the Spearman rank correlation coefficient using the R package of ‘psych’ between genera and metabolites and genera and phenotypic indices based on the relative abundance profile of genera. Multivariate analysis by linear models (MaAsLin) was used for further correlation analysis between genera and metabolites using the ‘MaAsLin’ package. P values were corrected and determined using the false discovery rate (FDR) method.
Results
Phenotypic and biochemical changes
We did not observe any significant differences in weight and tail vein glucose among the groups at baseline or between the MC and MET groups prior to intervention. Fed with 6-week HFD, the weight and tail vein glucose of the MC and MET groups were significantly increased (both p<0.01; figure 1A,C). MET reduced the weight and tail vein glucose after an 8-week oral administration, compared with the MC group (p<0.05 and p<0.001; figure 1B,D). The OGTT and the area under the curve (AUC) of the OGTT also showed the glucose-lowering effect of MET (p<0.01; figure 1E,F). In addition, we detected remarkable decreases in TC and TG levels (p<0.0001 and p<0.001, respectively; figure 1G). However, neither HFD nor MET interfered with HDL-C or LDL-C levels.

Phenotypic and biochemical changes. The data were collected at the beginning and the end of the 6-week model establishment and during the 8-week intervention. (A) Weight observation during the 6-week model establishment and 8-week intervention period. (B) Comparison of weight at week 14. (C) Tail vein glucose observation during the 6-week model establishment and 8-week intervention period. (D) Comparison of tail vein glucose at week 14. (E) OGTT at week 14. (F) AUC of OGTT. (G) Comparison of lipid indices at week 14. Differences were assessed by analysis of variance. *P<0.05, **P<0.01, ***P<0.001, ****P<0.0001. AUC, area under the curve; HDL-C, high-density lipoprotein cholesterol; LDL-C, low-density lipoprotein cholesterol; MC, model control; MET, metformin; NC, normal control; ns, not significant; OGTT, oral glucose tolerance test.
Gut microbial composition alterations identified by shotgun metagenomic sequencing
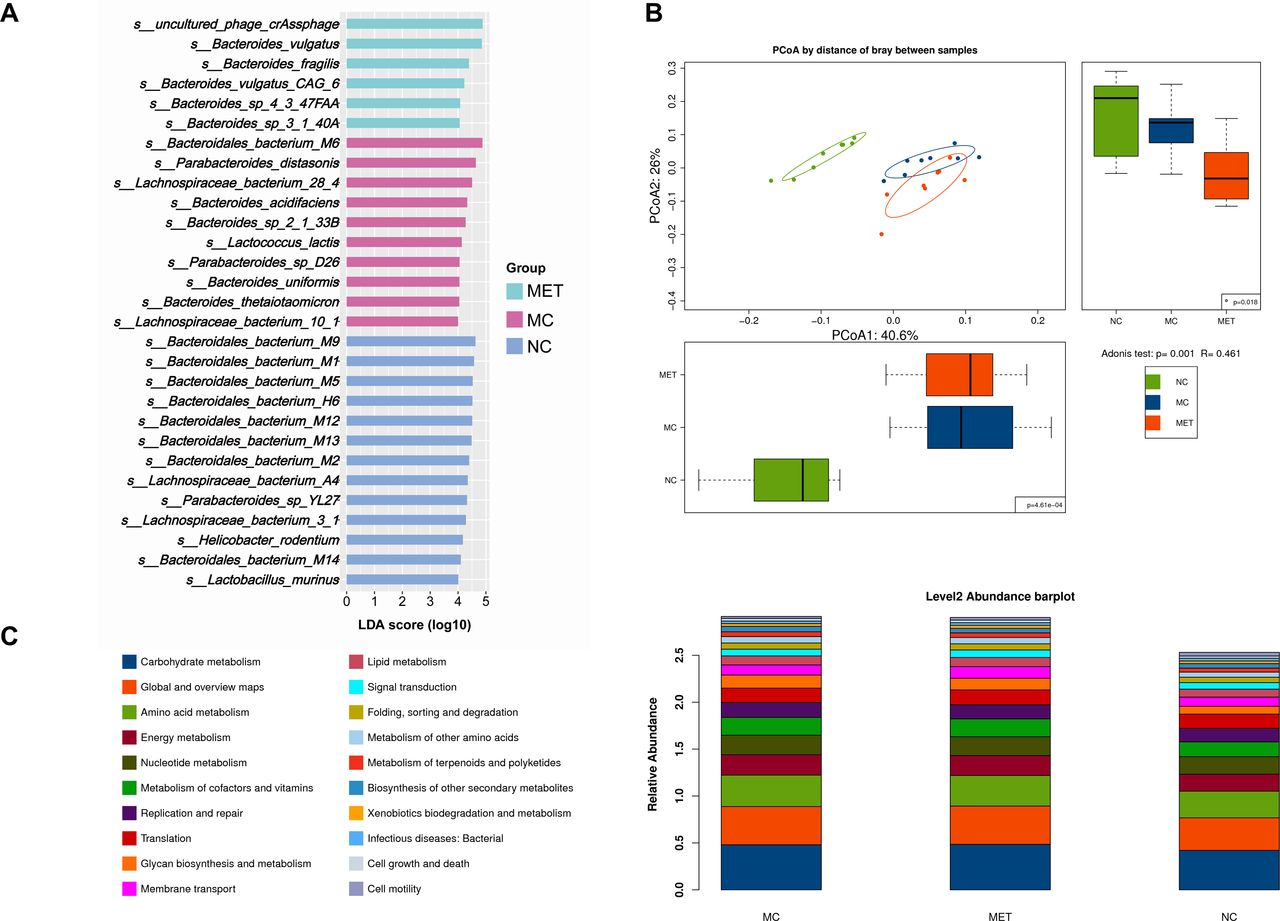
On the Illumina platform, a total of 0.395 Gb clean reads were generated, with an average of 4.961±0.877 Gb bases per read (online supplemental additional file 2). To characterize the bacterial richness, rarefaction analysis was performed. The curve of number of species of all samples was near saturation (figure 2A), which suggested that the sequencing data were large enough to reflect the composition of the gut microbiota. The number of genes in the three groups was also counted separately, and the NC group displayed a higher abundance (both p<0.001, NC vs MC, NC vs MET; Kruskal-Wallis test; figure 2B). Alpha diversity was significantly different between NC and MC as well as between NC and MET, indicating that NC recruited more bacterial species than MC and MET (both p<0.001, NC vs MC, NC vs MET; figure 2C). However, there were no statistically significant differences between the MET and MC groups. The depletion of genes may reflect the lack of healthy microbiota in the MC and MET groups, which is consistent with previous findings.25 The bacterial community structures of the three groups were significantly different (ANOSIM: R=0.951, p=0.0001; figure 2D; PERMANOVA: R=0.708, p=0.001; figure 2E). Differences in the gut microbiota among the NC, MC, and MET groups were significant and detectable at the species level (figure 2F). The Wilcoxon sum-rank test was applied to distinguish the genus and species profiles, showing the gut microbiota with a higher relative abundance in each group (online supplemental additional file 3). At the genus level, Lachnospiraceae bacterium A4 and Helicobacter in the NC group, Parabacteroides in the MC group, and Bacteroides in the MET group dominated. At the species level, Helicobacter rodentium was dominant in the NC group, while Parabacteroides distasonis in the MC group and Bacteroides vulgatus and B. fragilis in the MET group prevailed. We further compared the changes in the gut microbiota among the three groups using LEfSe analysis. The histogram of the LDA scores revealed a clear difference among mice from the NC, MC, and MET groups at the species level (LDA score >3, online supplemental additional file 4). A stricter comparison is presented in figure 3A (LDA score >4). Uncultured Bacteroidales bacterium (H6, M1, M2, M5, M9, M12, M13, and M14), uncultured L. bacterium (A4, 3–1), Parabacteroides sp YL27 and H. rodentium were the most over-represented genera in the NC, while B. bacterium M6, P. distasonis, uncultured L. bacterium 28–4, B. acidifaciens, Bacteroides sp 2-1-33B, Lactococcus lactis, Parabacteroides sp D26, B. uniformis and B. thetaiotaomicron were the most significantly abundant in the MC group. Uncultured phages crAssphage, B. vulgatus (including CAG 6), B. fragilis, Bacteroides sp 4-3-47FAA, and Bacteroides sp 3-1-40A showed the strongest association with the MET. Among the species with LDA scores higher than 4, uncltured B. bacterium (H6, M1, M2, M5, M6, M9, M12, and M13), uncultured L. bacterium (A4, 28–4, and 3–1), H. rodentium, P. distasonis, B. acidifaciens, uncultured phages crAssphage, B. vulgatus (including CAG 6), and B. fragilis were validated by two-way ANOVA (adjusted p<0.05).
Supplemental material
Supplemental material
Supplemental material
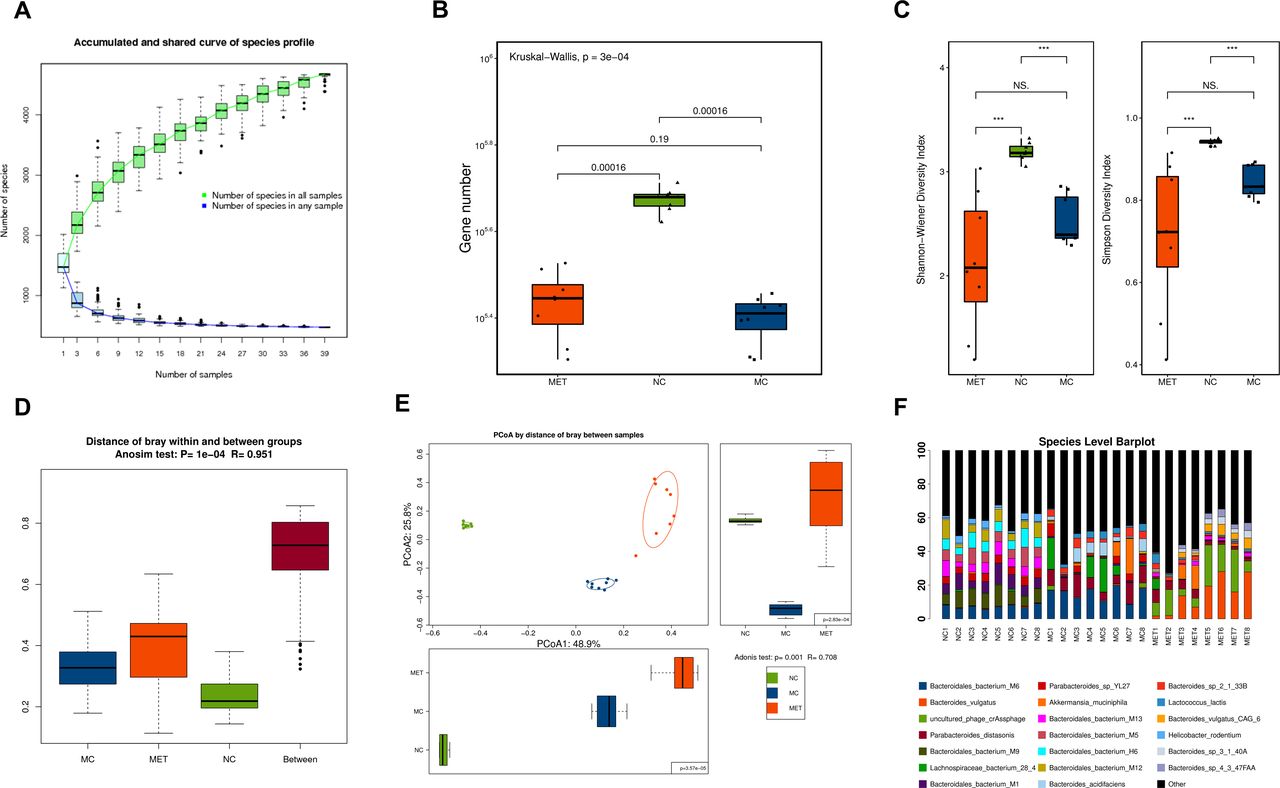
Global metagenomic characteristics of the fecal samples. The fecal samples were collected at the end of the 8-week intervention and analyzed using metagenomic shotgun sequencing. (A) Accumulated and shared curve of species profile. The curve in all samples was near saturation when the sequencing data are great enough with few new genes undetected. (B) Comparison of the microbial gene count based on the genera profile in the three groups (Kruskal-Wallis test). (C) Gut microbiota alpha diversity at species level. (D) ANOSIM test on distance of Bray within and between groups. (E) PCoA of gut microbial composition by distance of Bray among samples. (F) Ternary plot of the main species in three groups. *P<0.05, **P<0.01, ***P<0.001, ****P<0.0001. ANOSIM, analysis of similarity; MC, model control; MET, metformin; NC, control group; ns, not significant; PCoA, principal coordinate analysis.

Bacteria and potential function enriched in each group. The enrichment of gut microbiota was obtained using LEfSe analysis, and the functional annotations of the metagenome to KEGG modules were performed. (A) LEfSe histogram. Only species with an LDA score of >4 are shown. (B) PCoA of microbial functions by distance of Bray. The differences were tested by Adonis analysis. (C) KEGG level 2 abundance barplot, Adonis analysis (PERMANOVA). KEGG, Kyoto Encyclopedia of Genes and Genomes; LDA, linear discriminant analysis; LEfSe, linear discriminant analysis effect size; MC, model control; MET, metformin; NC, control group; ns, not significant; PCoA, principal coordinate analysis; PERMANOVA, permutational multivariate analysis of variance.
Functional alteration in gut microbiota
We performed functional annotation of the metagenome using KEGG modules to explore its effect on gut microbiota function. PCoA based on KO revealed striking differences in microbial functions among the groups (Adonis test: p=0.001, R=0.461; figure 3B). A total of 3179 KOs were differentially enriched among the three groups (FDR-adjusted p<0.05, Wilcoxon rank-sum test; online supplemental additional file 5 sheet 1). We further analyzed these KOs using LEfSe with two-way ANOVA to find identify statistically significant KOs (online supplemental additional file 5 sheet 2). These 3179 KOs were mapped to KEGG pathways and further classified into levels 1 and 2 to KEGG pathways (figure 3C). The abundance of KEGG functions was determined based on the abundance of KOs combined with annotations. In general, metabolism was the most abundant categorized function at level 1, followed by carbohydrate metabolism, global and overview maps, and amino acid metabolism at level 2. Specifically, the MET and MC groups showed higher levels of metabolism at level 1 compared with the NC group (p<0.001, ANOVA), lipid metabolism, amino acid metabolism, carbohydrate metabolism (p<0.001, ANOVA), and glycan biosynthesis and metabolism (p<0.01 and p<0.001, ANOVA) at level 2. Besides, we found MET decreased the levels of biosynthesis of other secondary metabolites and metabolism of terpenoids and polyketides (p<0.001 and p<0.05, Kruskal-Wallis), and increased the level of immune system (p<0.001, Kruskal-Wallis).
Supplemental material
Metabolic profile of gut microbiota
We conducted non-targeted metabolomic profiling using GC-TOF-MS to determine the differential levels of metabolites in the intestinal lumen of mice from each group. The significant partition of clusters between the MC and MET groups was presented by the OPLS-DA score plot and permutation test plot of OPLS-DA derived from the GC-TOF-MS metabolite profiles (figure 4A). The compositional changes involved 22 analytes that were significantly different between the MC and MET (VIP >1, p<0.05; online supplemental additional file 6). Among these, nine analytes were annotated; 1-monopalmitin, 2-deoxytetronic acid, fructose 2,6-biphosphate degr prod 2, linoleic acid, methyl jasmonate 4, N(epsilon)-trimethyllysine, oxamic acid, tagatose 1, and xylose 1 were all decreased in the MET group (figure 4B). KEGG pathway enrichment analysis based on differential analytes indicated that linoleic acid metabolism was the predominant divergence between MC and MET (p<0.01). Furthermore, we found the levels of nine analytes increased after HFD intervention and decreased after MET intervention. Among these, three analytes were annotated as 2-deoxytetronic acid, methyl jasmonate 4, and oxamic acid (p<0.05, figure 4C).
Supplemental material

Statistical comparison of metabolites and analysis of differential metabolites. The fecal samples were collected at the end of the 8-week intervention and analyzed using GC-TOF-MS. (A) OPLS-DA score plot and permutation test plot of OPLS-DA derived from the GC-TOF-MS metabolite profiles. The green circle represents the R2 value; the blue square represents the Q2 value; the green line represents the regression line of R2; and the blue line represents the regression line of Q2. (B) Boxplot of differential metabolites. Differential metabolites were obtained between the MC and MET groups with VIP value of >1 and p<0.05 (OPLS-DA and Student’s t-test). (C) The expression of three restored analytes. *P<0.05, **P<0.01. GC-TOF-MS, gas chromatography–time of flight–mass spectrometry; MC, model control; MET, metformin; NC, normal control; ns, not significant; OPLS-DA, orthogonal projection to latent structure–discriminate analysis; VIP, variable importance in the projection.
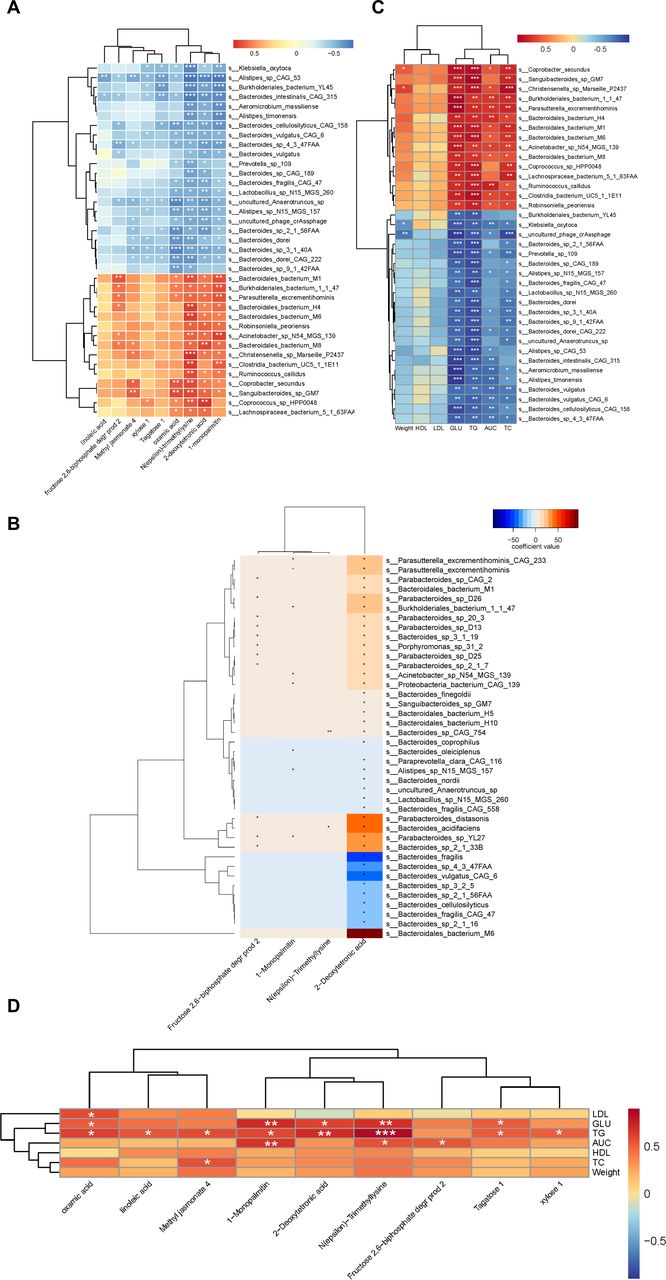
Correlation analysis of gut microbiota, metabolic profile, and phenotypic indices
As MET significantly altered the composition of the gut microbiota and gut metabolites and improved phenotypic indices in HFD-induced model mice, we further analyzed the correlation between gut microbiota and metabolites, gut microbiota and weight, glucose, and lipids. The differential bacterial species and microbial metabolites between the NC and MC groups were pooled for correlation analysis (online supplemental additional file 7). Furthermore, the Spearman rank correlation analysis based on the differential species and metabolites showed that the species enriched in the MET group (including uncultured phage crAssphage, B. vulgatus (including CAG 6), B. fragilis, Bacteroides sp 4-3-47FAA, and Bacteroides sp 3-1-40A) negatively correlated with 2-deoxytetronic acid, 1-monopalmitin, N(epsilon)-trimethyllysine, and oxamic acid. However, B. bacterium M6, which was over-represented in the MC group, was positively correlated with 2-deoxytetronic acid (figure 5A). On further analysis, we also observed a negative correlation between 2-deoxytetronic acid and B. vulgatus (including CAG 6), B. fragilis, and Bacteroides sp 4-3-47FAA, and a positive correlation between B. bacterium M6, P. distasonis, B. acidifaciens, and 2-deoxytetronic acid using MaAsLin (figure 5B). Additionally, the inter-relationship between differentially expressed species and the phenotypic indices (including glucose and weight) was determined using Spearman rank correlation analysis (figure 5C). B. bacterium M6, P. distasonis, and L. lactis, which were all enriched in the MC group, partially had a strong positive correlation with tail vein glucose, weight, and AUC of the OGTT and TG. Within the species enriched in the MET group, B. fragilis showed a negative correlation with weight. Besides, all the differential annotated metabolites between the MC and MET groups were positively associated with the clinical indices (figure 5D).
Supplemental material
Correlation analysis of gut microbiota, metabolic profile, and phenotypic indices. The data were collected at the end of the 8-week intervention. (A) Heatmap of Spearman correlation between gut microbiota and metabolites. (B) Heatmap of MaAsLin on the correlation between gut microbiota and metabolites. (C) Heatmap of Spearman correlation between gut microbiota and phenotypic indices. (D) Heatmap of Spearman correlation between microbial metabolites and phenotypic indices. *p<0.05, **p<0.01, ***p<0.001. AUC, area under the curve; HDL, high-density lipoprotein; LDL, low-density lipoprotein; MaAsLin, multivariate analysis by linear models; TC, total cholesterol; TG, triglyceride.
Discussion
Here, we conducted a minor experiment to investigate the alteration of the gut microbiota and microbial metabolites induced by MET in HFD-induced model mice. MET treatment significantly influenced gut microbiota composition, microbial metabolites, and phenotypic indices in mice with glucolipid metabolism disorder. Further correlation analysis indicated a negative correlation between species enriched in the MET group and 2-deoxytetronic acid, as well as the phenotypic indices, and the positive correlation between species enriched in the MC group and 2-deoxytetronic acid, and the phenotypic indices. However, the correlation between the differential metabolites, which decreased after MET intervention, and the phenotypic indices was positive.
Gut microbiota and microbial metabolites have attracted increasing attention over the past decade. Researchers have conducted several experiments on the role of the gut microbiome in the pathology of diabetes and the mechanism of action of MET. A similar study reported that the therapeutic effect of MET on T2DM might occur with short-chain fatty acid production and an increase in the abundance of Escherichia species, and the restriction of the use of MET could induce the depletion of butyrate-producing species.26 The increase in the abundance of Escherichia coli after MET intervention was also observed in current study. Moreover, an experiment using tractable genetic models with a high-throughput platform found that the effects of MET on lipid metabolism could be implemented by the accumulation of microbial agmatine.27 Here, we report a novel response of MET in the intestinal environment.
Of particular interest are the bacterial taxa, such as B. vulgatus, B. fragilis, P. distasonis, and B. acidifaciens, which are known to be important in some chronic diseases.
B. vulgatus was the predominant species in the MET group. Administration of polysaccharide from Plantago asiatica L. promoted the reduction of blood glucose, insulin, TC, and TG, and increased HDL-C and B. vulgatus in high-fat diet and streptozotocin-induced type 2 diabetic rats.28 Additionally, B. vulgatus reportedly decreases in patients with coronary artery disease, and gavage with live B. vulgatus reduces gut microbial lipopolysaccharide production and suppresses proinflammatory immune responses in atherosclerosis-prone mice.29 However, several studies have indicated that B. vulgatus increases in obese people30 and is linked to low-grade inflammation and insulin resistance.31 32 These controversial results suggest that B. vulgatus can induce immunomodulatory responses that are mediated by lipopolysaccharide.33 Our study found that MET treatment increased the abundance of B. vulgatus, which may affect immune regulation. B. fragilis reportedly has anti-inflammation effects. B. fragilis produces polysaccharide A and sphingolipids, both of which are involved in the anti-inflammatory function of related T cells.34 35 In addition, B. fragilis inhibits the production of intestinal-derived corticosterone through its metabolite arachidonic acid.36 However, a contrary report indicated that MET ameliorates metabolic dysfunction by inhibiting B. fragilis, thus increasing the level of bile acid glycoursodeoxycholic acid in patients with newly diagnosed T2DM.37
P. distasonis was enriched in the MC group, and an increased abundance was observed in obese patients with T2DM in a Chinese cohort study.38 Moreover, free access to a sugar-sweetened beverage increases the abundance of P. distasonis in rats.39 However, P. distasonis may ameliorate hyperglycemia and hyperlipidemia in HFD-fed mice via its metabolites, succinate, and secondary bile acids.40 This contentious issue requires further study. B. acidifaciens markedly increased in a streptozotocin–high-fat, diet-induced non-alcoholic steatohepatitis–hepatocellular carcinoma C57BL/6 J mouse model and presented a positive correlation with bacterial lipopolysaccharide levels and pathophysiological features.41 The decreased abundance of B. acidifaciens in the MET group suggests that the therapeutic effect may be due to the amelioration of intestinal permeability and reduction of lipopolysaccharide. The results of KEGG analysis also indicated that MET increased the level of immune system, which may be associated with the gut microbial lipopolysaccharide production and regulation of the immune responses.
As for the metabolites, former studies proposed that MET regulated the production of short-chain fatty acid, butyrate, propionate,26 42 bile acid glycoursodeoxycholic acid,37 and agmatine.27 Additionally, a microbial metabolite (imidazole propionate) inhibited the effect of MET.43 In this study, we found that 2-deoxytetronic acid, the dominant metabolite correlated with gut microbiota, was depleted after treatment with MET. 2-Deoxytetronic acid is an endogenous short-chain polyhydroxymonocarboxylic acid that has been reported to be positively correlated with post-MET glucose levels in the OGTT.44 Besides, methyl jasmonate 4 may be a plant hormone based on the information from ChEBI45 (ChEBI ID:15929), which we thought might originate from the feed. Though methyl jasmonate can exert anti-inflammatory and antioxidant action,46 it was unclear why the content of methyl jasmonate 4 decreased after MET intervention. Further research applying the targeted metabolomics might better clarify the phenomenon. As for the oxamic acid, it might also come from the feed. However, high-fat and high-sugar diet can interfere with the gut microbial oxalate metabolism.47 Thus, the level of oxamic acid might decrease after MET restores the gut microbiota.
A limitation of this study is the lack of stool sample collection at the beginning of the experiment and at the end of model establishment; however, the control group may ease the influence of the previous one. More research using gavage of single species or fecal microbiota transplantation is needed to determine the regulatory network.
This study was designed to determine the effects of MET on the gut microbial system. The most obvious finding of this study is that MET may restore intestinal homeostasis and ameliorate host metabolism by inhibiting B. bacterium M6, P. distasonis, and B. acidifaciens; promoting B. vulgatus and B. fragilis; and restricting the production of 2-deoxytetronic acid. Overall, these findings suggest a role for the gut microbial system in promoting the therapeutic effects of MET on glucose and lipid regulation. The insights gained from this study may assist in fully understanding the mechanism of MET in treating metabolic diseases, especially the involvement of the gut microbiota.
Data availability statement
Data are available in a public, open access repository. All the raw sequence data will be deposited in the Genome Sequence Archive48 in National Genomics Data Centre,49 China National Centre for Bioinformation/Beijing Institute of Genomics, Chinese Academy of Sciences (under accession number CRA005611), which are publicly accessible at online (https://ngdc.cncb.ac.cn/gsa).
Ethics statements
Patient consent for publication
Ethics approval
All animal experimental protocols were approved by the ethics committee of Guang'anmen Hospital, China Academy of Chinese Medical Sciences (approval number IACUC-GAMH-2019–002) and followed the relevant guidelines of the laboratory animal care.
References
Supplementary materials
Supplementary Data
This web only file has been produced by the BMJ Publishing Group from an electronic file supplied by the author(s) and has not been edited for content.
Footnotes
HW and XW contributed equally.
Contributors HW: investigation, methodology, formal analysis and writing (original draft, review and editing); XW: investigation, methodology, formal analysis and writing (original draft); XF: data curation and writing (review and editing); FL: data curation, methodology, resources and software; ML: formal analysis, methodology and software; JL: formal analysis, funding acquisition and resources; DD: methodology, software and visualisation; JT: conceptualisation, funding, acquisition, project administration, resources, supervision and writing (review and editing). All the authors participated in the design and approved the final manuscript, approving the published version and agreeing to be accountable for the accuracy and integrity. JT acts as guarantor.
Funding This work was supported by the National Natural Science Foundation of China (numbers 81904187 and 81803923), Capital Health Research and Development of Special Fund (CD2020-4-4155), CACMS Scientific and Technological Innovation Fund (CI2021A01601), Open Project of National Facility for Translational Medicine (Shanghai, TMSK-2021-407), Innovation Team and Talents Cultivation Program of National Administration of Traditional Chinese Medicine (number ZYYCXTD-D-202001) and the Outstanding Young Scientific and Technological Talents Program (ZZ13-YQ-026). The design, management, analysis and reporting of the study are entirely independent of the aforementioned programmes.
Competing interests None declared.
Provenance and peer review Not commissioned; externally peer reviewed.
Supplemental material This content has been supplied by the author(s). It has not been vetted by BMJ Publishing Group Limited (BMJ) and may not have been peer-reviewed. Any opinions or recommendations discussed are solely those of the author(s) and are not endorsed by BMJ. BMJ disclaims all liability and responsibility arising from any reliance placed on the content. Where the content includes any translated material, BMJ does not warrant the accuracy and reliability of the translations (including but not limited to local regulations, clinical guidelines, terminology, drug names and drug dosages), and is not responsible for any error and/or omissions arising from translation and adaptation or otherwise.