Article Text

Abstract
Introduction DNA methylation (DNAme) has been cross-sectionally associated with type 2 diabetes and hemoglobin A1c (HbA1c) in the general population. However, longitudinal data and data in type 1 diabetes are currently very limited. Thus, we performed an epigenome-wide association study (EWAS) in an observational type 1 diabetes cohort to identify loci with DNAme associated with concurrent and future HbA1cs, as well as other clinical risk factors, over 28 years.
Research design and methods Whole blood DNAme in 683 597 CpGs was analyzed in the Pittsburgh Epidemiology of Diabetes Complications study of childhood onset (<17 years) type 1 diabetes (n=411). An EWAS of DNAme beta values and concurrent HbA1c was performed using linear models adjusted for diabetes duration, sex, pack years of smoking, estimated cell type composition variables, and technical/batch covariates. A longitudinal EWAS of subsequent repeated HbA1c measures was performed using mixed models. We further identified methylation quantitative trait loci (meQTLs) for significant CpGs and conducted a Mendelian randomization.
Results DNAme at cg19693031 (Chr 1, Thioredoxin-Interacting Protein (TXNIP)) and cg21534330 (Chr 17, Casein Kinase 1 Isoform Delta) was significantly inversely associated with concurrent HbA1c. In longitudinal analyses, hypomethylation of cg19693031 was associated with consistently higher HbA1c over 28 years, and with higher triglycerides, pulse rate, and albumin:creatinine ratio (ACR) independently of HbA1c. We further identified 34 meQTLs in SLC2A1/SLC2A1-AS1 significantly associated with cg19693031 DNAme.
Conclusions Our results extend prior findings that TXNIP hypomethylation relates to worse glycemic control in type 1 diabetes by demonstrating the association persists over the long term. Additionally, the associations with triglycerides, pulse rate, and ACR suggest TXNIP DNAme could play a role in vascular damage independent of HbA1c. These findings strengthen potential for interventions targeting TXNIP to improve glycemic control in type 1 diabetes through its role in SLC2A1/glucose transporter 1-mediated glucose regulation.
- HbA1c
- Diabetes Mellitus, Type 1
- Epidemiology
- Cohort Studies
Data availability statement
Data are available upon reasonable request. The data analyzed in this study are available from the corresponding author upon reasonable request.
This is an open access article distributed in accordance with the Creative Commons Attribution Non Commercial (CC BY-NC 4.0) license, which permits others to distribute, remix, adapt, build upon this work non-commercially, and license their derivative works on different terms, provided the original work is properly cited, appropriate credit is given, any changes made indicated, and the use is non-commercial. See: http://creativecommons.org/licenses/by-nc/4.0/.
Statistics from Altmetric.com
WHAT IS ALREADY KNOWN ON THIS TOPIC
Methylation at the Thioredoxin-Interacting Protein (TXNIP) locus has been consistently associated with concurrent glycemia and type 2 diabetes in the general population, but long-term data and data in type 1 diabetes are limited.
WHAT THIS STUDY ADDS
Examining HbA1c over the subsequent 28 years after methylation measurement, we demonstrate that hypomethylation at TXNIP is associated with worse long-term glycemic control and with higher triglycerides, pulse rate, and albumin:creatinine ratio independent of HbA1c.
We observed that TXNIP methylation is influenced by variants in SLC2A1, the gene encoding glucose transporter 1, for the first time in type 1 diabetes.
HOW THIS STUDY MIGHT AFFECT RESEARCH, PRACTICE OR POLICY
These results support a role for TXNIP methylation in long-term glycemic control and vascular health and as a promising target for potential adjunctive therapies to insulin in type 1 diabetes.
Introduction
Intensive insulin therapy is critical for preventing complications of type 1 diabetes.1 However, insulin therapy carries its own risks of adverse consequences, most notably hypoglycemia and weight gain. Additionally, despite improvements in insulin analogues and delivery systems, current insulins do not adequately mimic a physiological insulin response.2 Thus, there remains a need to identify new targets for adjunctive therapies to insulin to reduce its adverse effects and improve blood glucose control and stability in type 1 diabetes.
Epigenetic modifications to DNA, including methylation (DNA methylation (DNAme)), are affected by environmental exposures and influence gene expression. DNAme at 5′-cytosine-phosphate-guanine-3′ (CpG) sites is currently the most studied epigenetic modification due to its relative affordability and ease of measurement. DNAme provides a link between genetic susceptibility and risk factor exposure and has potential to be pharmacologically modified3; thus, its study may elucidate novel pathophysiological pathways and intervention targets. DNAme at the Thioredoxin-Interacting Protein (TXNIP) locus has consistently been associated with cross-sectional type 2 diabetes status and HbA1c in a rapidly accumulating body of general population studies; however, prospective data are lacking.4–14 In type 1 diabetes, the Diabetes Control and Complications Trial (DCCT)/Epidemiology of Diabetes Interventions and Complications (EDIC) study recently demonstrated a strong association between hemoglobin A1c (HbA1c) during the DCCT randomized trial period and cg19693031 DNAme in TXNIP.15 However, DCCT excluded individuals with high blood pressure, cholesterol, or more than minimal retinopathy or albuminuria at baseline,16 so it is unclear if their findings apply to populations without risk factor or advanced microvascular complication exclusion. Therefore, given the limited understanding of the relationship between DNAme and glycemia both in general and in type 1 diabetes, we performed an epigenome-wide association study (EWAS) of DNAme and HbA1c in an observational type 1e diabetes cohort, the Pittsburgh Epidemiology of Diabetes Complications (EDC) study, aiming to identify loci with DNAme associated with concurrent HbA1c and future HbA1c over 28 years.
Research design and methods
Study population
The Pittsburgh EDC study is a prospective cohort study of childhood-onset (<17 years old) type 1 diabetes, which has been described in detail.17 All participants (n=658) were diagnosed with type 1 diabetes, or seen within 1 year of diagnosis, at Children’s Hospital of Pittsburgh between 1950 and 1980. Participants were followed up beginning in 1986–1988, with biennial examinations and questionnaires for the first 10 years and thereafter with biennial questionnaires and further examinations in 2004–2006, 2011–2013, and 2016–2018. DNA was collected at study visits between 1988 and 1998: 86% of the DNA specimens were collected at the 1988–1990 visit, 9% at the 1990–1992 visit, and the remaining 5% between 1992 and 1998. The date of each participant’s DNA specimen defines their baseline for these analyses.
DNA methylation (DNAme) arrays, quality control, and data processing
High-molecular weight DNA was isolated from whole blood-derived leukocytes.18 DNA specimens with adequate concentration (>30 ng/µL) and volume (>25 µL) were deemed eligible for DNAme assessment. Specimens were randomly assigned to plate and well position. DNAme was assayed using Illumina Infinium MethylationEPIC BeadChip arrays (Illumina, San Diego, California, USA) at the University of Virginia Center for Public Health Genomics, Genomic Sciences Lab using the standard Illumina methylation array protocol. The technical specifications and validation of the Infinium MethylationEPIC BeadChip have been described in detail.19 The detailed quality control and data processing pipeline is described in the online supplemental materials. Briefly, quality control used methods implemented in two R packages, minfi20 and SeSAMe.21 The final methylation fraction β values for analysis were generated using the following pipeline steps in SeSAMe21: (1) background subtraction based on normal-exponential deconvolution using out of band probes (noob), (2) dye bias correction in the two color channels through non-linear scaling (dyeBiasCorrTypeINorm), (3) probe quality masking based on the curated exclusion list22 (qualityMask), (4) detection masking at individual probe/sample level using pooBAH p value out of band array hybridization (detectionMask), (5) beta calculation, M/M+U (getBetas), and (6) drop samples and probes identified during quality control preprocessing. Of the original 865 918 probes on the array, we dropped a curated exclusion list of 95 92322 and an additional incremental set of 72 868 poor quality probes that had detection rate of <95% in all samples. We further restricted analysis to probes mapped to autosomal chromosomes; thus, 683 597 probes were analyzed.
Supplemental material
Online supplemental figure 1 summarizes the sample quality control results and resulting analytical data set. Of 496 participants who consented to DNA collection, 436 European ancestry participants had suitable quality DNA remaining in 2020 for methylation arrays. After excluding participants not passing methylation quality control (n=11), 1 randomly selected individual from each of 10 first-degree relative pairs, 2 outliers from a previous genetic principal components analysis based on GWAS data23 and 2 duplicate specimens, the final sample with quality methylation data comprised 411 participants.
As the DNA was isolated from whole blood, variable cell-type composition could confound tests of association with outcomes.24 Thus, cell-type compositions (CD8+ T cells, CD4+ T cells, natural killer cells, B cells, monocytes, and neutrophils) were estimated for inclusion as covariates in statistical models using the estimateCellCounts2 function from the R package FlowSorted.Blood.EPIC25 with an IDOL-optimized probe set26 derived from the original Houseman method,27 which has been shown to be an optimal algorithm for cell-type deconvolution in EWAS using whole blood specimens.24 Gene information was obtained from Illumina annotation (March 2020, reference genome GRCh38/hg38).
Glycosylated hemoglobin
HbA1 was measured at five visits (1988–1990, 1990–1992, 1992–1994, 1994–1996, and 1996–1998); HbA1c was measured at three visits (2004–2006, 2011–2013, and 2016–2018). The median number of measures was six per participant. From 1988 to 1998, HbA1 was measured using automated high-performance liquid chromatography (Diamat; Bio-Rad, Hercules, California, USA) and converted to DCCT-aligned HbA1c values using a validated regression equation derived from duplicate assays (DCCT HbA1c=0.14+0.83 (EDC HbA1)).28 At the 2004–2006, 2011–2013, and 2016–2018 visits, HbA1c was measured using the DCA 2000 analyzer (Bayer Healthcare LLC, Elkhart, Indiana, USA) and converted to DCCT-aligned HbA1c with the equation: DCCT HbA1c=(EDC HbA1c−1.13)/0.81.28
Statistical analysis
Epigenome-wide associations and post hoc analyses of significant CpGs
We used linear regression to estimate the cross-sectional association between DNAme probe β value at each CpG site as the dependent variable and baseline HbA1c as the primary independent variable. Three models were fit: model 1 included HbA1c, type 1 diabetes duration, sex, pack years of smoking, estimated cell-type composition variables, plate/run indicator, well position, Green CpC to TpC (GCT) bisulfite score, DNA extraction method, and study visit of DNA collection; model 2 included model 1+first two ancestry principal components from genotyping arrays; and model 3 included model 2+two surrogate variables estimated using the sva function of the SVA package in R29 to account for potential latent sources of variation in addition to the covariates directly adjusted for in model 1. As EDC is an exclusively childhood-onset type 1 diabetes cohort, age and diabetes duration are highly correlated (r=0.86, p<0.0001). Given the aims of our analyses, diabetes duration better reflects the exposure of interest; thus, the results presented here were adjusted for diabetes duration only. However, alternative models were fit, adjusting for age instead of diabetes duration, and results were nearly identical. We applied a Bonferroni-corrected significance level of p<7.31×10⁻⁸ (p=0.05/683 597 CpGs) to determine conservative statistical significance. We also identified CpGs nominally associated with HbA1c using a Benjamini-Hochberg false discovery rate (FDR) of <20%. As the conventional genomic inflation factor λ has been shown to overestimate test statistic inflation in EWAS,30 we also report the Bayesian inflation factor estimated using the bacon method (λ.bacon) developed by van Iterson et al specifically for EWAS.30 In sensitivity analyses to assess the impact of extreme methylation beta values, we repeated analysis of all significant CpGs using robust linear regression.
We performed a second EWAS for longitudinal HbA1c using all available measures over the subsequent 28-year follow-up period. Linear mixed-effects models of the form

were fit for each CpG probe, where y is the postbaseline longitudinal HbA1c for subject s at time t; S0s is the subject-specific random intercept offset, and est is the subject-specific error term. Models were adjusted for baseline HbA1c and covariates included in the Model 3 adjustment described above (denoted as b1X1 through bjXj in the equation). Model residuals were plotted and visually examined to assess fit.
We assessed whether HbA1c-associated CpGs were associated with other clinical characteristics independent of HbA1c. Details regarding ascertainment of clinical variables have been published previously31 and are summarized in the online supplemental materials. For CpGs associated with baseline HbA1c, cross-sectional associations with other clinical variables were modeled individually using linear regression with the clinical factor as the independent variable and methylation β as the dependent variable, adjusting for type 1 diabetes duration, sex, HbA1c, pack years of smoking, and cell-type composition variables. Clinical variables with p values of <0.20 in the individual models were offered to fit a multivariable model using backward selection. Variables with p<0.10 were retained in the final model. For CpGs associated with subsequent longitudinal HbA1c, associations with other longitudinal clinical factors were assessed using linear mixed models with baseline DNAme quartile as the main independent variable and each longitudinal clinical factor as the dependent variable in separate models of the form shown previously. Models were adjusted for time-varying HbA1c, sex, and baseline diabetes duration, pack years of smoking, and cell-type composition variables. Time×DNAme quartile interaction term was used to estimate change in the DNAme–clinical factor association over time.
Identification of methylation quantitative trait loci (meQTLs)
Genotyping was performed in n=453 EDC participants using the Infinium HumanCore Exome-24 BeadChip (Illumina), following the manufacturer’s protocol. As previously described,32 after quality control and exclusions, quality genotyping data were available for a total of n=422. Minimac3/Minimac3 omp V.1.0.14 was used for imputation, with the 1000 Genomes (1 kg) phase 3 V.5 reference panel (updated October 20, 2015). To identify potential meQTLs, we performed a GWAS for each CpG that was significantly associated with HbA1c in the n=411 with available methylation data. In each GWAS, methylation β values were modeled as the dependent variable and single nucleotide polymorphism (SNP) dosage (additive coding) as independent variables in separate linear models, adjusting for sex, type 1 diabetes duration, the first three ancestry principal components, and estimated cell type composition variables. SNPs with p<5×10⁻⁸ were identified as meQTLs for the corresponding CpG. Results were compared with the Genetics of DNA Methylation Consortium (GoDMC) database of meQTLs33 for external validation. We examined the overlap between significant meQTLs and expression quantitative trait loci (eQTLs) reported in the Genotype-Tissue Expression (GTEx) project. GTEx was supported by the Common Fund of the Office of the Director of the National Institutes of Health and by the National Cancer Institute (NCI), National Human Genome Research Institute (NHGRI), National Heart, Lung, and Blood Institute (NHLBI), National Institute on Drug Abuse (NIDA), National Institute of Mental Health (NIMH), and National Institute of Neurological Disorders and Stroke (NINDS). The data used here were obtained from the GTEx Portal on February 25, 2022. Plots of the meQTL genomic regions were made using LocusZoom.34
Mendelian randomization
We used two-sample Mendelian randomization to examine a potential causal association between DNAme and HbA1c for CpGs with significant meQTLs. Analyses were performed using the MR-Base R package TwoSampleMR V.0.5.6.35 Using the clump_data function with the default r2=0.001, we identified independent representative SNPs from the set of GoDMC meQTLs to use as the instrumental variable (IV). The estimated association between the IV and HbA1c was obtained using summary data from the Meta-Analysis of Glucose and Insulin-related traits Consortium,36 comprising 46 368 individuals of European descent, via the IEU Open GWAS Project database.35 The causal effect between DNAme and HbA1c was estimated using the Wald ratio.
Results
Differential methylation and HbA1c cross-sectional EWAS
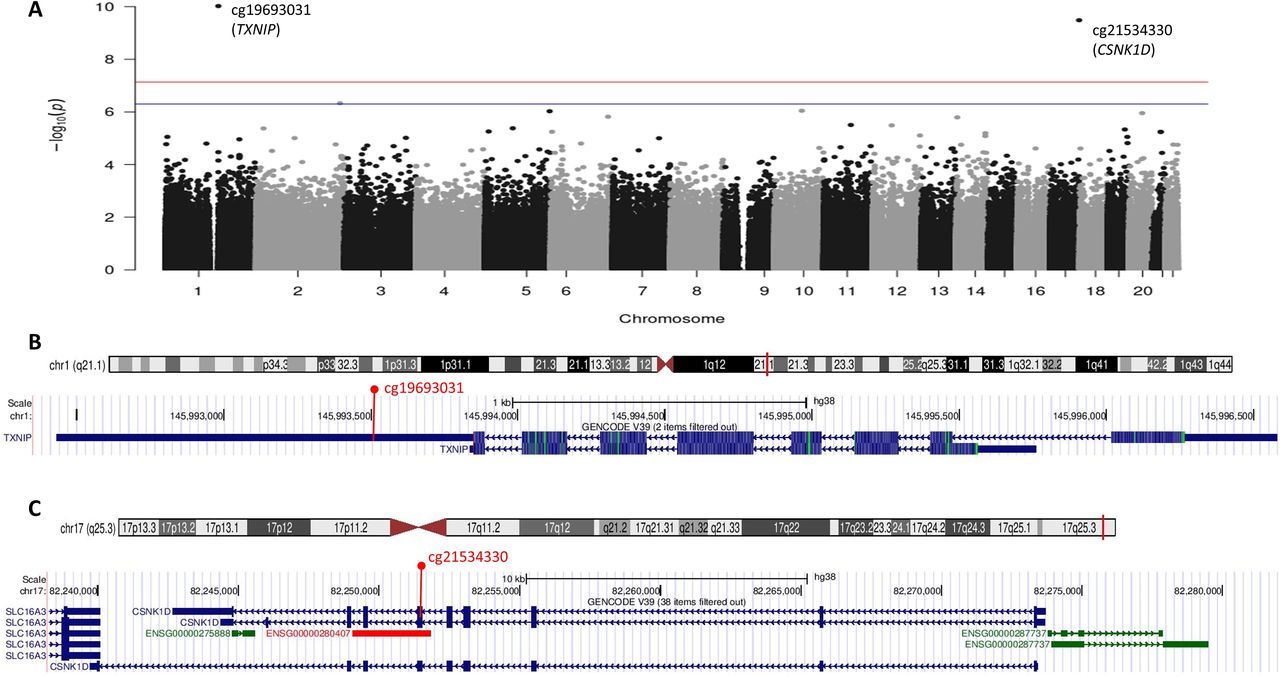
Baseline characteristics are shown in online supplemental table 1. A Manhattan plot for the cross-sectional EWAS with baseline HbA1c (final model 3 adjustment) is in figure 1. Methylation at two CpGs (cg19693031 in TXNIP on chromosome 1 and cg21534330 in Casein Kinase 1 Isoform Delta (CSNK1D) on chromosome 17) were significantly, inversely associated with cross-sectional baseline HbA1c (table 1). Results were nearly identical for model 1 and model 2 adjustments (data not shown). QQ plots for the three models are shown in online supplemental figure 2. The traditional genomic inflation factor showed some evidence of inflation (λmodel1=1.33, λmodel2=1.26, λmodel3=1.30), but bacon-estimated inflation factors were close to 1 (bacon λbacon_model1=1.09, λbacon_model2=0.97, λbacon_model3=0.92); thus, bacon-estimated FDRs are shown in table 1.

Manhattan plot of epigenome-wide associations of DNA methylation with baseline HbA1c in the Epidemiology of Diabetes Complications cohort and gene track plots for significant 5′-cytosine-phosphate-guanine-3′s. (A) Manhattan plot; the red line marks the epigenome-wide significance level p<7.31e-08; the blue line marks the suggestive significance level corresponding to false discovery rate of <20%. (B) Ideogram and gene track plot for the TXNIP region of chromosome 1 with cg19693031 annotated in red. (C) Ideogram and gene track plot for the CSNK1D region of chromosome 17 with cg21534330 annotated in red. TXNIP, Thioredoxin-Interacting Protein. CSNK1D, Casein Kinase 1 Isoform Delta.
CpGs associated with cross-sectional HbA1c at FDR of <20% in the EDC study
Methylation β-value distributions for cg19693031 and cg21534330 are shown in online supplemental figure 3. Further examination of the model residuals for cg21534330 (online supplemental figure 4) showed five participants with extreme methylation β values. Scatter plots of cg19693031 and cg21534330 methylation β values by HbA1c are shown in online supplemental figure 5. Four of the five participants with extreme cg21534330 methylation β values also had HbA1c >95th percentile for the cohort (ie, >12.3% (111 mmol/mol)), suggesting they may represent biological extremes. To assess the impact of these extreme values, we repeated the analysis of cg21534330 and HbA1c using robust linear regression and observed attenuation of the association (regression β±SE=−0.0017±0.0006, p=0.0034). Of the other GpGs with an FDR of <20%, results were unchanged after repeating the analysis using robust linear regression, except for cg17238830 (β=−0.0021±0.0007, p=0.0012) and cg03167712 (β=−0.0030±0.0008, p=0.0001).
Differential methylation and longitudinal HbA1c EWAS
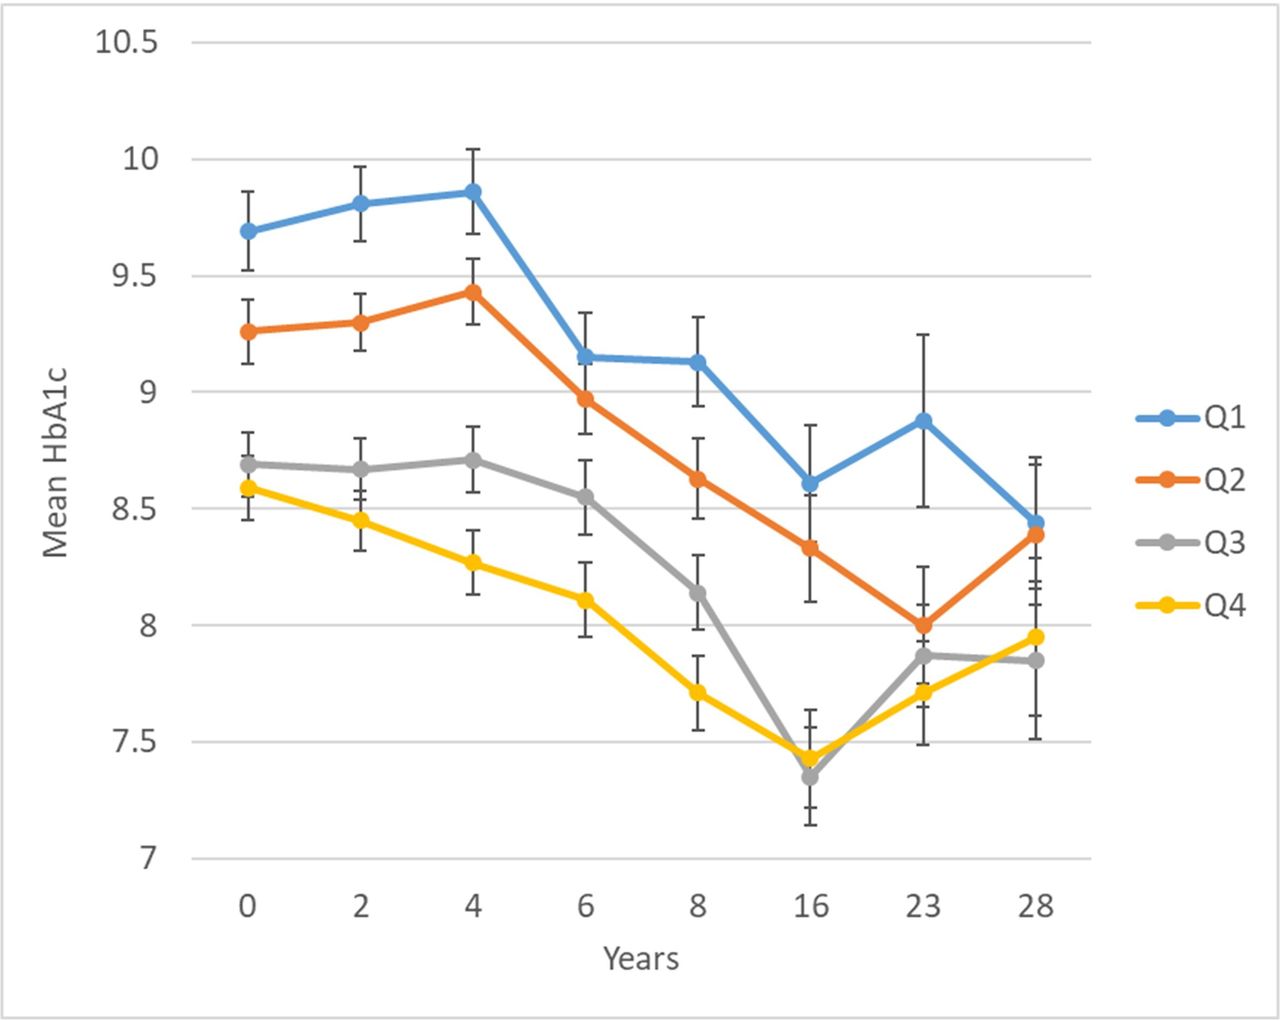
In a longitudinal EWAS, methylation of cg19693031 in TXNIP was significantly inversely associated with HbA1c, such that each 5% greater methylation at baseline was associated with −0.20 (SE=0.03) lower mean HbA1c over 28 years (table 2). Methylation at 11 other CpGs had suggestive associations with longitudinal HbA1c at an FDR of <20%, including two additional CpGs in TXNIP (cg02988288, bacon FDR=0.03; cg26974062, bacon FDR=0.18). Plots of residuals did not suggest evidence of poor fit or influential observations. Figure 2 shows longitudinal HbA1c by quartiles of cg19693031 methylation. There was no evidence that the association between cg19693031 methylation and HbA1c changed over time (methylation×time interaction p=0.30).

Twenty-eight year longitudinal HbA1c by quartile of baseline cg19693031 DNA methylation in the Epidemiology of Diabetes Complications cohort. cg19693031 quartiles: Q1=0.3971–0.6801, Q2=0.6802–0.7393, Q3=0.7394–0.7912, and Q4=0.7913–0.9191.
CpGs associated with longitudinal HbA1c at FDR of <20% in the EDC study
Methylation quantitative trait loci
Thirty-four variants in linkage disequilibrium (LD) in SLC2A1 (1p34.2), the gene encoding glucose transporter 1 (GLUT1), and SLC2A1-AS1 were significantly associated with cg19693031 methylation, as were two variants in ADRA1A (8p21.2) (online supplemental figure 6 and online supplemental table 2). Locus zoom plots for the respective genomic regions are shown in online supplemental figure 7. The same 34 SLC2A1/SLC2A1-AS1 variants were also significant meQTLs for cg19693031 in the GoDMC database, along with an additional 114 variants (95 SNPs and 19 insertion–deletion mutations) in the same genomic region (data accessed February 25, 2022). Of the 34 cg19693031 meQTLs identified in SLC2A1/SLC2A1-AS1, 32 were also reported to be whole blood eQTLs in GTEx (data accessed February 25, 2022). There were 15 meQTLs identified for cg21534330 (CSNK1D) in the EDC cohort (online supplemental table 3); however, none were meQTLs for cg21534330 in GoDMC.
Mendelian randomization
Using the cg19693031 meQTLs, we performed two-sample magnetic resonance (MR) to assess a potential causal association between cg19693031 DNAme and HbA1c. Of the 129 SNPs that were meQTLs for cg19693031 in GoDMC, rs12718444 was selected as the representative SNP for the LD block after clumping and used as the IV. There was no evidence of a causal effect of cg19693031 on HbA1c (β=0.0085±0.0091, p=0.351). In further exploratory analyses in EDC, there was no association between rs12718444 and HbA1c (β per T allele=0.016±0.144, p=0.911) and no evidence of interaction between rs12718444 genotype and cg19693031 DNAme with respect to HbA1c (interaction p=0.920) in EDC.
TXNIP methylation and other clinical characteristics
Online supplemental table 4 shows regression coefficients for clinical characteristics and cg19693031 methylation, independent of HbA1c. After adjusting for HbA1c, diabetes duration, sex, pack years of smoking, and estimated cell type composition, higher baseline triglycerides and pulse rate were significantly (p<0.05) associated with cg19693031 hypomethylation. In the final multivariable model, lower cg19693031 DNAme was significantly, independently associated only with higher pulse rate (p=0.009).
Associations between cg19693031 methylation and longitudinal measures of clinical risk factors independent of HbA1c are shown in online supplemental table 5. After adjusting for HbA1c, diabetes duration, sex, pack years of smoking, and estimated cell type composition, the variables significantly associated with cg19693031 were total cholesterol, non-HDLc, triglycerides, pulse rate and natural log transformed albumin:creatinine ratio (ln(ACR)). After full adjustment for all other significant clinical factors, associations between cg19693031 and triglycerides, pulse rate, and ln(ACR) remained significant (figure 3 and online supplemental table 5). For ln(ACR), there was a marginal cg19693031×time interaction (p=0.07) such that the association between cg19693031 DNAme and ln(ACR) strengthened over time.

Twenty-eight year longitudinal triglycerides (A), pulse rate (B), and ACR (natural log transformed) (C) by quartile of baseline cg19693031 DNA methylation in the EDC cohort. cg19693031 quartiles: Q1=0.3971–0.6801, Q2=0.6802–0.7393, Q3=0.7394–0.7912, and Q4=0.7913–0.9191. ACR, albumin:creatinine ratio.
Discussion
Our results confirm prior findings that hypomethylation cg19693031 in TXNIP is cross-sectionally associated with higher HbA1c in type 1 diabetes. Additionally, we now extend those findings by demonstrating that cg19693031 hypomethylation is associated with consistently worse HbA1c over the subsequent 28 years. Furthermore, lower cg19693031 methylation was cross-sectionally associated with higher pulse rate independent of HbA1c, and longitudinally associated with triglycerides, pulse rate, and albumin:creatinine ratio (ACR) over 28 years, independently of HbA1c. These glycemia-independent risk factor associations suggest a more general role of TNXIP in metabolic control and vascular disease beyond its role in glucose metabolism. Finally, we observed cg19693031 methylation is influenced by variants in the SLC2A1 locus, the gene encoding GLUT1, for the first time in a type 1 diabetes cohort. Our findings support further exploration into targeting TXNIP to improve glycemic control through its role in GLUT1-mediated glucose transport/homeostasis.
The follow-up period of our longitudinal analysis includes a time of rapid adoption of intensive diabetes therapy following the DCCT results in 1993,37 which is clearly reflected here in the decreasing trajectory of HbA1c after years 4–6 (corresponding to 1992–1994 and 1994–1996, respectively, for 98% of the cohort). As shown in figure 2, while there was a similar relative improvement in HbA1c regardless of cg19693031 methylation, in those with lower cg19693031 methylation, higher absolute HbA1c persisted. TXNIP is known to play a key role in regulating both insulin-independent (GLUT1) and insulin-dependent (GLUT4) glucose transport by promoting GLUT endocytosis under high-glucose conditions.38 Our findings support the hypothesis that the association between TXNIP DNAme and HbA1c is primarily independent of insulin (ie, via GLUT1) by our identification of significant meQTLs for cg19693031 methylation in SLC2A1, as well as our observation that the association between TXNIP cg19693031 and HbA1c persisted despite intensification of insulin regimen over the follow-up period.
Our results are consistent with prior studies in the general population reporting cg19693031 as the differentially methylated CpG most strongly associated with type 2 diabetes, fasting blood glucose, and HbA1c.2–12 In DCCT/EDIC, the only other study reporting an EWAS of DNAme and HbA1c in type 1 diabetes to date, cg19693031 also had the strongest association with HbA1c.15 Our finding that cg19693031 DNAme remains consistently associated with HbA1c over the long term extends and solidifies the role of TXNIP DNAme in regulating glycemia in type 1 diabetes. We also identified 34 meQTLs in SLC2A1/SLC2A1-AS1, which we were able to externally validate in GoDMC, strongly supporting the hypothesis that SLC2A1 is involved in epigenetic regulation of TXNIP. Intriguingly, in DCCT/EDIC, only one trans-meQTL on chromosome 16 was associated with cg19693031 DNAme. The differences in meQTLs between the two studies could reflect differences between the two cohorts in genetic composition or exposure to other risk factors, as DCCT had key exclusion criteria, including hypertension, hypercholesterolemia, and advanced microvascular disease, while EDC had minimal exclusion criteria.31
Without DNAme measures prior to type 1 diabetes onset, we cannot definitively determine the direction of the cg19693031–HbA1c association. The association between TXNIP DNAme and glycemia is not diabetes-specific, as the association has also been observed in the non-diabetes range of blood glucose.39 Therefore, it is possible that exposures prior to type 1 diabetes onset (eg, during fetal development or early childhood), interact with genetic variants, such as SLC2A1, to influence TXNIP DNAme. While our MR analysis did not support a causal association between TXNIP DNAme and HbA1c, there is in vitro evidence that hyperglycemia induces changes in TXNIP DNAme.15 On the other hand, the role of TXNIP as a key glucose regulator and our observation that TXNIP hypomethylation is associated with sustained poor glycemic control over the long term suggests that it may also contribute to hyperglycemia. Thus, the association between glycemia and TXNIP DNAme may be bidirectional, where early hyperglycemia induces TXNIP hypomethylation, leading to impaired TXNIP function or reduced TXNIP expression which, in turn, impedes subsequent achievement of optimal glycemic control even with more intensive diabetes therapy.
Our observation of HbA1c-independent associations between TXNIP methylation and triglycerides, pulse rate, and ACR suggests a more general role for TXNIP methylation in metabolic control and vascular pathogenesis beyond glucose regulation. Prior research in TXNIP knockout mice showed a similar association with higher resting heart rate due to significantly increased myocardial glucose uptake with TXNIP deletion.40 TXNIP has also been shown to play a key role in angiogenesis in response to tissue injury via vascular endothelial growth function regulation.41 In epidemiological data, DCCT/EDIC found significant associations between cg19693031 DNAme eGFR decline over follow-up, adjusting for baseline, but not longitudinal, HbA1c.15 Though we did not observe a statistically significant association between methylation of cg19693031 in TXNIP and longitudinal eGFR in the current study, we did observe a strong association with ACR, suggesting a role for TXNIP DNAme in microvascular damage that is independent of HbA1c. All together, these findings support the need for more research into potential therapeutic targeting of TXNIP to reduce vascular complications in diabetes.
DNAme of cg21534330 in CSNK1D, the gene encoding CK1δ, was also significantly associated with cross-sectional HbA1c in our study, but the association was driven by a small number of participants with both extreme low DNAme values and high HbA1c and not consistently maintained in longitudinal analyses. It may therefore be a spurious finding and should be interpreted with caution. Inhibition of CK1δ has been shown to affect glucose homeostasis and metabolic regulation in animal models of obesity,42 so there is a plausible mechanism for the association between cg21534330 DNAme and HbA1c, but more research is needed to confirm this finding.
Our study has many strengths, including the use of data from a well-characterized, exclusively type 1 diabetes cohort with long-term follow-up to assess longitudinal HbA1c. The EDC cohort has been shown to be epidemiologically representative of the childhood-onset type 1 diabetes population of Allegheny County, Pennsylvania.43 44 We have incorporated genotyping array data to assess meQTLs and validated them in a database of a large-scale meta-analysis of international cohorts and using GTEx. Limitations of our study include the use of whole blood for DNAme. We also used a standard method27 to account for potential confounding by blood cell-type composition. The use of HbA1c as a measure of glycemic exposure has known limitations.45 HbA1c represents the approximate average glucose exposure over the preceding 3 months. It captures both fasting and postprandial glucose levels; thus, it does not account for glucose variability and is also influenced by erythrocyte characteristics. Future research using continuous glucose monitoring could improve understanding of the SLC2A1–TXNIP relationship to glycemia in type 1 diabetes. Another limitation is the lack of long-term glucose exposure data prior to DNAme assessment. Finally, a further limitation is that the EDC cohort is 98% white, a result of the combination of the demographics of Allegheny County, Pennsylvania (<15% black/African–American), historically lower incidence of type 1 diabetes among black individuals,46 and institutional/ structural conditions that have reduced research participation in non-white groups. Furthermore, glycation of hemoglobin has been shown to differ by race, with HbA1c overestimating true glucose exposure in black persons.47 Thus, our results may not apply to more diverse populations, and more research in non-white populations is critically needed.
Conclusions
We have demonstrated that methylation of CpGs in TXNIP is associated with subsequent long-term HbA1c, as well as triglycerides, pulse rate, and ACR independently of HbA1c, for the first time in type 1 diabetes. While more research is needed to resolve the question of whether these relationships are causal, our findings nonetheless strengthen the potential for interventions targeting TXNIP to improve glycemic control, particularly through insulin-independent SLC2A1/GLUT1-mediated glucose regulation.
Data availability statement
Data are available upon reasonable request. The data analyzed in this study are available from the corresponding author upon reasonable request.
Ethics statements
Patient consent for publication
Ethics approval
This study involves human participants and was approved by the University of Pittsburgh institutional review board (approval number 19040065). The participants gave informed consent to participate in the study before taking part.
Acknowledgments
We thank the Epidemiology of Diabetes Complications study participants and staff for their invaluable contributions and dedication to this research for over 30 years.
References
Supplementary materials
Supplementary Data
This web only file has been produced by the BMJ Publishing Group from an electronic file supplied by the author(s) and has not been edited for content.
Footnotes
Contributors RGM and TJO designed the study. RGM, TJO, and TC contributed to acquisition of funding and data. SO-G oversaw methylation array processing. JCM performed the methylation data processing and quality control. RGM conducted the statistical analyses, drafted the manuscript, and is the guarantor of this work. RGM, JCM, SO-G, TJO, and TC interpreted the data. All authors edited and critically reviewed the manuscript for intellectual content and approved the final version.
Funding The parent EDC study was supported by the National Institute of Diabetes and Digestive and Kidney Diseases at the National Institutes of Health (grant number R01-DK034818) and the Rossi Memorial Fund. The EDC DNA methylation sub-study is supported by the American Diabetes Association (grant number 1-19-JDF-109). The funding agencies were not involved in study design, data collection, data analysis, manuscript preparation or publication decisions.
Competing interests None declared.
Provenance and peer review Not commissioned; externally peer reviewed.
Supplemental material This content has been supplied by the author(s). It has not been vetted by BMJ Publishing Group Limited (BMJ) and may not have been peer-reviewed. Any opinions or recommendations discussed are solely those of the author(s) and are not endorsed by BMJ. BMJ disclaims all liability and responsibility arising from any reliance placed on the content. Where the content includes any translated material, BMJ does not warrant the accuracy and reliability of the translations (including but not limited to local regulations, clinical guidelines, terminology, drug names and drug dosages), and is not responsible for any error and/or omissions arising from translation and adaptation or otherwise.