Article Text

Abstract
Introduction This study’s objective was to produce robust, comparable estimates of the prevalence of diabetes and pre-diabetes in the Sri Lankan adult population, where previous studies suggest the highest prevalence in South Asia.
Research design and methods We used data on 6661 adults from the nationally representative 2018/2019 first wave of the Sri Lanka Health and Ageing Study (SLHAS). We classified glycemic status based on previous diabetes diagnosis, and either fasting plasma glucose (FPG), or FPG and 2-hour plasma glucose (2-h PG). We estimated crude and age-standardized prevalence of pre-diabetes and diabetes and by major individual characteristics weighting the data to account for study design and subject participation.
Results Crude prevalence of diabetes in adults was 23.0% (95% CI 21.2% to 24.7%) using both 2-h PG and FPG, and age-standardized prevalence was 21.8% (95% CI 20.1% to 23.5%). Using only FPG, prevalence was 18.5% (95% CI 7.1% to 19.8%). Previously diagnosed prevalence was 14.3% (95% CI 13.1% to 15.5%) of all adults. The prevalence of pre-diabetes was 30.5% (95% CI 28.2% to 32.7%). Diabetes prevalence increased with age until ages ≥70 years and was more prevalent in female, urban, more affluent, and Muslim adults. Diabetes and pre-diabetes prevalence increased with body mass index (BMI) but was as high as 21% and 29%, respectively, in those of normal weight.
Conclusions Study limitations included using only a single visit to assess diabetes, relying on self-reported fasting times, and unavailability of glycated hemoglobin for most participants. Our results indicate that Sri Lanka has a very high diabetes prevalence, significantly higher than previous estimates of 8%–15% and higher than current global estimates for any other Asian country. Our results have implications for other populations of South Asian origin, and the high prevalence of diabetes and dysglycemia at normal body weight indicates the need for further research to understand the underlying drivers.
- epidemiology
- longitudinal studies
- diabetes mellitus, type 2
Data availability statement
Data are available on reasonable request. Data may be obtained from a third party and are not publicly available. The study data were provided by the SLHAS Consortium, which has adopted an Open Data policy which will provide access to SLHAS Wave 1 data from 2024, on application to the Consortium by interested researchers. The specific data file used for this paper can be shared on reasonable request to the corresponding author after then, and the underlying data will likely be included in the SLHAS Wave 1 public data release.
This is an open access article distributed in accordance with the Creative Commons Attribution Non Commercial (CC BY-NC 4.0) license, which permits others to distribute, remix, adapt, build upon this work non-commercially, and license their derivative works on different terms, provided the original work is properly cited, appropriate credit is given, any changes made indicated, and the use is non-commercial. See: http://creativecommons.org/licenses/by-nc/4.0/.
Statistics from Altmetric.com
WHAT IS ALREADY KNOWN ON THIS TOPIC
Previous studies suggest that diabetes prevalence in Sri Lanka is the highest in South Asia and is associated with increased living standards, urban residence, and higher body mass index (BMI), but no internationally comparable estimates from any robust, national survey covering all adults have been published.
WHAT THIS STUDY ADDS
Adult prevalence of diabetes was 23% in Sri Lanka in 2019, and pre-diabetes was 30%, significantly higher than previous estimates have suggested.
Most of the increase in diabetes and pre-diabetes prevalence with BMI occurs in Sri Lankan adults of “normal weight” as classified using WHO’s Asian BMI cut-offs.
HOW THIS STUDY MIGHT AFFECT RESEARCH, PRACTICE OR POLICY
Our findings suggest that the Asian BMI cut-offs are not adequate to capture the increased risk of diabetes in Sri Lankans and probably in other South Asians and underline the increased risk of diabetes in these populations at low body weights.
Our findings reinforce the need for increased research to understand the drivers of increased diabetes risk in South Asian populations and for increased efforts to tackle diabetes and underlying drivers such as weight gain in Sri Lanka.
Introduction
Diabetes is a growing cause of global mortality and morbidity and a driver of healthcare costs. Global studies by the NCD Risk Factor Collaboration (NCD-RisC) and the International Diabetes Federation (IDF) indicate that diabetes in low and middle-income countries (LMICs) is increasing faster than in high-income countries (HICs), with age-standardized prevalence in most developing regions higher than in HICs.1 2 Such studies report that age-standardized diabetes prevalence is highest in Pacific Island countries (≥20%), followed by the Middle East (≥15%). South Asia and Malaysia are areas with rapidly increasing diabetes prevalence, with recent estimates suggesting prevalence rates approaching those in Oceania.3 4 But estimates for many Asia-Pacific countries suffer from limitations including reliance on modeling to fill data gaps, and methodological deficiencies in field surveys,5 and there are few nationally representative surveys of South Asian countries.6
Sri Lanka is an LMIC of 21 million people in South Asia which is experiencing rapid transformations, including aging, obesity, increasing affluence, and urbanization. Diabetes is a priority in national health policy.7 8 Previous studies indicate rising diabetes prevalence, with estimates of 2%–6% during the 1990s and 8%–15% in the 2000s–2010s.9 But most studies surveyed only certain age groups or areas and used inconsistent measures limiting comparability, and Sri Lanka lacks robust national estimates.
This study aimed to estimate diabetes and pre-diabetes prevalence in the adult population of Sri Lanka, using a nationally representative population survey covering all age groups, and methods comparable with those used in global reference studies.1 10 11
Methods
Study design and participants
We used data from the first wave of the Sri Lanka Health and Ageing Study (SLHAS) conducted from mid-November 2018 to mid-November 2019. The SLHAS is a national longitudinal cohort study approved by the Ministry of Health (MOH), Sri Lanka, and managed by a consortium of the Institute for Health Policy, University of Colombo, University of Peradeniya, University of Ruhuna, and the University of Rajarata.
The SLHAS Wave 1 used stratified, multistage probability sampling to recruit a nationally representative sample of the non-institutionalized adult (≥18 years) population of Sri Lanka, details of which have been described previously.12 The study design treated all 14 014 Grama Niladhari Divisions (GNDs)—the smallest administrative unit in Sri Lanka—as primary sampling units (PSUs). These were stratified by district, residential sector, and quantile of area socioeconomic status (ASES). The ASES ranking of GNDs was generated using principal component analysis (PCA) of social and economic indicators for each GND derived from the 2012 national population census and obtained from the Department of Census and Statistics (DCS).12 13 Two or more PSUs were then selected from each stratum by probability-proportionate-to-size. Within each PSU, households were sampled systematically, and within households, one eligible adult (defined as currently resident, age ≥18 years, not pregnant, and able to give informed consent) was randomly selected with age weighting designed to achieve a smooth age distribution. If the individual refused participation, the whole household was excluded.
Fieldwork was staggered within provinces to minimize seasonal bias. Participating subjects attended a nearby field clinic, typically a MOH clinic, in the morning, where they underwent an interview and examination, including blood tests. Individuals with mobility limitations were interviewed at home. All data were collected using a Computer-Assisted Personal Interviewing application running on computer tablets.
Out of 10 689 sampled households, 10 062 agreed to participate, 6627 selected adults attended a field clinic, and 41 completed home interviews, giving an effective response rate of 65.0%. Response rates were higher in women (69%), adults aged ≥45 years (74%), rural residents (70%), and known diabetics (73%), based on the analysis of data collected during field recruitment.
The Sri Lanka Medical Association Ethical Review Committee approved the study (ERC/18-022). Study information was provided to all participants, together with an official letter from MOH encouraging participation, and all participants gave informed written consent.
Measures and procedures
Participants were requested to fast for 12 hours prior to clinic attendance. On clinic arrival and having given informed consent, a venous blood sample for glucose was taken. Those who did not report being diabetic, had fasted, had provided an initial fasting blood glucose sample, and who consented underwent an oral glucose tolerance test (OGTT) by taking glucose monohydrate equivalent to 75 g of anhydrous glucose in 300 mL of water within a period of 10 min, followed by a second venous blood sample after 2 hours (±15 min). To standardize OGTT doses, the study commissioned prefilled bottles from a local manufacturer, and the time of each blood sample was logged, with subjects not meeting the stipulated time windows excluded.
Blood for glucose estimation was collected into sodium fluoride/potassium oxalate tubes and kept in a cooler at 4°C–8°C, before centrifuging at the field clinic to separate the plasma. Samples were stored within 6–10 hours of initial collection in a field freezer at −40°C to −20°C for transport to the study’s laboratory at the Medical Research Institute in Colombo. Glucose assay was performed by GOD-PAP (glucose oxidase-phenol amino phenazone) enzymatic method using a Rx Daytona+Clinical Chemistry Analyzer (Randox Laboratories, Crumlin, UK), with a coefficient of variation of 4.5% during the study period, which was within the acceptable range as evaluated by the manufacturer’s external quality assurance scheme (RIQAS, Randox International Quality Assessment Scheme).
For 79 subjects (67 of whom were not diagnosed as diabetics), a faulty batch of Vacutainer tubes resulted in insufficient sample to assay plasma glucose (PG). For these, the PG equivalent value was imputed by linear regression of PG values against serum glucose values that had been separately collected for participants attending the relevant session. Blood was also collected for glycated hemoglobin (HbA1c) assay, but limited funds meant that this was only performed for subjects with known diabetes, those who did not fast, and a small random subsample of others, with remaining samples biobanked for future testing.
Height was measured using a Seca 240 cm height measure (Seca, Hamburg, Germany) to the nearest 0.1 cm. Weight was measured using an OMRON BF511 Body Composition Monitor to the nearest 0.1 kg. Body mass index (BMI) was calculated as weight (kilogram) divided by the square of height (m2). BMI categories are defined using the WHO cut-offs in this paper (underweight <18.5; normal 18.5–24.9; overweight 25.0–29.9; obese ≥30 kg/m2), but we also report results using the WHO Asian BMI categories (underweight < 18.5; normal 18.5–22.9; overweight 23.0–24.9; obese ≥25 kg/m2). Waist circumference measurement was collected from participants using a Seca 200 cm tape measure at the level of the natural indent of the trunk during expiration.
The participant interview collected information about personal and household characteristics and reviewed personal medical records and medicines that the participants were requested to bring. Personal medical records consisted of written notes and other documents held by patients that they obtain from their providers, including personal logbooks that some clinics provide. Medicines were coded to the WHO Anatomical Therapeutic Chemical (ATC) classification, with antidiabetic medications identified as medicines in ATC classes A10A (insulins) and A10B (oral hypoglycemics). A measure of relative socioeconomic status (SES) was derived from PCA of participant-reported information on household assets,13 with the first principal components used to rank and group participants into SES quantile groups (online supplemental text S1).
Supplemental material
Definitions
We defined individuals as having diagnosed diabetes if having a positive history as evidenced by self-report or explicit mention of a diagnosis in their medical notes or the use of antidiabetic medication. Following the 2022 American Diabetes Association (ADA) guidelines,14 we defined new cases of diabetes (undiagnosed diabetes) on the basis of satisfying either or both of the following criteria: (1) fasting plasma glucose (FPG) ≥126 mg/dL (7.0 mmol/L) and (2) 2-hour plasma glucose during OGTT (2-h PG) of ≥200 mg/dL (11.1 mmol/L); and we defined pre-diabetes as either impaired fasting glucose (IFG) (FPG of 100 mg/dL (5.6 mmol/L) to 125 mg/dL (6.9 mmol/L)) or impaired glucose tolerance (IGT) (2-h PG of 140 mg/dL (7.8 mmol/L) to 199 mg/dL (11.0 mmol/L)). We defined dysglycemia as either pre-diabetes or diabetes.
Prevalence estimation
The SLHAS Wave 1 data come with design weights to make the sample representative of the adult population of Sri Lanka. The basic procedure has been described previously.12 In brief, non-response weights were generated by modeling the propensity to participate as a function of characteristics recorded during recruitment, including whether self-reporting as diabetic. These were then adjusted to the age–sex population structure of strata, districts, and provinces to generate poststratification design weights. Finally, weights were calibrated in successive steps using iterative proportional fitting (IPF) to match the strata, age–sex, ethnic and sector structure of the population at district, province, and then national levels. This was done as Muslims were under-represented in the original sample, which could bias prevalence estimates,12 and since reference data on ethnic proportions were only available in aggregate at the district level, necessitating approaches such as IPF.15 For this study, the base weights for the eligible sample were again calibrated using IPF at increasing levels of aggregation from stratum to national level to match the 2019 population totals for strata, age–sex groups, sectors, and ethnicity. For age-standardized estimates, we recalibrated these to match the WHO standard population.16
We further modified the weights for the different subsamples involved in prevalence estimation. Out of 5487 subjects who did not have diagnosed diabetes, valid FPG values were obtained for 5351 (98%), with most exclusions due to failure to fast ≥9 hours. These are referred to as the FPG subsample. Valid 2-h PG values were obtained for 3653 subjects (67% of the FPG subsample) who lacked a previous diabetes diagnosis and had fasted, with losses mostly due to the insufficient clinic time or refusals to take the OGTT; these are referred to as the OGTT subsample. Naively combining these using their standard weights with the diagnosed diabetes subsample would lead to the overestimation of prevalence and ignore potential non-random test participation. Consequently, each subject’s weight was multiplied by a propensity weight for test participation, generated for each subsample by logistic modeling of participation as a function of individual characteristics including age, sex, BMI, SES, hypertension, and blood test values including total and low-density lipoprotein-cholesterol (and FPG in case of the OGTT subsample). Adapting the method used by NCD-RisC and by previous analyses of US National Health and Nutrition Examination Survey (NHANES) data,1 11 the resulting weights for the FPG and OGTT subsamples were recalibrated so that their sums matched the weight totals by age–sex groups and ethnicity for all subjects who did not have a prior diabetes diagnosis. This ensured that the final weighted samples matched the overall national population in 2019 and minimized biases arising from non-random test participation.
When making prevalence estimates at provincial and district levels, the weighting procedure described above was modified to generate province-specific and district-specific weights by matching to the age, sex, and ethnic profiles at the province or district level. Although we measured HbA1c in some subjects who had not fasted, we did not use HbA1c to classify diabetic status in these, as overall numbers were too small to support robust reweighting and because of known differences in sensitivity and specificity compared with OGTT and FPG.14
We estimated the prevalence using the final weights, accounting for the clustered sampling design with a finite population correction and estimating variances using Taylor linearization. We used Wald tests to test whether differences in proportions were significantly different from zero, using the df that reflected the complex sample design. A p-value <0.05 was considered statistically significant. All analyses were performed using Stata V.17.0 (Stata, College Station, Texas, USA), and we followed the Strengthening the Reporting of Observational Studies in Epidemiology (STROBE) guidelines in reporting the study.
Results
Characteristics and classification of participants
We excluded three individuals aged <18 years, and four with missing data on their previous diabetic status, leaving 6661 participants (99%) for analysis. Their mean age (±SD) was 50.1 (±17.2) years, 3396 (51.0%) were women, and 603 (9.2%) were obese (BMI ≥30 kg/m2) (online supplemental table S1). Younger adults and Muslims were under-represented, but after weighting the sample matched the national population on age, sex, ethnicity, sector, and area and household SES quantiles (online supplemental table S1).
Subject selection and classification are summarized in online supplemental figure S1. Out of the total sample, 1170 (17.6%) self-reported a previous diabetes diagnosis or were taking antidiabetic medication, of whom 14 (1.2%) were taking insulin. Of the remaining sample, that is those who did not self-report a diabetes diagnosis and were not taking antidiabetic medication (n=5491), only 356 (6%) provided medical notes (compared with 68% of those who did self-report a diagnosis or were taking antidiabetic medication). From these, only an additional four individuals (1%) were identified as having a diabetes diagnosis solely based on their medical notes, yielding a total of 1174 individuals with a previous diagnosis. FPG was obtained for an additional 5351 subjects, of which OGTT was also obtained in 3653. This allowed diabetes status to be assessed in 6525 subjects using previous diagnosis and FPG and in 4827 subjects using previous diagnosis and OGTT (and FPG). FPG newly identified 271 subjects (4.1%) as diabetic, and OGTT 353 (5.3%), of which 147 were also classified as diabetic using FPG.
Participants in the OGTT differed significantly from those who were eligible but did not take the test when assessed using multivariate logit regression. Characteristics significantly associated with higher participation included being aged 30–49 years, living in rural or estate areas, speaking Tamil, being interviewed at home, being normal or overweight, having higher systolic blood pressure, and being a smoker (all p<0.01), while being aged 80 years or more was associated with lower participation (p<0.001).
Diagnosed diabetes
The estimated weighted crude prevalence of diagnosed diabetes in adults aged ≥18 years in 2019 was 14.3% (table 1). Prevalence increased with age, peaking at the age of 60–69 years (29.8%), with a decline at older ages. It was higher in women (15.3%) than in men (13.2%; p<0.02), higher in Muslims (29.0%) than in Sinhalese (12.4%; p<0.001) and Tamils (14.7%; p<0.001), and in urban (24.7%) than in rural (11.9%; p<0.001) and estate (4.6%; p<0.001) sectors. Prevalence increased with household SES and was highest in the Western, Northern, and Eastern provinces (online supplemental table S2).
Crude prevalence of previously diagnosed diabetes, undiagnosed diabetes, total diabetes, and proportion of total diabetes that is undiagnosed in Sri Lankan adults,SLHAS 2018/2019
Undiagnosed diabetes
The prevalence of undiagnosed diabetes in all adults was 4.2% using FPG and almost double using OGTT (7.5%). The combined prevalence of total undiagnosed diabetes using both FPG and OGTT was 8.7% (table 1). Total undiagnosed diabetes increased with age, peaking in those aged 60–69 years, and was higher in women than men (p<0.002). It increased with BMI, with differences between each BMI category highly significant (p<0.003). Prevalence was significantly higher in Muslims than Tamils (p<0.05) but otherwise did not differ significantly with ethnicity and household SES.
Total diabetes
The overall crude prevalence of diabetes, including both diagnosed and undiagnosed diabetes (detected by FPG or OGTT), in adults aged ≥18 years in 2019 was 23.0% (95% CI 21.2% to 24.7%) (table 1). Using FPG alone, total diabetes prevalence was 18.5% (95% CI 17.1% to 19.8%). Age-standardized prevalence was 21.8% (95% CI 20.1% to 23.5%) and 17.4% (95% CI 16.0% to 18.7%) if using FPG alone.
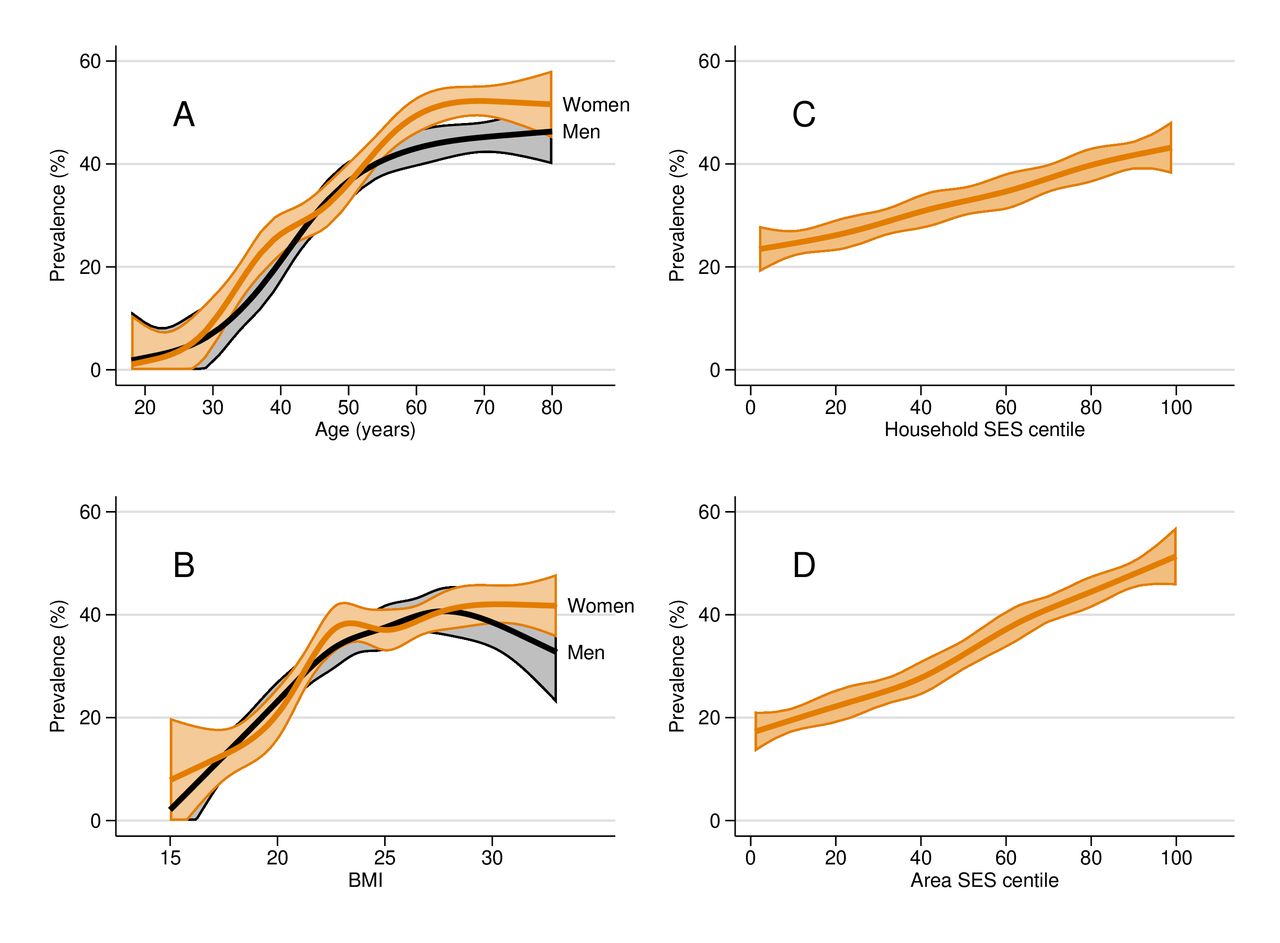
Crude prevalence increased with age, peaking at 43% in those aged 60–69 years and was higher (p<0.001) in women (25.5%) than in men (20.1%). The age-sex specific trajectories as estimated using restricted cubic splines were similar across sexes, except prevalence was higher in women aged 30–40 years and >50 years (figure 1). Point estimates by sex and age group are visualized in online supplemental figure S2 and tabulated in online supplemental table S3. Prevalence increased with BMI, being lower in the underweight (6.8%) than in those of normal weight (20.6%; p<0.001), and higher in the overweight and obese than those of normal weight (p<0.001 for both). The male and female gradients of diabetes with BMI were similar (figure 1), and in both sexes, the largest increase occurred at BMI levels below 23 kg/m2, which is the upper cut-off for normal weight using the Asian BMI categorization.

Profiles of total diabetes prevalence in Sri Lankan adults by age, body mass index (BMI), and household and area socioeconomic status (SES) centiles, Sri Lanka Health and Ageing Survey (SLHAS) 2018/2019. Notes: Total diabetes comprises those with known diabetes and those newly diagnosed using fasting plasma glucose or oral glucose tolerance test. Panels shows smoothed profiles of total diabetes with respect to: (A) age and sex; (B) BMI; (C) centiles of household SES; and (D) centiles of area SES. Profiles estimated using the weighted data for participants aged 18–85 years by fitting restricted cubic splines with six knots to allow for non-linear relationships. Shaded regions denote 95% CIs.
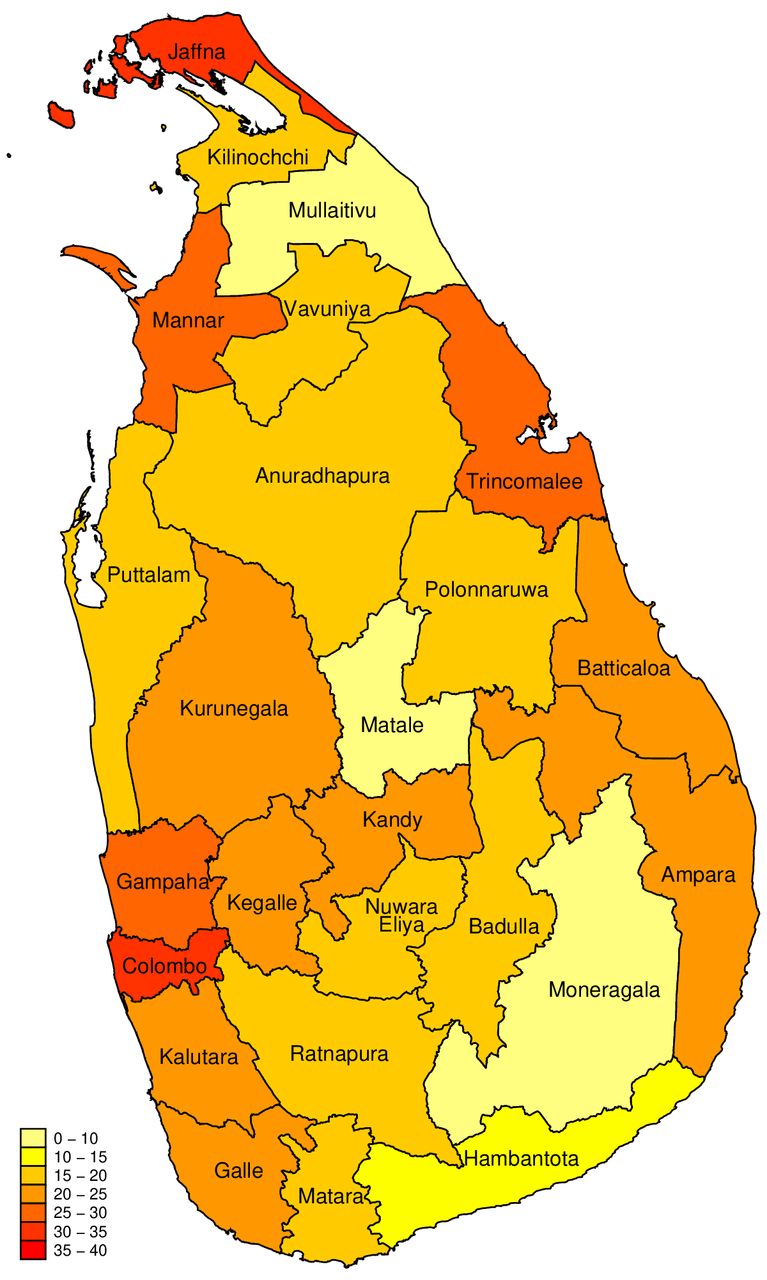
Prevalence was higher in Muslims (40.8%) than other ethnic groups (p<0.001), and in urban (35.8%) than the rural sectors (20.4%, p<0.001), which was higher than in the estate sector (9.6%, p=0.09). Prevalence increased with household SES from 19.9% in the poorest quintile to 28.9% in the richest quintile. However, prevalence increased more steeply in relation to area SES (figure 1) increasing from 14.6% in the least developed to 31.3% in the most developed tertile. Prevalence was highest in the most urbanized, economically developed southwestern region of the country, and in the northern and eastern regions (figure 2). Prevalence doubled at the provincial level from 16% in Uva to 29% in the Western Province (online supplemental table S2), and across districts from 8.0% in Matale to 34.1% in Colombo and 30.8% in Jaffna (online supplemental table S4).

Total diabetes prevalence in Sri Lankan adults by district SLHAS 2018/2019. Notes: Total diabetes comprises those with known diabetes and those newly diagnosed using fasting plasma glucose or oral glucose tolerance test. Estimates are weighted as described in text to match the Sri Lankan adult population in each district in 2019 with respect to age, sex, ethnicity, and area socioeconomic development. SLHAS, Sri Lanka Health and Ageing Study.
Proportion of undiagnosed total diabetes
Among people with diabetes, 37.7% (95% CI 34.0% to 41.4%) were undiagnosed. This was higher in age groups <50 years compared with older ones (p<0.05 for all), but not significantly different between men and women. Compared with the urban sector (31.1%), the proportions undiagnosed were higher in the rural (41.7%; p<0.01) and estate (52.1%; p<0.001) sectors. They were lower in the most developed area SES tertile (31.5%) than the middle (42.1%; p<0.05) and least developed (44.6%; p<0.01), but differences between household SES quintiles were not significant.
Pre-diabetes
Pre-diabetes assessed using IFG was 23.2% (95% CI 21.3% to 25.1%) and using IGT was 18.9% (95% CI 17.0% to 20.8%) in adults (≥18 years) in 2019 (table 2). IFG increased with age (18–29 years: 13.3% versus ≥80 years: 38.7%), but IGT exhibited no relationship with age. IFG was higher in men (25.2%) than in women (21.4%; p<0.01), but IGT was less in men (14.4%) than in women (22.9%; p<0.001). Both IFG and IGT increased with BMI, but the increase was steeper with IGT than with IFG.
Crude prevalence of IFG, IGT, total pre-diabetes, and total diabetes and pre-diabetes in Sri Lankan adults, SLHAS 2018/2019
Using both IFG and IGT, overall pre-diabetes prevalence was 30.5% (95% CI 28.2% to 32.7%) in adults. Prevalence was lower in those aged 18–29 years (21.7%) than older age groups and was similar in men (30.3%) and women (30.7%). Prevalence was lower in Tamils (25.6%) and Muslims (26.4%) than in Sinhalese (31.9%; p<0.02), but otherwise there were no significant differences across ethnic groups, sectors of residence, household SES quintiles, area SES tertiles, and provinces (online supplemental table S5). Overall prevalence increased with BMI and was significantly lower in the underweight (21.4%) than in those of normal weight (29.4%; p<0.01), and significantly higher in the obese (42.4%) than in the overweight (32.2%; p<0.003).
Overall dysglycemia
An estimated 53.4% (95% CI 50.8% to 56.1%) of Sri Lankan adults had dysglycemia in 2019 (table 2). Prevalence rose with age, peaking at 74.2% in those aged 60–79 years. It was higher in women (56.2%) than men (50.4%; p<0.02); in Muslims (67.2%) than Sinhalese (52.8%) and Tamils (47.2%) (p<0.001 for both); and in the urban (64.1%) than rural sector (51.6%; p<0.001), which was higher than the estate sector (32.2%; p<0.01) (online supplemental table S5). Dysglycemia prevalence increased with household SES quintile from 50.1% in the poorest quintile to 59.9% in the richest quintile. The increase with BMI was steeper from 28.2% in the underweight to 62.1% in the overweight category (p<0.001 across all comparisons).
Concordance of FPG and OGTT classification
In the OGTT subsample subjects that were not known diabetics and who had both FPG and OGTT results (n=3653), FPG newly diagnosed 200 and OGTT newly diagnosed 353 as diabetic. Having appropriately weighted each subsample, both tests concurred in classifying 3.3% of adults as undiagnosed diabetes prevalence, but the OGTT test separately identified three times the additional prevalence (4.1%) as FPG (1.2%), consistent with OGTT having higher sensitivity.10 11 Overall, total diabetes prevalence based on combining both FPG and OGTT (23.0%) was 4.5% higher than prevalence based only on FPG (18.5%), and 1.2% higher than relying on OGTT alone (21.8%).
When estimating prevalence using the sample of adults that had no prior diabetes diagnosis that was jointly assessed with both tests to identify undiagnosed diabetes, there was considerable concordance in classifying adults as undiagnosed diabetes or normal. Of those classified as having undiagnosed diabetes using FPG, 73.3% (95% CI 61.1% to 85.6%) would be classified as diabetic using OGTT, and of those classified as normal using FPG, 79.1% (95% CI 76.8% to 81.3%) would be classified as normal using OGTT. There was less concordance on IFG, with OGTT classifying only 32.2% (95% CI 27.3% to 37.1%) as IGT and 12.1% (95% CI 9.4% to 14.8%) as diabetic. However, in the latter group, the weighted mean HbA1c was 5.8% (40 mmol/mol) in subjects (n=135) with this data, within the normal range. This replicates similar findings from US NHANES data11 and helps explain the lower pre-diabetes prevalence and higher undiagnosed diabetes prevalence obtained with OGTT.
Discussion
We estimated that 23.0% of Sri Lankan adults in 2019 had diabetes, using both FPG and OGTT for detection (14.3% previously diagnosed and 8.7% undiagnosed), and an estimated 53% of adults had dysglycemia overall. Consistent with the literature,1 11 17 OGTT revealed higher prevalence than using FPG alone (18.5%).
Diabetes prevalence increased with age before declining at ≥70 years and was higher in women than men at most ages. It increased with BMI with little sex difference in the profiles by BMI, which suggests that the higher prevalence in women may be mostly driven by higher BMI. The largest increase took place at BMI levels of 18–22 kg/m2, and prevalence was high (diabetes 18%; pre-diabetes 28%) even in those classified as normal weight using the Asian BMI cut-offs (BMI: 18.5–22.9 kg/m2). This suggests that even the more conservative Asian BMI cut-offs may not adequately capture the known increased risk of diabetes at lower body weight in Sri Lankan and South Asian populations,6 and points to the potential need for a South Asian-specific BMI categorization instead of the current Asia-Pacific one.
Diabetes (and overall dysglycemia) prevalence was higher in urban and more socioeconomically developed areas and increased with SES. Our finding that the gradient in diabetes prevalence was steeper with our area measure of SES than with our household measure points to the potential importance of environmental pathways. Diabetes and dysglycemia prevalence were substantially higher in Muslims, consistent with a higher prevalence of factors associated with metabolic syndrome, including overweight and hypertension.12 18 19 Given potential confounding between different characteristics, such as gender, age, ethnicity, and SES, further analysis is needed to assess the relative and independent role of critical risk factors and to identify targets for intervention.
Our estimated crude prevalence of 23% and age-standardized prevalence of 17% (using FPG only) are significantly higher than the most recent IDF and NCD-RisC modeled estimates for Sri Lanka of 7%–11%.1 2 However, they are consistent with field surveys at the local level in Sri Lanka,18 20–23 considering differences in age and geographic coverage, and diagnostic definitions, including a 2018 survey24 that reported a prevalence of 29.4% (95% CI 25.5% to 33.3% (CI not adjusted for the complex survey design)) in Western Province versus our estimate of 28.9% (95% CI 26.2% to 35.3%). While our findings are specific to Sri Lanka, which has no previous reliable prevalence survey covering all areas and ages, it raises the possibility that IDF and NCD-RisC estimates systematically underestimate the prevalence in South Asia and in other countries with substantial populations of South Asian descent.
We found that more than one-third of Sri Lankan adults with diabetes were not diagnosed despite ready access to healthcare services. Levels of underdiagnosis were highest in the poorest and youngest Sri Lankans, in women, and in those living in estate areas and the least developed areas, which points to potential disparities in service provision and access.
Key strengths of this study are that it uses both FPG and OGTT to assess dysglycemia; covers all demographics and districts in Sri Lanka; employed trained, field staff using standard procedures to collect data; examined subjects suffering from mobility limitations at home; and maintained a robust cold chain to transfer samples from field to laboratory.
Although the overall non-response rate in the SLHAS is substantial (only 65% of households identified for potential screening yielded participants who completed full interviews, almost all of whom also consented to examination), this is comparable to the final examination rates achieved in other comparable national health interview and examination surveys, including the Sri Lanka STEPS survey (63%), the US NHANES (~50%), the US Health and Retirement Study (HRS: <73% in adults aged 50+ years), and the Survey of Health, Ageing and Retirement in Europe (SHARE: <61% in adults aged 50+ years).25–28 Further, the overall sample is generally well-balanced by age, sex, ethnicity, and SES. We also accounted for potential sampling bias arising from general non-response by weighting the data across several dimensions including a propensity weighting step that considered data collected at the time of initial recruitment, and we accounted for the complex survey design when making estimates.
An additional limitation with representativeness is that one-third (33%) of eligible subjects did not take the OGTT, and overall participation was not random in relation to several observable characteristics, including known diabetic status, possibly driven by the attraction of free laboratory tests. However, we explicitly adjusted for potential bias including subject participation in the OGTT component, which many studies do not, with a propensity-weighting adjustment for test participation that accounted for several characteristics including other biomarkers, followed by a general reweighting on sociodemographic characteristics to match the overall adult population.
Other limitations include the inability to differentiate between insulin and non-insulin-dependent diabetes, relying on self-reported fasting times, and using only a single test of subjects. ADA guidelines require a repeat test to confirm a diabetes diagnosis, so prevalence estimates may be overstated, although most epidemiological surveys use only one test for practical reasons. The limited availability of HbA1c values prevented us from using these to strengthen our analysis.
Notwithstanding these limitations, this study provides the first robust estimates of diabetes prevalence in Sri Lanka using nationally representative data covering all ages and all districts of Sri Lanka and adds to the limited empirical data on prevalence in South Asian countries other than India.6 It provides separate estimates using FPG and OGTT, and profile variation in prevalence across the population, allowing the comparison to previous local and global studies.
Our findings identify Sri Lanka as a global hotspot for diabetes, having the highest diabetes prevalence in South Asia. Taking the NCD-RisC global estimates for 2014 as a reference,1 which use FPG as the basis for prevalence, Sri Lanka has higher age-standardized prevalence than any other country with the exception of Pacific Island hotspots and some countries in the Middle East. This is not surprising given that the relative risk of diabetes in South Asian populations is known to be high,5 6 and recent estimates of comparable diabetes prevalence in Tamil Nadu3—the Indian state closest to Sri Lanka and one with considerable cultural and ethnic similarities. The high prevalence in Sri Lanka may be due to it being the most affluent nation in South Asia with the highest rates of overweight and obesity.6 Comparable high rates estimated for Mauritius (IDF 2021 estimate 22.6%; NCD-RisC 2014 estimate 13.0%), whose population is two-thirds South Asian in origin, and whose per capita income is more than twice that of Sri Lanka, and our finding of a socioeconomic gradient in prevalence in Sri Lanka suggests that Sri Lanka’s diabetes epidemic reflects both relative affluence and factors intrinsic to South Asian populations. Regardless of the reasons, Sri Lanka faces a large and increasing burden from diabetes, requiring concerted action to tackle underlying drivers such as weight gain and to mitigate morbidity and health systems consequences.
Data availability statement
Data are available on reasonable request. Data may be obtained from a third party and are not publicly available. The study data were provided by the SLHAS Consortium, which has adopted an Open Data policy which will provide access to SLHAS Wave 1 data from 2024, on application to the Consortium by interested researchers. The specific data file used for this paper can be shared on reasonable request to the corresponding author after then, and the underlying data will likely be included in the SLHAS Wave 1 public data release.
Ethics approval
This study involves human participants and was approved by Sri Lanka Medical Association Ethical Review Committee (ERC/18-022). Participants gave informed consent to participate in the study before taking part.
Acknowledgments
The authors thank their MOH colleagues, who facilitated the SLHAS, especially Dr S. Sridharan, Deputy Director General (Planning), and MOH regional staff who supported logistics; Owen O’Donnell for his comments on the manuscript; and Navodi Hakmanage and Jinidu Senarathna for assistance in preparing the manuscript.
References
Supplementary materials
Supplementary Data
This web only file has been produced by the BMJ Publishing Group from an electronic file supplied by the author(s) and has not been edited for content.
Footnotes
Collaborators SLHAS Collaborators: Vajira H W Dissanayake.
Contributors RPR-E, NWi, PP, AG, HMMH, SD, SS, BP, and the other SLHAS Collaborators conceived, designed, and managed the study. YK, US, NS, and CP contributed to management of data acquisition and with other SLHAS Collaborators to study design, with RJ managing laboratory testing and supporting anthropometric measurement. RPR-E, NWi, PP, NG, CS, IS, YK, and NWe performed statistical analysis and drafted the manuscript, and RJ, HMMH, AG, NWe, SD, SS, NS, BP, and the other SLHAS Collaborators contributed to revising the manuscript’s intellectual content. All authors read and approved the final version of the manuscript and have agreed to authorship and order of authorship. RPR-E is the guarantor.
Funding This study was supported by the Swiss Agency for Development Cooperation and the Swiss National Science Foundation through the Swiss Programme for Research on Global Issues for Development (r4d programme) by the grant “Inclusive Social Protection for Chronic Health Problems” (grant no 400640_160374) and by the Institute for Health Policy Public Interest Research Fund (grant no PIRF-2018-02).
Map disclaimer The inclusion of any map (including the depiction of any boundaries therein), or of any geographic or locational reference, does not imply the expression of any opinion whatsoever on the part of BMJ concerning the legal status of any country, territory, jurisdiction or area or of its authorities. Any such expression remains solely that of the relevant source and is not endorsed by BMJ. Maps are provided without any warranty of any kind, either express or implied.
Competing interests None declared.
Provenance and peer review Not commissioned; externally peer reviewed.
Supplemental material This content has been supplied by the author(s). It has not been vetted by BMJ Publishing Group Limited (BMJ) and may not have been peer-reviewed. Any opinions or recommendations discussed are solely those of the author(s) and are not endorsed by BMJ. BMJ disclaims all liability and responsibility arising from any reliance placed on the content. Where the content includes any translated material, BMJ does not warrant the accuracy and reliability of the translations (including but not limited to local regulations, clinical guidelines, terminology, drug names and drug dosages), and is not responsible for any error and/or omissions arising from translation and adaptation or otherwise.