Article Text

Abstract
Introduction C-peptide has been reported to provide renoprotective effects. This study aims to explore the relationship between C-peptide and progression of renal function in patients with type 2 diabetes mellitus (T2DM).
Research design and methods We retrospectively collected clinical data from 854 T2DM patients over a median follow-up of 5 years. Renal events included an annual decline in estimated glomerular filtration rate (eGFR), a rapid kidney function decline and a renal composite endpoint. A linear mixed-effects model and Cox regression analysis were used to investigate the effect of C-peptide on renal events, and a subgroup analysis was performed after stratification by risk factors.
Results The highest-level C-peptide group had a smaller annual eGFR decline compared with those in the group with the lowest level (p<0.05). Higher levels of 2 h postprandial C-peptide (2hPCP) (adjusted HR 0.53; 95% CI 0.31 to 0.92), difference between 2 h postprandial and fasting C-peptide (ΔCP) (adjusted HR 0.39; 95% CI 0.22 to 0.69), and 2 h postprandial C-peptide-to-glucose ratio (PCGR) (adjusted HR 0.44; 95% CI 0.24 to 0.82) were independently related to a decreased risk for the renal composite endpoint. 2hPCP <2.92 ng/mL, ΔCP <1.86 ng/mL, and PCGR <1.11 significantly increased the risk of progression in kidney function (adjusted HRs <0.50, p<0.05) among T2DM patients with male sex, an age of <65 years old, a disease course of <10 years, an glycosylated hemoglobin value of ≥7%, or a history of hypertension.
Conclusions Higher levels of 2hPCP, ΔCP and PCGR could protect T2DM patients from renal progression, especially in the aforementioned population with diabetes.
- Diabetes Complications
- Diabetes Mellitus, Type 2
- Kidney Diseases
- Kidney Failure, Chronic
Data availability statement
Data are available on reasonable request.
This is an open access article distributed in accordance with the Creative Commons Attribution Non Commercial (CC BY-NC 4.0) license, which permits others to distribute, remix, adapt, build upon this work non-commercially, and license their derivative works on different terms, provided the original work is properly cited, appropriate credit is given, any changes made indicated, and the use is non-commercial. See: http://creativecommons.org/licenses/by-nc/4.0/.
Statistics from Altmetric.com
WHAT IS ALREADY KNOWN ON THIS TOPIC
Previous studies have confirmed the renoprotective effects of C-peptide.
WHAT THIS STUDY ADDS
We performed a retrospective cohort study to explore the relationship between C-peptide and its adjusted indexes and renal progression in type 2 diabetes mellitus.
HOW THIS STUDY MIGHT AFFECT RESEARCH, PRACTICE OR POLICY
This study confirmed that higher levels of 2-hour postprandial C-peptide-related indexes could delay renal progression in T2DM, and monitoring that index may be beneficial for prediction of and early intervention in the progression of kidney disease.
Introduction
Diabetes mellitus (DM) is rapidly spreading as a chronic metabolic disease, and 463 million adults (20–79 years old) are affected worldwide1; 90% of DM cases are type 2 diabetes mellitus (T2DM). Diabetic kidney disease (DKD) is a common and serious chronic microvascular complication of T2DM that leads to 30%–50% of end-stage renal disease (ESRD) worldwide,2 and the prevalence of DKD among individuals with diabetes in the Chinese population is approximately 20%–40%.3 However, current treatment for DKD has little effect on reducing its morbidity and mortality. KDIGO guidelines in 2013 recommended that the severity of DKD should be assessed from the estimated glomerular filtration rate (eGFR) and urinary albumin4; in particular, eGFR decline is even more pronounced with the development of DKD, so it is of great importance to explore the influencing factors of eGFR decline in T2DM. C-peptide, a peptide composed of 31 amino acids that is released by pancreatic β-cells in the same molar ratio as insulin into the blood, is generally used in monitoring β-cell function medically. It has been widely reported in recent years to have bioactivity to protect kidney function. Multiple studies in the 1990s have confirmed5–13 that C-peptide therapy improved renal function in T1DM patients. Possible mechanisms14 include the regulation of nitric oxide synthase activity, the activation of Na+-K+-ATPase, the regulation of transcription factor NF-κB, the reduction in free radical generation and the activities of endothelial cells and monocytes. Thus, C-peptide may also exert renoprotective effects on type 2 diabetic nephropathy. Serum C-peptide levels were negatively correlated with nephropathy in a T2DM cross-sectional study.15 Another cross-sectional study from South Korea revealed that low levels of fasting or ΔC-peptide correlated with a greater risk of DKD.16 Xu et al17found that C-peptide therapy effectively prevented nephropathy in T2DM rats by reducing fibronectin expression at the mRNA, protein and tissue levels. However, none of those studies have reported the relationship between C-peptide and renal function progression in T2DM. Therefore, in this retrospective cohort study, we aimed to explore the association of C-peptide with the progression of renal function in patients with T2DM.
Materials and methods
Study population
The establishment of the sample size for this study was determined as follows: the incidence of DKD in DM was 20%,3 the OR value of DKD in the low-level C-peptide group was approximately 1.61,16 and the significance level and efficacy of the tests were set as 0.05 (α=0.05) and 80% (1-β=0.8), respectively. Moreover, the expected follow-up attrition rate (10%) was taken into account. The minimum sample size required for this study was 223 patients, which was determined by the statistical formula shown below:

This study was a single-center retrospective cohort study. Patients admitted to the Third Xiangya Hospital of Central South University from 2009 to 2017 were selected for baseline measurements, and the follow-up ended in December 2021. Inclusion criteria were as follows: meeting the diagnostic criteria for T2DM18 and at least one follow-up visit including a serum creatinine (SCr) test in our hospital within 4–6 years from baseline. Exclusion criteria were as follows: type 1 diabetes, secondary diabetes or other special types of diabetes; diabetic ketoacidosis, hyperosmolar hyperglycemic syndrome or other acute complications of diabetes; malignant tumours; eGFR <60 mL/min/1.73 m2 or kidney disease or urinary tract disease caused by other factors; severe heart or liver dysfunction; infectious diseases; serious mental illness; and breast feeding or pregnancy.
Clinical data
The following basic information was collected: age, sex, height, weight, systolic and diastolic blood pressure (SBP and DBP), diabetes duration, history of hypertension, and insulin treatment status. Serum measurements included glycosylated hemoglobin (HbA1c) values, fasting and 2-hour postprandial glucose (fasting blood glucose (FBG) and 2hPBG) concentrations, fasting and 2-hour postprandial insulin (fasting insulin (FINS) and 2hPINS) concentrations, fasting and 2 hour postprandial C-peptide (FCP and 2hPCP) concentrations, blood urea nitrogen (BUN) concentrations, SCr concentrations, uric acid (UA) concentrations, urine microalbumin (UMAlb) concentrations, total cholesterol (TC) concentrations, triglyceride (TG) concentrations, and high-density and low-density lipoprotein cholesterol (HDL and LDL) concentrations. Calculated indexes included body mass index (BMI; weight/square of height); the homeostatic model assessment of β-cell function (HOMA-β; 20* FINS/(FBG −3.5), which is typically 100%, with lower levels indicating more severe β-cell function damage); the difference between 2-hour postprandial and fasting C-peptide (ΔCP; 2hPCP-FCP); the C-peptide indexes corrected for glucose concentrations19 (fasting C-peptide-to-glucose ratio (FCGR; (FCP/FBG[mg/dL])*100; 2-hour postprandial C-peptide-to-glucose ratio (PCGR; (2hPCP/2hPBG[mg/dL])*100); and eGFR, which was evaluated by the 2009 Chronic Kidney Disease Epidemiology Collaboration equation20 as follows: eGFR decline rate = (eGFR at follow-up − eGFR at baseline)/eGFR at baseline *100%. Data were collected at the follow-up visit and included the duration from baseline to the follow-up visit, SCr and eGFR, which was calculated as before.
Main renal events
Annual eGFR decline was estimated by a linear mixed-effects model; rapid kidney function decline (RKFD) was defined as an eGFR decline rate >30%21 22; and the renal composite endpoint included the doubling of SCr concentrations, ESRD (eGFR <15 mL/min/1.73 m2) or an eGFR decline rate >50%.
Statistical analysis
Continuous variables that obeyed a normal distribution are described as the mean±SD, and those with a skewed distribution are shown as the median (IQR). Categorical variables are expressed as numbers (proportions). Comparisons of baseline characteristics between the non-rapid kidney function decline (NRKFD) and RKFD groups were performed by using t-tests or Wilcoxon rank-sum tests for continuous variables and χ2 tests for categorical variables. Linear mixed-effects models were used to evaluate the associations of FCP, 2hPCP and their corrected C-peptide indexes with the change in eGFR over time. A Cox proportional hazard (PH) model was used to estimate the HRs for renal composite endpoint events of each C-peptide-related index tertile, and then PH assumptions were conducted. If the PH test was not met, we established a non-proportional risk Cox regression model with time-dependent covariates for subsequent analysis. Restricted cubic spline (RCS) curves based on multivariable Cox regression were used to explore the cut-off values of C-peptide that significantly affected the renal composite endpoint. Additionally, we performed a subgroup analysis by multivariable Cox regression after stratification by sex, age, diabetes duration, HbA1c, and history of hypertension. In all of the previous multivariate analyses, variables that were clinically or statistically significant in the univariate analysis for outcomes or effecting the level of C-peptide confirmed by previous studies23 were chosen as confounding factors, including age, sex, diabetes duration, BMI, SBP, TG, TC, UA, eGFR at baseline, UMAlb, HbA1c, FBG, and history of insulin treatment, but in the subgroup analysis, the stratified factors were no longer taken into account as covariates. A result with a p value <0.05 was considered to be statistically significant.
Statistical analyses were performed using IBM SPSS (V.24.0, IBM Corp), Stata (StataCorp 2014, Stata Statistical Software: Release 14, StataCorp LP) and R (V.4.1).
Results
Changes in renal function at follow-up
A total of 854 T2DM participants from the Third Xiangya Hospital of Central South University were enrolled in the clinical trial and were followed up for a median of 5 years (figure 1). The eGFR decreased from baseline in 645 (75.5%) participants, and 90 (10.5%) participants experienced a more than 50% decrease in eGFR. Seventy-two (8.4%) patients had doubled SCr concentrations, and 32 (3.7%) entered ESRD. Rapid renal function decline and renal composite endpoint events occurred in 179 (21.0%) and 95 (11.1%) participants, respectively.
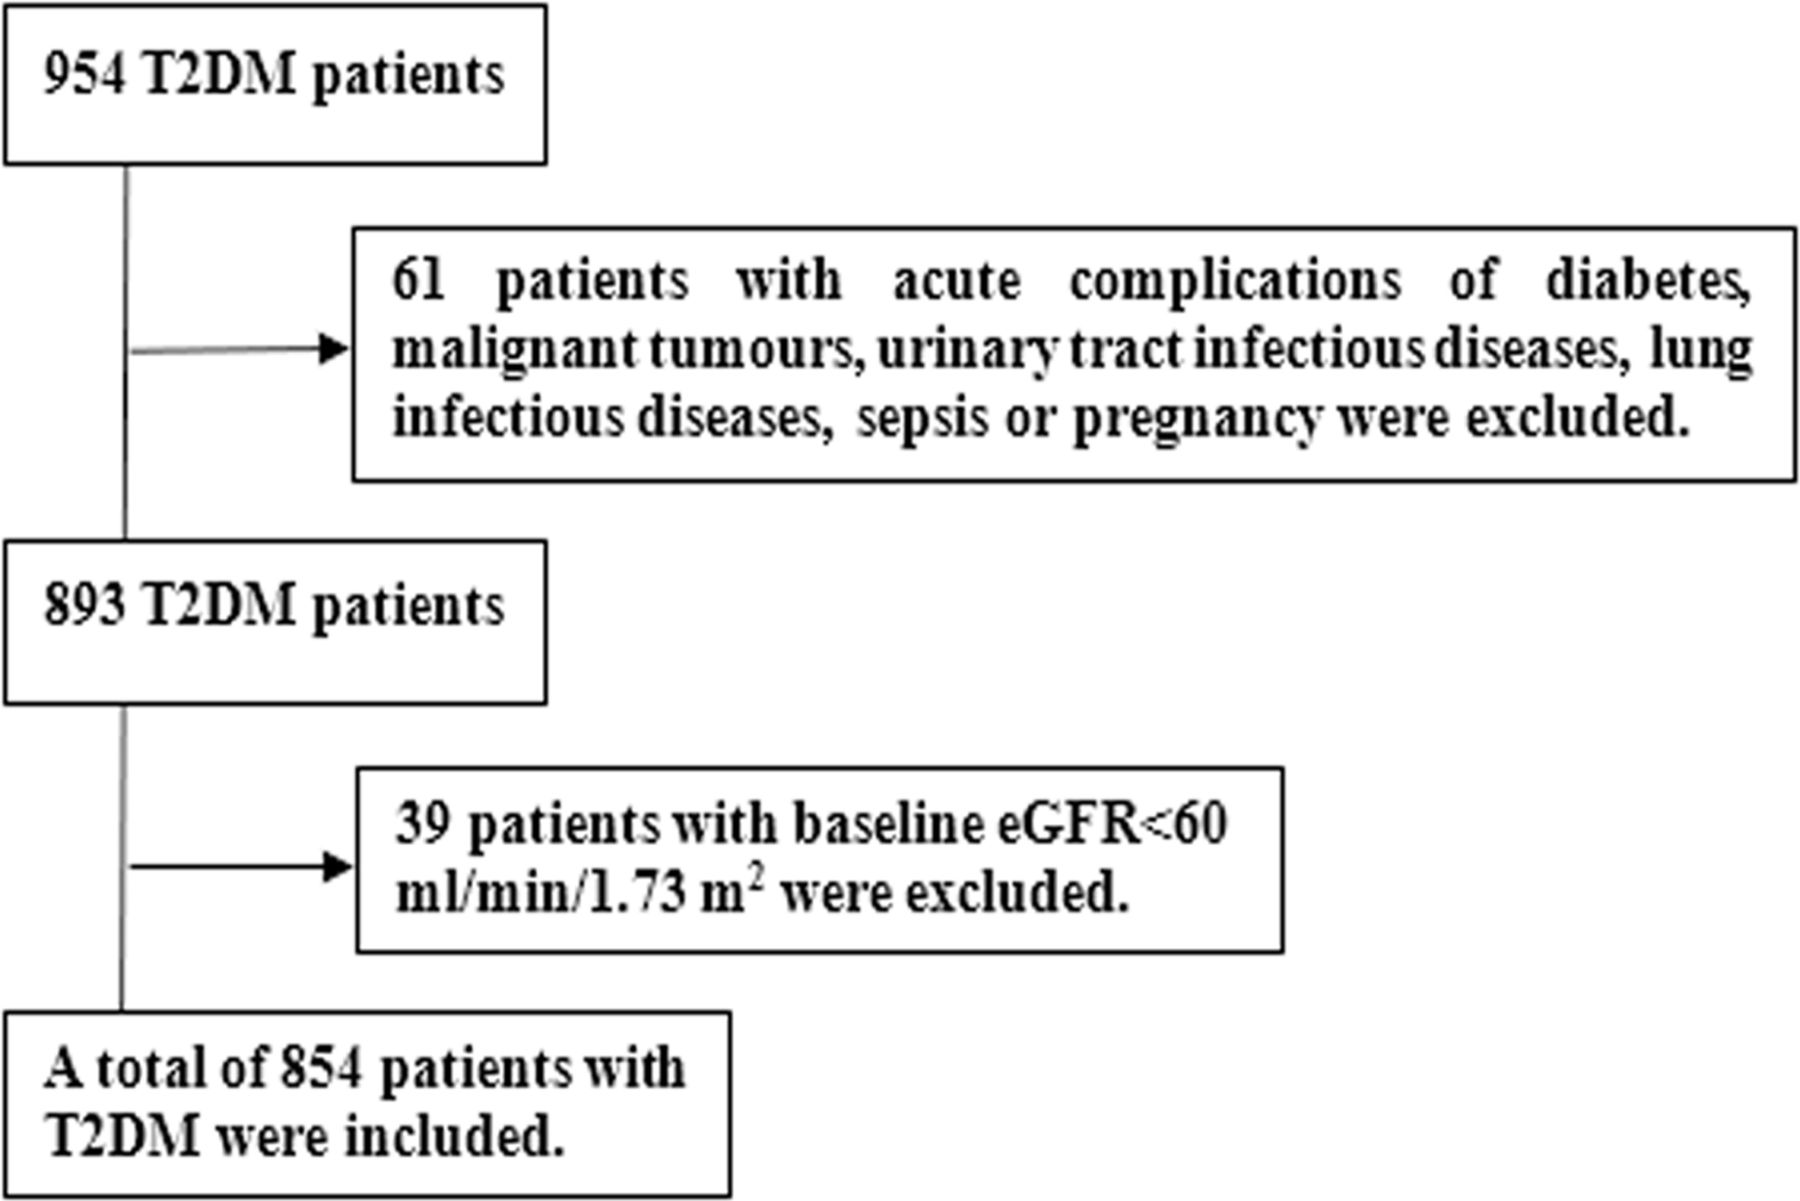
Consort diagram. eGFR, estimated glomerular filtration rate; T2DM, type 2 diabetes mellitus.
Characteristics of participants at baseline
Among all participants, the mean age was 57.2±11.64 years old, and 553 (64.8%) were males. The average FCP was 1.37 (0.9, 2.1) ng/mL, while 2hPCP was 3.34 (2.1, 5.2) ng/mL, ΔCP was 1.9 (0.9, 3.3) ng/mL, FCGR was 0.94 (0.6, 1.5) and PCGR was 1.29 (0.7, 2.2). Compared with the NRKFD group, participants in the RKFD group had a longer diabetes duration, higher levels of SBP, UA, BUN, SCr, UMAlb, and HbA1c, and lower concentrations of HDL, 2hPINS, FCGR, 2hPCP, ΔCP, PCGR, and eGFR and lower insulin treatment rates (p<0.05). No significant differences were observed in age, sex, BMI, DBP, TC, TG, LDL, FBG, 2hPBG, FINS, HOMA-β, or FCP between the two groups (p>0.05) (table 1).
Comparisons of baseline characteristics between the NRKFD and RKFD groups
Association of baseline C-peptide and HOMA-β with the annual eGFR decline
Linear mixed-effects models showed the comparison between eGFR at baseline of the C-peptide and HOMA-β tertiles (table 2); it was concluded that eGFR at baseline of the high-level C-peptide and HOMA-β groups were lower than those of the corresponding low-level groups (p<0.05). After adjusting for confounding factors, it revealed that the annual eGFR declines of the low-level FCP, FCGR, 2hPCP, ΔCP, and PCGR groups were 3.56, 4.08, 4.38, 4.25, and 4.62 mL/min/1.73 m2, respectively (p<0.01), and those of the highest-level C-peptide index groups were 2.41, 2.20, 2.07, 1.89, and 2.16 mL/min/1.73 m2, respectively (p<0.05). Therefore, the higher the C-peptide level, the slower the annual eGFR decline (p<0.05), but similar significant results were not observed in HOMA-β tertiles (table 2).
Linear mixed-effects models between HOMA-β or C-peptide groups and eGFR
Effect of 2-hour postprandial C-peptide-related indexes on the renal composite endpoint in T2DM patients
As illustrated in table 3, taking the corresponding low-level groups of C-peptide-related indexes as a reference, multivariable Cox regression analysis reflected that higher levels of 2hPCP (adjusted HR 0.53; 95% CI 0.31 to 0.92), ΔCP (adjusted HR 0.39; 95% CI 0.22 to 0.69), and PCGR (adjusted HR 0.44; 95% CI 0.24 to 0.82) were associated with notably decreased risks of renal composite endpoint. Nevertheless, there were no statistically significant differences in the FCP and FCGR tertiles (table 3).
HRs for renal composite endpoint in C-peptide groups
Possible cut-off value of 2-hour postprandial C-peptide-related indicators in predicting the renal composite endpoint
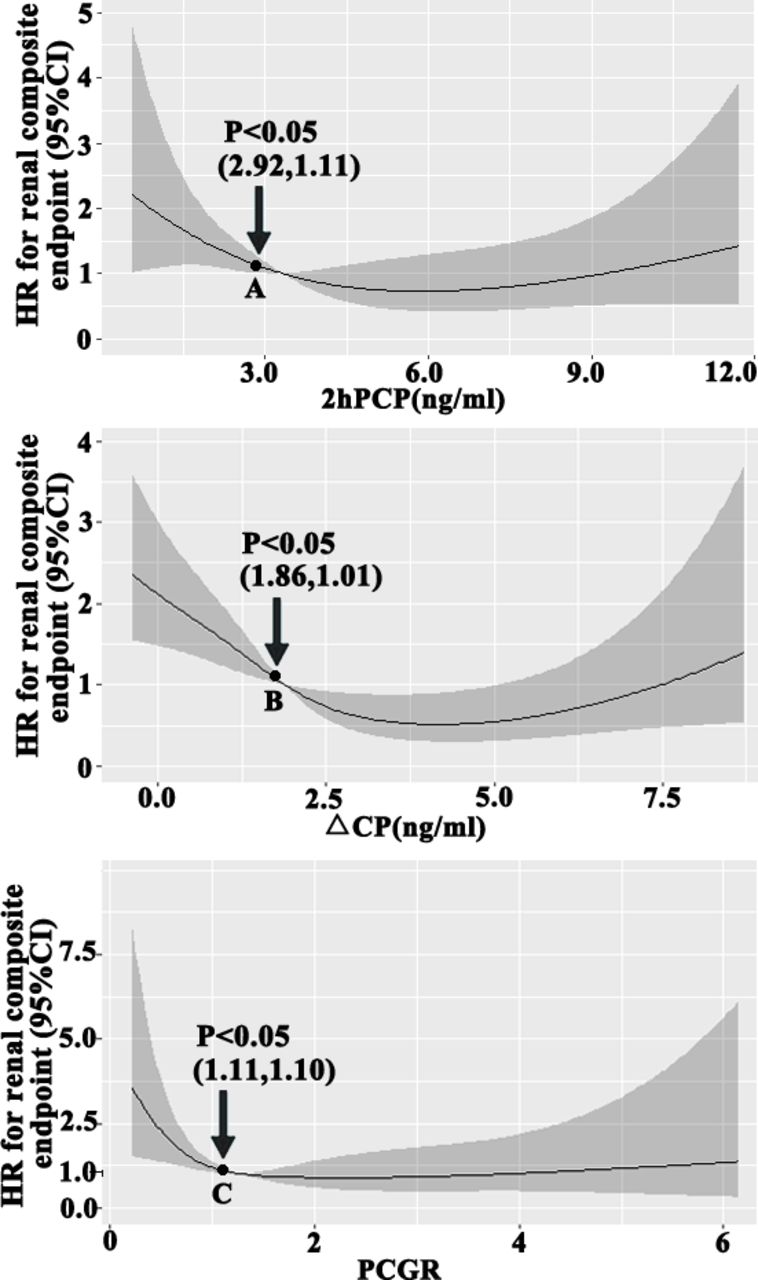
RCS curves based on multivariable Cox regression demonstrated that there were dramatically increased risks for renal composite endpoint events when 2hPCP <2.92 ng/mL, ΔCP <1.86 ng/mL, or PCGR <1.11, which were independent risk factors for renal composite endpoint with statistically significant differences (p<0.05) (figure 2).

Restricted cubic spline curves based on multivariable Cox regression showing the correlation between 2-hour postprandial C-peptide-related indexes and HRs for renal composite endpoint. Notes: points A, B, and C in this picture were the corresponding C-peptide cut-off values. In multivariate analysis, covariates were age, sex, diabetes duration, body mass index, systolic blood pressure, triglyceride, total cholesterol, blood uric acid, eGFR at baseline, urine microalbumin, glycated hemoglobin, fasting blood glucose, and history of insulin treatment. ΔCP, difference between 2-hour postprandial and fasting C-peptide; 2hPCP, 2-hour postprandial C-peptide; eGFR, estimated glomerular filtration rate; PCGR, 2-hour postprandial C-peptide-to-glucose ratio.
Effect of 2-hour postprandial C-peptide-related indicators on the renal composite endpoint in T2DM patients with different DKD hazard factors
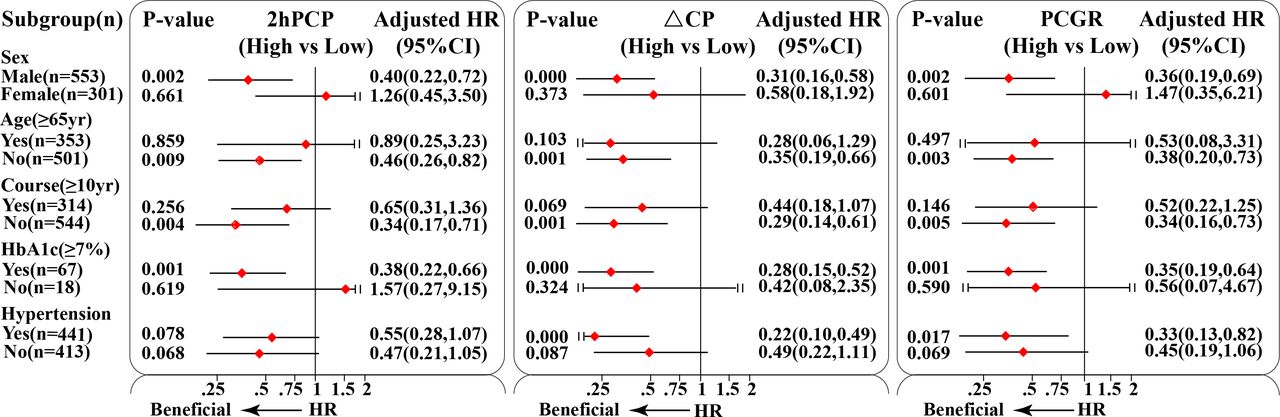
Participants were divided into high-level and low-level groups of 2hPCP, ΔCP, and PCGR by the cut-off values derived above 2.92 ng/mL, 1.86 ng/mL and 1.11, as references of corresponding low-level groups. Subgroup analysis suggested that high levels of 2hPCP, ΔCP, and PCGR substantially decreased the risk of renal composite endpoint (adjusted HRs <0.50, p<0.05) among T2DM patients who were male, aged <65 years old, with a diabetes duration of <10 years, and a glycated hemoglobin value of ≥7%, but there were not statistically significant changes for patients who were female, aged ≥65 years old, with a diabetes duration of ≥10 years, and a glycated hemoglobin value of <7%. Furthermore, for the participants with a history of hypertension, high levels of ΔCP and PCGR reduced the risk of the renal composite endpoint to a greater extent than for those with no history of hypertension, and similar effects were not observed in the 2hPCP group (p>0.05) (figure 3).
Subgroup analysis by multivariable Cox regression for renal composite endpoint after stratification by sex, age, diabetes duration, HbA1c, and history of hypertension. In multivariate analysis, covariates were age, sex, diabetes duration, body mass index, systolic blood pressure, triglyceride, total cholesterol, blood uric acid, eGFR at baseline, urine microalbumin, glycated hemoglobin, fasting blood glucose, and history of insulin treatment. ΔCP, difference between 2-hour postprandial and fasting C-peptide; 2hPCP, 2-hour postprandial C-peptide; eGFR, estimated glomerular filtration rate; PCGR, 2-hour postprandial C-peptide-to-glucose ratio.
Discussion
Current clinical treatment can only partly delay the progression of renal function in T2DM, while the number of patients with ESRD caused by DM is still increasing, and the number of patients with ESRD reached 1016 per million by 2015.24 DKD has undoubtedly become a serious public health problem that threatens the health of patients and imposes a heavy economic burden.
A total of 854 T2DM patients enrolled in this study were followed up for a median of 5 years. We found that the annual eGFR decline of the high-level C-peptide indicators was slower than that of the lower level groups, but similar results were not significant in HOMA-β tertiles, which suggested that C-peptide may play a positive role in kidney function independent of the mechanism or pathways of pancreatic β-cell function. This was precisely confirmed in the animal experimental study conducted by Flynn et al.25 They provided C-peptide to diabetic rats without insulin treatment, which significantly improved their glomerular filtration rate and microalbuminuria compared with the control group, indicating that the protective effect of C-peptide on the kidney was not affected by the blood glucose level (or the insulin effect).
Our study was one of the few studies that mainly investigated the relationship between 2hPCP, ΔCP, PCGR, and renal function progression in T2DM. It was confirmed that higher levels of 2hPCP, ΔCP, and PCGR could delay the occurrence of renal composite endpoint events. A small cross-sectional study in China showed that low-level C-peptide was an independent risk factor for proteinuria in T2DM patients.26 Bo et al27 conducted a retrospective cohort study of 931 T2DM patients with a median follow-up period of 14 years and showed that a higher level of C-peptide could reduce the risk of chronic complications, including DKD. A total of 357 T2DM patients were grouped by the severity of proteinuria and eGFR in Wang et al’s28 study, and they revealed that a low level of C-peptide was associated with the progression of diabetic nephropathy. However, most previous studies, as mentioned previously, were restricted by cross-sectional methodologies and a primary focus on the fasting C-peptide values, and they did not include a correction of C-peptide using glucose and calculation of the cut-off value of C-peptide. Notably, 2hPCP was more representative of the metabolism of C-peptide than FCP due to the delay or relative lack of C-peptide secretion in T2DM and the additional stimulation of food, blood glucose, and glucagon. To reduce the interference of baseline FCP and blood glucose, we obtained ΔC-peptide and PCGR by correction, which were both proven to be independent protective factors of kidney function in T2DM as well as 2hPCP. However, there was no significant effect of high levels of FCP and FCGR on the renal composite endpoint, which might be interpreted as the different severity of renal outcomes and the FCP values being in the normal range in most participants. Moreover, some studies have shown conflicting results. A prospective cross-sectional study in India only elucidated a weak correlation between serum C-peptide levels and microalbuminuria or creatinine clearance.29 A Turkish study concluded that increased serum C-peptide levels were not associated with microvascular complications in T2DM patients.30 The reasons for the heterogeneity of these results are the small sample sizes, limited statistical effects, or racial differences among the studies. In the future, multiple large-sample and multicenter prospective clinical studies will be required to investigate the effects of C-peptide indicators on renal function in the early stage of T2DM.
Subgroup analyses showed that T2DM patients characterized by male sex, age <65 years old, diabetes duration <10 years, glycated hemoglobin ≥7%, or a history of hypertension could gain more renal benefits from higher levels of 2hPCP-related indicators. Hence, the protective effect of higher levels of 2hPCP-related indicators on delaying renal function progression could be more obvious in these patients. Relevant studies31 32 have reported that risk factors for DKD include male sex, age, course of disease, race, family history, obesity, high-protein diet, hyperglycemia, hypertension, etc. In terms of age and diabetes duration, our results were contrary, which may be related to the lower proportion of elderly patients or patients with a long disease course in the population with a high level of 2hPCP in our study.
Overall, measurement of C-peptide is of a certain value in clinical practice, such as recognizing T1DM when autoantibodies present as a false negative, predicting the response to insulin treatment and assisting with complication risk stratification in T2DM.33 RCS curves showed the cut-off values of 2hPCP, ΔCP, and PCGR (2.92 ng/mL, 1.86 ng/mL, and 1.11, respectively), meaning that kidney function progression would accelerate if the level of C-peptide were lower than the above threshold values. Data from a T1DM study have shown that a random C-peptide concentration of ≥0.20 nmol/L, compared with a random C-peptide concentration of <0.005 nmol/L, was associated with a 50% decreased risk for retinopathy,34 but there has been little research on the relationship between C-peptide values and nephropathy risk in T2DM. Moreover, C-peptide measurement has seldom been used in the clinical setting at present due to a lack of standardization in the C-peptide assay in different laboratories,35 and randomized clinical trials are desirable to further clarify its clinical significance.
This study had several strengths. First, a retrospective cohort study method, which is more effective than a cross-sectional methodology, was used to confirm the potential influencing factors of renal adverse events in T2DM patients. Second, C-peptide-related indexes were corrected with blood glucose values. The results of the study were also subject to some limitations, such as being a single-center study with a single object composition and source and a limited cohort of patients with diabetes.
In summary, low levels of 2hPCP, ΔCP, and PCGR were independently related to greater annual eGFR decline in T2DM patients. Higher levels of 2hPCP, ΔCP, and PCGR could significantly delay the onset of the renal composite endpoint, especially among patients characterized as male, with an age of <65 years old, a diabetes duration of <10 years, a glycated haemoglobin value of ≥7%, or a history of hypertension. Monitoring the level of 2hPCP-related indexes or supplementing C-peptide when necessary may be beneficial to predict early or even delayed progression of kidney disease in T2DM.
Data availability statement
Data are available on reasonable request.
Ethics statements
Patient consent for publication
Ethics approval
This study involves human participants and was approved by the Ethics Committee of the Third Xiangya Hospital of Central South University (22156). This study was a retrospective analysis; therefore, informed consent by participants was not required.
Acknowledgments
The authors would like to thank all the participants for their invaluable contributions.
References
Footnotes
QY and YL contributed equally.
Contributors BY acted as guarantor and significantly contributed to the manuscript. QY, YL, JP, and BY made substantial contributions to the conception and design of the study. QY, YL, JPe, and JPa collected and analysed the data. QY, YL and BY drafted the manuscript. All the authors assisted in the acquisition and interpretation of data, contributed to the critical revision of the manuscript for important intellectual content, and approved the final version.
Funding This study was supported by grants from the National Natural Science Foundation of China (82070759) and the Natural Science Foundation of Hunan Province (2021JJ31016).
Competing interests None declared.
Provenance and peer review Not commissioned; externally peer reviewed.