Article Text

Abstract
Objectives To investigate changes in type 2 diabetes care indicators over time in Germany.
Methods Adults aged 45–79 years with type 2 diabetes were identified from two national health examination surveys conducted in 1997–1999 (GNHIES98, n=333) and in 2008–2011 (DEGS1, n=526). We examined diabetes care indicators including treatment and preventive targets (glycemic control, blood pressure (BP), total cholesterol (TC), smoking, weight reduction, sports activity), self-management and care process measures (glucose self-monitoring, holding a diabetes passport, annual foot and eye examination; statin use), and the presence of diabetes-specific complications (diabetic nephropathy, retinopathy, neuropathy, diabetic foot, amputations) and comorbid cardiovascular disease (CVD) or chronic kidney disease (CKD). We calculated proportions of persons meeting these care indicators by survey and examined unadjusted and adjusted changes between surveys.
Results Significant improvement (GNHIES98 vs DEGS1) over time was observed for glycated hemoglobin (HbA1c) <7.0% (53 mmol/mol) (32.4% vs 65.4%), BP <130/80 mm Hg (32.0% vs 47.2%), TC <190 mg/dL (13.5% vs 41.9%), statin use (11.7% vs 35.9%), eye (51.1% vs 78.4%) and foot (48.0% vs 61.4%) examination within the past 12 months, diabetes-specific complications (29.7% vs 21.8%), and CVD (44.5% vs 37.1%). Blood glucose self-monitoring significantly increased (37.4% vs 62.8%), while holding a diabetes passport did not change. Current smoking did not change and obesity rose, although sports activity significantly increased over time. Proportions of adults achieving combination goals of HbA1c, BP, TC, and smoking cessation were low in both surveys in spite of significant improvement.
Conclusions In Germany, the quality of diabetes care improved over time. There is much room for improvement, in particular regarding preventive goals and diabetes self-management.
- Quality of Care
- Type 2 Diabetes
- National Health Surveys
- Change
This is an Open Access article distributed in accordance with the Creative Commons Attribution Non Commercial (CC BY-NC 4.0) license, which permits others to distribute, remix, adapt, build upon this work non-commercially, and license their derivative works on different terms, provided the original work is properly cited and the use is non-commercial. See: http://creativecommons.org/licenses/by-nc/4.0/
Statistics from Altmetric.com
Key messages
Quality of care for adults with type 2 diabetes substantially improved in Germany between 1997–1999 and 2008–2011.
Improvements in quality of care for adults with type 2 diabetes in Germany were most pronounced for process and intermediate outcome measures, such as annual eye examinations and glycemic control.
Quality of care for adults with type 2 diabetes in Germany still falls short of evidence-based guideline recommendations, in particular with regard to combined therapeutic goal achievement, behavioral risk factor control, and patient self-management.
Introduction
Diabetes represents a major threat to public health in many countries of the world. International health organizations have emphasized the necessity for national plans to improve diabetes prevention and quality of care, but continuous monitoring of quality of care indicators at the population level remains a challenge for many countries.1 ,2 Individualized glycemic control and multifactorial risk reduction are the cornerstones of high-quality diabetes care.3–6 Evidence-based guidelines for the management of diabetes recommend lowering glycated hemoglobin (HbA1c) levels to <7.0% (53 mmol/mol) for most people with diabetes, but outline that certain individuals may benefit from more stringent (6.0–6.5%; 42–48 mmol/mol) and less stringent (7.5–8.0%, 58–64 mmol/mol) glycemic control.3–6 Optimal individualized diabetes management includes controlling cardiovascular risk factors (eg, hypertension and dyslipidemia), preventive strategies such as annual eye and foot examinations, and lifestyle modifications, in particular smoking cessation, weight reduction and increasing moderate physical activity to at least 150 min/week.3 ,6
In Germany, about six million adults are estimated to have diabetes.7 In an effort to improve diabetes care, type 2 diabetes disease management programs (DMPs) were initiated nationally in 2003.8 These programs incorporated prevention and treatment goals and strategies recommended in international and national guidelines. Tracking quality of care indicators at the population level is essential to help understand successes and failures in prevention and treatment goals for diabetes care and to direct quality improvement initiatives and health policy. To date, no studies have comprehensively investigated the quality of diabetes care over time at the national level. Previous studies of changes over time have been limited to regional population-based surveys and practice-based studies or analyses of data from different statutory sickness funds.9–12
In this study, we examine changes in quality of care indicators for adults in Germany with type 2 diabetes using nationally representative data collected in 1997–1999 and 2008–2011. Diabetes care indicators included therapeutic and preventive goals such as glycemic, blood pressure (BP) and lipid control, diabetes self-management and care process measures, and diabetes comorbidities and complications.
Research design and methods
Study design and participants
We analyzed data from two national health interview and examination surveys for adults in Germany conducted in 1997–1999 and 2008–2011 by the Robert Koch Institute, the national public health institute for disease control and prevention in Germany. In both surveys, a two-stage probability cluster sampling procedure was applied to ensure that the survey sample was representative of the resident population in Germany aged 18–79 years. Details of the study design, sampling strategy, and protocol have been previously published.13 ,14 Briefly, in the German National Health Interview and Examination Survey in 1997–1999 (GNHIES98), a sample of 120 German municipalities, representative of municipality sizes and structures in Germany, were selected. In the second stage, age-stratified and sex-stratified random samples of adults aged 18–79 years were drawn from local population registries. The final GNHIES98 sample included 7124 adults (response rate was 61.4%) with complete interview and examination data.13 The National Health Interview and Examination Survey for Adults in Germany 2008–2011 (DEGS1) used the same sampling methods as GNHIES98 but included 60 additional municipalities. The DEGS1 sample 18–79 years of age comprised 7987 persons, including 4192 persons who were newly recruited in DEGS1 and 3795 persons who had already participated in GNHIES98. The response rate was 42% for first-time survey participants and 64% for GNHIES98 re-participants.14 ,15 Among DEGS1 study participants 18–79 years, a total of 7115 persons attended one of the study centers and completed both the interview and examination.14 ,15
The present analysis is confined to participants with known diabetes. We selected those who: (1) answered ‘Yes’ to the question “Have you ever been diagnosed with diabetes by a doctor?” or (2) used antidiabetic medications including insulin and/or oral agents within the past 7 days. Overall, we identified 374 adults with known diabetes from the 7124 participants in GNHIES98 and 591 adults with known diabetes from the 7115 participants with complete interview and examination data in DEGS1. No question on the type of diabetes was included in the surveys.7 In order to focus on type 2 diabetes, we confined this analysis to persons with known diabetes 45–79 years of age, excluding 101 (n=38 in GNHIES98; n=63 in DEGS1) persons with diabetes younger than 45 years at the time of the survey. Furthermore, we excluded another five persons with known diabetes (n=3 in GNHIES98; n=2 in DEGS1) who were likely to have type 1 diabetes as they fulfilled a combination of the following criteria: age at diagnosis of diabetes <30 years, insulin prescribed at initial diagnosis and currently using insulin.7 The final study population comprised 333 adults in GNHIES98 and 526 adults in DEGS1 aged 45–79 years with known diabetes who are described as having type 2 diabetes (table 1).
Characteristics of adults aged 45–79 years with type 2 diabetes in German national health interview and examination surveys 1997–1999 (GNHIES98) and 2008–2011 (DEGS1)
Both surveys conform to the principles outlined in the Declaration of Helsinki and the German Federal Data Protection Act. Study protocols were approved by the Federal and State Commissioners for Data Protection and Freedom of Information. DEGS1 was approved by the Charité Universitätsmedizin Berlin ethics committee in September 2008 (number EA2/047/08). All participants provided written informed consent prior to the interview and examination.
Data collection and definition of study characteristics
Data collection methods in DEGS1 were largely comparable to those used in GNHIES98 and have been previously described in detail.14 Standardized self-administered questionnaires, physician-administered computer-assisted personal interviews (CAPI), and physiological measurements and tests were used to collect information on sociodemographic characteristics (age, sex, region of residence, educational attainment), health-related behaviors (current tobacco use and sports activities in the past 3 months), self-reported physician-diagnosed health conditions, and anthropometric (body weight and height) and biochemical measures.13 ,14
Individuals with diabetes were asked about their age at first diagnosis, current treatment and treatment at the time of diagnosis, diabetes-specific complications (including diabetic nephropathy, diabetic retinopathy, diabetic neuropathy, diabetic foot and diabetes-related amputation), eye and foot examinations in the past 12 months, self-monitoring of blood glucose, holding a diabetes passport (a national patient-held record of their care), and whether they had ever participated in a diabetes education program. We defined treatment categories as no treatment at all, dietary treatment only, and pharmaceutical treatment (oral antidiabetic agents and/or insulin). Diabetes duration was computed by subtracting the age at diagnosis from the person's current age and grouped as ‘<5’, ‘5–14’ and ‘≥15’ years.
Participants were asked to bring the original containers of all medication used during the past 7 days to the examination site. This permitted automated recording of unique product identifiers and drug coding according to the WHO “Anatomical Therapeutic Chemical” (ATC) classification system.16 A medication with an ATC code A10A and A10B was considered as ‘insulin’ and ‘oral agent’, respectively.
Body mass index (BMI) was calculated as the ratio of body weight (kg) and body height (m) squared with participants wearing light clothing (GNHIES98) or underwear (DEGS1) and shoes removed.17 Three standardized BP measurements were taken at 3 minute intervals in upright sitting with a standard mercury sphygmomanometer in GNHIES98 and an oscillometric device (Datascope Accutorr Plus) in DEGS1. One of three cuff sizes was selected according to the right mid-arm circumference. GNHIES98 measurements were calibrated for comparison with DEGS1 measurements in order to account for device and cuff differences.18 Random venous blood samples were obtained between 8:00 and 20:00 with participants in the seated position. Full details of specimen handling and laboratory analyses for HbA1c, total cholesterol (TC), and creatinine are provided in the online supplementary appendix.
Educational attainment was classified using the international Comparative Analysis of Social Mobility in Industrial Nations (CASMIN) scale and grouped as ‘primary’, ‘middle’, and ‘high’.19 Municipality size was classified as rural town (<5000 inhabitants) and small (5000–<20 000), medium-sized (20 000–<100 000), and large (100 000 inhabitants or more) cities, based on population density according to an established German classification system.14 Regions of residence were grouped into five commonly described geographical areas: northwest (federal states: Bremen, Hamburg, Niedersachsen, and Schleswig-Holstein); northeast (Berlin, Brandenburg, and Mecklenburg-Vorpommern); central west (Hessen, Nordrhein-Westfalen, Rheinland-Pfalz, and Saarland); central east (Sachsen, Sachsen-Anhalt, and Thüringen); south (Baden-Württemberg and Bayern). Smoking status was categorized as never-smoking, former smoking, and current smoking. The World Health Organization (WHO)-recommended criteria were applied to define normal weight (BMI <25.00 kg/m2), pre-obese (BMI 25.00–29.99 kg/m2), obese class I (BMI ≥30.00–34.99 kg/m2), and obese classes II and III (BMI ≥35).20 Sports activity was assessed by five categories (no sports, <1 hour/week, regularly 1–2 hours/week, regularly 2–4 hours/week, regularly >4 hours/week). This information was aggregated into three categories (no sports, <2 hours/week, ≥2 hours/week). Since the number of people with diabetes engaging in ≥2 hours/week of sports activity in 1998 was small (n=20), we categorized this variable as no sports versus any sports activity for the analysis.
Diabetes care indicators
Indicators were based on clinical guidelines for recommended care3–6 including achievement of treatment and preventive goals (control of HbA1c, BP, and TC), patient self-management (glucose self-monitoring, holding a diabetes passport), and care process measures (eye and foot examination within the past 12 months, statin use, angiotensin converting enzyme (ACE) inhibitor or angiotensin receptor blocker (ARB) use). We also assessed a number of additional preventive targets, including the proportion of persons with type 2 diabetes who were: (1) non-obese (BMI <30 kg/m2); (2) not currently smoking; and (3) engaging in any sports activities.
We considered stringent and less stringent cut-offs for glycemic control ranging from HbA1c <6.5% (48 mmol/mol) to <8.0% (64 mmol/mol) as well as for BP (<130/80 and <140/90 mm Hg) and TC (<190 and <240 mg/dL). Individualized glycemic control takes into consideration the persons’ age and presence of complications.4 Consistent with previous studies,21 we defined the individualized HbA1c target as <8.0% (64 mmol/mol) for adults with diabetes-specific complications or comorbid cardiovascular diseases (CVD), <7.0% (53 mmol/mol) for adults 45–64 years, and <7.5% (58 mmol/mol) for adults 65–79 years without these problems. Furthermore, we defined combined goals of diabetes care as previously described,21 with the exception of using total instead of low-density lipoprotein (LDL) cholesterol: goal 1: HbA1c <7.0% (53 mmol/mol), BP <130/80 mm Hg, TC <190 mg/dL, and not currently smoking; goal 2: HbA1c <7.5% (58 mmol/mol), BP <140/90 mm Hg, TC <240 mg/dL, and not currently smoking.
The study population was characterized according to the presence of any self-reported diabetes-specific complication (yes/no) and diabetes-related comorbidities, including self-reported CVD and chronic kidney disease (CKD). Adults reporting a history of physician-diagnosed heart failure, stroke, myocardial infarction, and other coronary heart disease were classified as having CVD. For those without CVD, we calculated the 10-year UK Prospective Diabetes Study (UKPDS) CVD risk in per cent using the original version which considers patients’ age, sex, HbA1c, BP, TC, smoking status, and other risk factors.22 CKD was defined according to the International Society of Nephrology23 based on an estimated glomerular filtration rate (eGFR) <60 mL/min/1.73 m2 or the presence of moderate to severe albuminuria. eGFR values were calculated by the CKD-EPI formula24 using measured serum creatinine levels. In German health examination surveys, microalbuminuria was assessed semi-quantitatively using Micral-Test albumin dipstick testing and a cut-off of >50 mg/L was used to define moderate to severe microalbuminuria based on previous evidence on test performance.25
Statistical analysis
SAS V.9.4 survey procedures for complex samples (SAS Institute Inc, Cary, North Carolina, USA) were used for statistical analyses. Comparisons between the two surveys are based on weighted estimates standardized to the population of 31 December 2010. Survey weights were computed as previously described14 ,15 to account for deviations between the sample and the structure of the general population regarding age, sex, region, nationality, and education.7 ,14 ,15 In DEGS1, weighting factors additionally included the probability of re-participation in DEGS1 as derived from logistic regression models.15
Descriptive statistics were used to examine characteristics of adults with type 2 diabetes and diabetes care indicators. Point estimates (means and proportions) and 95% CIs were reported. Rao-Scott corrected Pearson tests for categorical variables and general linear models for continuous variables were used. For each diabetes care indicator, we calculated the absolute changes in proportions (and 95% CI) between surveys, both unadjusted and adjusted for sex, age group, region, community size, educational level, and duration of diabetes. The adjusted changes in proportions were derived from the predictive margins calculated from a logistic regression model.26 First-order interactions between the survey year variable and each covariates were tested separately and interaction terms included in the model if p<0.1. The predictive margins were calculated as the adjusted probabilities predicted by the model, averaged over all participants in the model and assuming that the covariate distribution in GNHIES98 and DEGS1 were identical. The SEs and correlation of the predictive margins were approximated by the SAS LSMEANS statement and used in the calculation of the 95% CI for the adjusted change in proportions. Kernel density estimation was applied to compare weighted HbA1c distributions among persons with diabetes between surveys.
For questions related to medical history, eye and foot examinations, and diabetes complications, an additional ‘don't know’ answering category was included in DEGS1, whereas in GNHIES98 only ‘yes’ and ‘no’ options were available. We therefore treated persons answering ‘don't know’ in DEGS1 as missing in analyses, but also conducted sensitivity analyses coding these answers as ‘no’ to ensure consistency of results. Since the results were similar, only results based on coding ‘don't’ know’ answers as missing are presented. For each variable, weighted proportion and unweighted n depict the number of participants with complete information. The number of persons with missing values was explicitly stated for each variable. Persons with missing values were excluded from the analyses, with pairwise deletion for descriptive and listwise deletion for multivariable analyses. Statistical significance was defined at p<0.05 based on two-sided tests.
Results
Persons with type 2 diabetes in DEGS1 had higher educational attainment, more frequently engaged in sports activities, were more often ex-smokers, and had higher BMI levels than those in GNHIES98 (table 1). Between the 1997–1999 and 2008–2011 surveys, mean age at diagnosis declined from 56.3 to 54.6 years (p=0.07) and mean years of diabetes duration increased significantly from 9.2 to 11.3 years (p=0.012). In sex-specific analyses, these differences were statistically significant among women (mean age at diagnosis: 57.3 vs 54.1 years, p=0.041; diabetes duration: 9.8 vs 12.4 years, p=0.045), but not among men (mean age at diagnosis: 55.4 vs 55.0 years, p=0.757; diabetes duration: 8.6 vs 10.3 years, p=0.091).
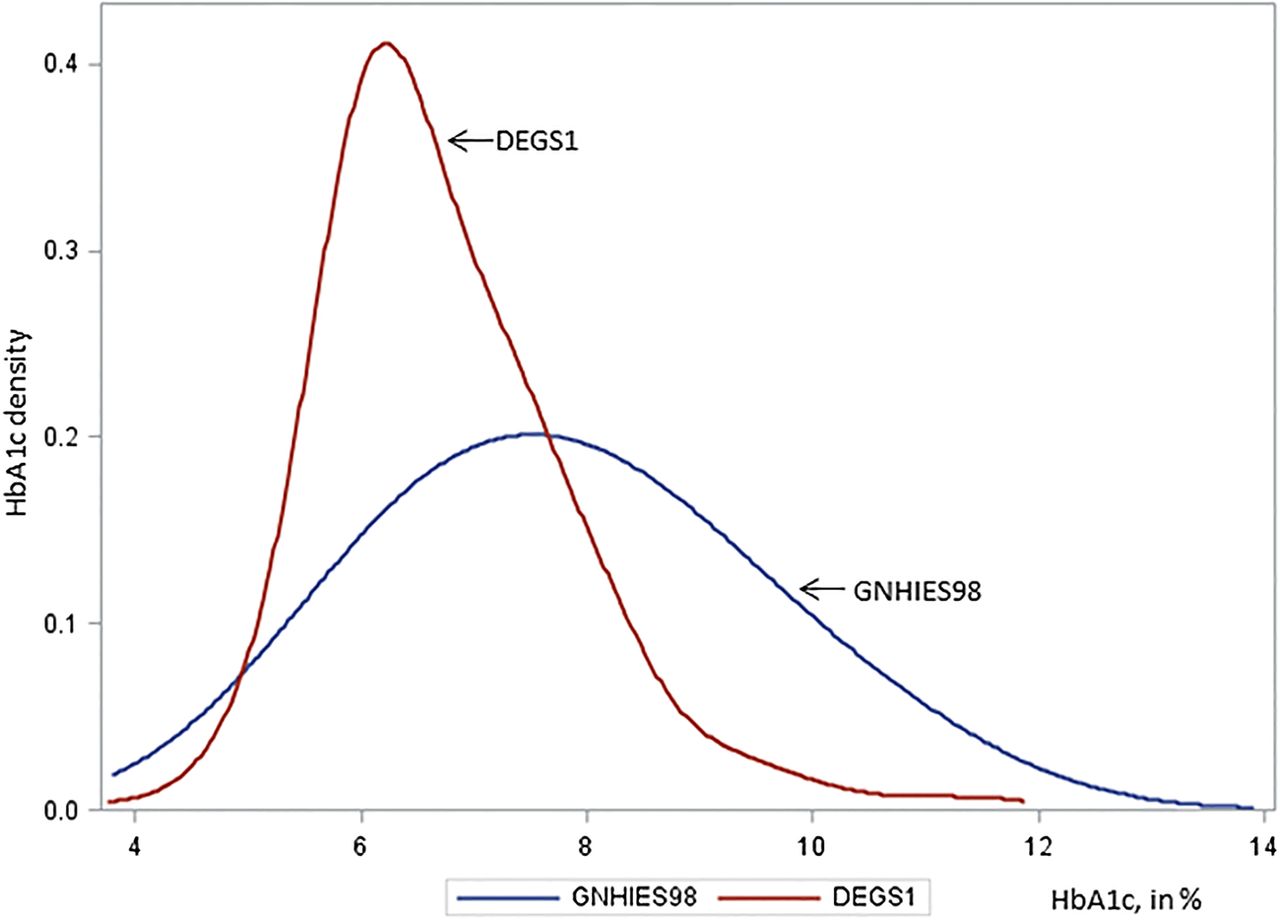
Figure 1 shows the HbA1c distribution among adults with type 2 diabetes in the two surveys. The HbA1c distribution in DEGS1 has shifted to the left and shows considerably lower variability compared to GNHIES98.
Density distribution of glycated hemoglobin (HbA1c) among adults aged 45–79 years with type 2 diabetes. German national health interview and examination surveys 1997–1999 (GNHIES98) and 2008–2011 (DEGS1).
Significantly more persons with type 2 diabetes achieved guideline-recommended stringent and less stringent targets for HbA1c, BP, and TC as well as the individualized HbA1c target and the combined treatment goals in 2008–2011 compared to the 1997–1999 survey period (table 2). The proportion of persons with diabetes reporting any sports activity significantly increased between the two surveys, while the proportion of current non-smokers remained unchanged and the proportion of non-obese persons decreased over time. Improvements in care processes over time were reflected by increasing ACE inhibitor/ARB and statin use, and increasing proportions of persons reporting eye or foot examinations within the past 12 months. Proportions of adults with type 2 diabetes reporting glucose self-monitoring increased over time, but holding a diabetes passport did not significantly differ between the two surveys. A significant decrease between the surveys was found in the proportion of adults reporting diabetes-specific complications or comorbid CVD, but not in the proportion of adults with comorbid CKD (table 2). Among adults without a history of CVD, the 10-year UKPDS risk score declined significantly over time.
Absolute change (95% CI) in the prevalence of diabetes care indicators among adults with type 2 diabetes over time, German national health interview and examination surveys 1997–1999 and 2008–2011
Discussion
Community-dwelling adults aged 45–79 years with type 2 diabetes in Germany showed consistent improvements in diabetes care between the survey periods 1997–1999 and 2008–2011. Improvement was seen for treatment targets (HbA1c, BP, serum lipids), statin and ACE inhibitor/ARB use. Self-monitoring of blood glucose levels and uptake of annual eye or foot examinations also improved. Furthermore, the proportion of adults with type 2 diabetes reporting any diabetes-specific complications and comorbid CVD decreased significantly. However, there was no significant decrease in the proportions of adults with diabetes having evidence of CKD. The proportion of people with diabetes and obesity rose over this period and the proportion of those currently smoking was unchanged. Although overall engagement in sports activity significantly improved over time, less than one in five adults in 2008–2011 reported performing more than 2 hours of sports activity per week; this is well below the guideline recommended levels of physical activity (>150 min/week) for adults with diabetes.3 ,6
There may be several reasons for the observed improvements in some, albeit not all, diabetes care indicators in Germany. First, there was the introduction of a national type 2 DMP in 2003, between these national health examination surveys 1997–1999 and 2008–2011.8 DMP enrollment comprises regular check-up visits and aims to promote diabetes education, adherence to treatment goals, and self-management.8 ,27 ,28 Physicians are contracted under the provision of structural quality requirements and reimbursement is provided with a focus on intermediate outcome measures, such as HbA1c measures. This key national policy change and the introduction of financial incentives for physicians to improve diabetes care are likely to have contributed to the improvements in glycemic control and statin use as observed in the present study. However, we found mixed results regarding diabetes self-management with improvements in glucose self-monitoring but not keeping a diabetes passport. Second, evidence-based national diabetes management and treatment guidelines have been periodically updated between the survey periods and are integral to DMP contracts.6 Third, guideline recommendations regarding the diagnostic criteria for type 2 diabetes based on fasting glucose changed in 1998, that is, toward the end of GNHIES98.29 Together, these changes in between survey periods might have contributed to an earlier diagnosis of type 2 diabetes. We found that the age at diagnosis of diabetes was on average 1.7 years earlier in DEGS1 than in GNHIES98. Survey participants detected at an earlier phase of the disease course may have more favorable intermediate outcome measures (HbA1c, BP, cholesterol), and are less likely to have diabetes-specific complications compared with those at a more advanced phase of disease. In sex-specific analyses, a significant difference regarding an earlier age at diagnosis in DEGS1 vs GNHIES98 was confined to women, which may reflect sex differences in care (eg, diagnosis of gestational diabetes) and/or healthcare services utilization.
In Germany, previous studies of changes in diabetes quality of care indicators over time have been confined to regional population-based studies11 or studies among primary care patients.30 In repeated population surveys conducted in southern Germany, recommended eye or foot examinations among adults with type 2 diabetes significantly increased between 1999–2001 and 2006–2008 (60.5% vs 71.3% and 37.5% vs 55.1% respectively), as did the use of lipid-lowering drugs (18.0% vs 37.9%), and the percentage of adults with diabetes achieving BP targets of <140/90 mm Hg (43.6% vs 70.5%).11 These findings are largely consistent with our results. However, unlike our findings, the proportions of persons with diabetes achieving HbA1c targets of <7.0% (53 mmol/mol) and those with a BMI ≤30 kg/m2 remained unchanged in the previous study.11 In a study based on data from 110 primary care practices across Germany, the proportion of patients with diabetes achieving HbA1c <6.5% (48 mmol/mol) increased from 31% in 1998 to 36% in 2005, while the percentage of patients with HbA1c ≥9.0% (75 mmol/mol) was halved from about 20% to 10% over this time period,30 roughly comparable to our findings from 23.5% in 1997–1999 to 4.6% in 2008–2011 (table 2). Our findings of improvements in diabetes-related complications among our sample are consistent with a variety of studies using various data sources over the past decade in Germany (eg, regional disease registries or hospital discharge data, selected sickness funds) reporting improvements in amputation rates, the incidence of blindness, and cardiovascular risk reduction, particularly among women.31–33
Time trend analyses of diabetes care indicators based on repeated national health surveys have been conducted in the USA. Results from these studies have consistently demonstrated significant improvements in the control of HbA1c, BP, and lipids among adults with diabetes, although absolute changes over the past decade were generally smaller than those observed in the present study.21 ,34–37 Between the 1999–2002 and 2007–2010 NHANES survey waves, the proportion of adults with diabetes achieving HbA1c <7.0% (53 mmol/mol), BP <130/80 mm Hg, and LDL-cholesterol <100 mg/dL increased significantly by 7.9, 11.7, and 20.8 percentage points, respectively,21 as compared to 32.9, 15.2, and 28.3 percentage points for HbA1c <7.0% (53 mmol/mol), BP <130/80 mm Hg, and TC <190 mg/dL in the present analysis. Unfortunately, some indicators are not directly comparable between NHANES and the German national health surveys. Unlike NHANES, the present study used TC instead of LDL-cholesterol, as the German surveys did not recruit a random subsample of adults who observed overnight fasting for at least 8 h.13 ,14 Alongside the significantly improved profiles of HbA1c, BP measures, and cholesterol, use of antidiabetic medication, antihypertensive agents, and lipid-lowering drugs significantly increased over time as observed in our study and previously in US population studies.34–37 We found that 8.0% of adults with diabetes in GNHIES98 and 13.6% in DEGS1 used a combination of insulin and oral agents, similar to 9.8% and 13.9% of adults with diabetes in the 1999–2004 and 2005–2010 NHANES waves.34 Over the same time period, lipid-lowering drug use increased from 18.2% to 39.6% among adults with diabetes in Germany as shown in this analysis, similar to increases in NHANES participants from 19.5% in 1999–2000 to 42.2% in 2007–2008.38 Consistent with our findings, analyses of data from the US Behavioral Risk Factor Surveillance System (BRFSS) survey waves 2000 and 2008 showed significant improvements with respect to the proportion of adults with diabetes reporting annual foot examinations and glucose self-monitoring.21 Unlike our findings, self-reported eye examination among adults with diabetes in BRFSS showed no further improvement over time,21 but baseline coverage for this indicator already achieved a much higher level in the USA in the 2000 survey with 75.1% compared to 51.1% in GNHIES98. Data from official health statistics (National Hospital Discharge Survey, US Renal Data System, National Vital Statistics System) have been systematically used to analyze trends in rates of diabetes-related complications in the USA and provide clear evidence for a decline in myocardial infarction, and death from hyperglycemic crisis, stroke, and amputation among people with diabetes between 1990 to 2010.39 This remains a major goal for diabetes surveillance in Germany, where evidence on long-term outcomes is limited so far.8
Despite significant improvements in diabetes care observed over the past decade, the current level of care in Germany as in other countries such as the USA,21 ,34–37 Canada,40 and Spain41 falls short of guideline recommendations. Similar to these studies,21 ,40 ,41 the results of the present analysis based on data from German national health surveys show that about two-thirds of persons with type 2 diabetes reached the target of HbA1c <7.0% (53 mmol/mol), and only 11.4% of patients with diabetes achieved stringent targets in HbA1c, TC, BP, and smoking combined. There was little change in the prevalence of current smokers among adults with diabetes in our study similar to US diabetes population studies.21 ,37 Rising obesity among diabetes populations is a concern for numerous countries37 and highlights population challenges of guideline-recommended weight reduction. Weight gain among persons with diabetes has been observed in relation to treatment with insulin and certain oral antidiabetic agents.42 ,43 Further insight from longitudinal studies is needed to assess the effect of weight gain on long-term cardiovascular risk and mortality.42 ,43
The major strength of this analysis is that it provides comprehensive data on changes in diabetes quality of care indicators over time including the time period before (1997–1999) and after (2008–2011) the introduction of DMPs and national evidence-based guideline implementation for type 2 diabetes in Germany. There are several limitations to this study. First, we cannot exclude selection bias, as persons who are severely ill, hospitalized, or institutionalized were not included. Therefore, our results may depict an overly optimistic picture of diabetes quality of care both cross-sectionally and over time. Second, diabetes diagnosis was self-reported and not verified by medical records as occurs in studies using patient registers. However, self-reported physician-diagnosed diabetes provides a valid and internationally established indicator7 ,34 ,44 which permits comparisons between countries as well as over time. Third, information on gestational diabetes was collected in DEGS17 but not in GNHIES98. Inclusion of women with gestational diabetes may have reduced the survey-specific rates of persons with diabetes who received pharmacological treatment or preventive eye and foot examinations in this study. Fourth, although data collection methods were kept comparable between surveys as far as possible, changes to analytical methods for physiological measurements remain a challenge to population-based monitoring of BP and biomarkers.18 ,34 Finally, this analysis was limited to intermediate outcome and process indicators of diabetes care available in both surveys. In particular, process of care indicators reflecting self-management and patient education were limited to glucose self-monitoring and holding a diabetes passport in this study.
Conclusions
In conclusion, many diabetes quality of care indicators have significantly improved over time from 1997–1999 to 2008–2011 in Germany, but a substantial proportion of adults with diabetes do not achieve guideline-recommended targets, particularly around lifestyle interventions such as smoking cessation, weight reduction, and physical activity similar to other international data. Surveillance of national-level diabetes quality indicators is required to evaluate the effects of changes in international guideline updates, national diabetes healthcare policy, and changes to care management. Social inequalities and regional variations in diabetes epidemiology and diabetes quality of care need to be a central focus of national surveillance activities. Most of all, the database regarding subjective quality of care as well as long-term outcomes and diabetes-related complications needs to be strengthened.
References
Supplementary materials
Supplementary Data
This web only file has been produced by the BMJ Publishing Group from an electronic file supplied by the author(s) and has not been edited for content.
- Data supplement 1 - Online appendix
Footnotes
Contributors YD helped conceptionalize the study, performed the statistical analyses, and drafted the manuscript. CH helped conceptionalize the study, reviewed and edited the manuscript, and contributed to the discussion. ASR performed the statistical modeling and contributed to the discussion. AB reviewed and edited the manuscript and contributed to the discussion. RP, HN, and AI reviewed the manuscript and contributed to the discussion. TR was in charge of laboratory measurement quality control and reviewed the manuscript. CSN conceptualized and supervised the study and substantially contributed to the writing of the manuscript. CSN is the guarantor who takes full responsibility for the work as a whole, including the study design, access to data, and the decision to submit and publish the manuscript. All authors read and approved the final version of the manuscript.
Funding National Health Surveys are funded by the Federal Ministry of Health Germany (BMG) as part of the continuous national health monitoring. YD was supported by a research grant from the Kompetenznetz Diabetes mellitus (Competence Network Diabetes mellitus) funded by the Federal Ministry of Education and Research (FKZ 01GI1110F).
Competing interests None declared.
Patient consent Obtained.
Ethics approval Charité Universitätsmedizin Berlin ethics committee.
Provenance and peer review Not commissioned; externally peer reviewed.
Data sharing statement No additional data are available specific to type 2 diabetes care among adults in Germany. For the DEGS survey system, additional data are available for research collaborations as described in the DEGS study protocol. http://www.biomedcentral.com/1471-2458/12/730