Article Text

Abstract
Objectives In patients with type 2 diabetes (T2D) and heart failure (HF), the optimal glycemic target is uncertain, and evidence-based data are lacking. Therefore, we performed a randomized study on the effect of optimized glycemic control on left ventricular function, exercise capacity, muscle strength, and body composition.
Design and methods 40 patients with T2D and HF (left ventricular ejection fraction (LVEF) 35±12% and hemoglobin A1c (HbA1c) 8.4±0.7% (68±0.8 mmol/mol)) were randomized to either 4-month optimization (OPT group) or non-optimization (non-OPT group) of glycemic control. Patients underwent dobutamine stress echocardiography, cardiopulmonary exercise test, 6 min hall-walk test (6-MWT), muscle strength examination, and dual X-ray absorptiometry scanning at baseline and at follow-up.
Results 39 patients completed the study. HbA1c decreased in the OPT versus the non-OPT group (8.4±0.8% (68±9 mmol/mol) to 7.6±0.7% (60±7 mmol/mol) vs 8.3±0.7% (67±10 mmol/mol) to 8.4±1.0% (68±11 mmol/mol); p<0.001). There was no difference between the groups with respect to changes in myocardial contractile reserve (LVEF (p=0.18)), oxygen consumption (p=0.55), exercise capacity (p=0.12), and 6-MWT (p=0.84). Muscle strength decreased in the non-OPT compared with the OPT group (37.2±8.1 to 34.8±8.3 kg vs 34.9±10.2 to 35.4±10.7 kg; p=0.01), in line with a non-significant decrease in lean (p=0.07) and fat (p=0.07) tissue mass in the non-OPT group. Hypoglycemia and fluid retention did not differ between groups.
Conclusions 4 months of optimization of glycemic control was associated with preserved muscle strength and lean body mass in patients with T2D and HF compared with lenient control, and had no deleterious effect on left ventricular contractile function and seemed to be safe.
Trial registration number NCT01213784; pre-results.
- Heart Failure
- Glycemic Control
- Type 2 Diabetes
- Stress Echocardiography
This is an Open Access article distributed in accordance with the Creative Commons Attribution Non Commercial (CC BY-NC 4.0) license, which permits others to distribute, remix, adapt, build upon this work non-commercially, and license their derivative works on different terms, provided the original work is properly cited and the use is non-commercial. See: http://creativecommons.org/licenses/by-nc/4.0/
Statistics from Altmetric.com
Key messages
Four months of optimized glycemic control is associated with preserved muscle strength.
An increase in insulin dosage has no deleterious cardiovascular effects.
An HbA1c level of 7.5% seems to be a safe treatment goal in patients with T2D and HF.
Introduction
Heart failure (HF) and type 2 diabetes (T2D) are closely linked and causally related.1 T2D increases the mortality rate in patients with HF by 50–100% compared with patients with non-T2D and HF resulting in a 5-year mortality of nearly 40%.2 ,3 It is unsettled whether antidiabetic treatment and/or optimized glycemic control can reduce this excess mortality.2 ,4–8
In a population-based cohort, a strong association has been shown between glucometabolic pertubations and prevalent HF;9 and in high-risk patients, fasting plasma glucose is an independent predictor of hospitalization for HF,10 suggesting direct beneficial effects of lowering glucose. However, considerable controversy exists about the overall effect of antidiabetic agents on outcomes in people with comorbid T2D and HF, and metformin is the only antidiabetic not associated with harm.7 ,11 Nonetheless, patients with T2D often progress to insulin therapy, and at present no randomized trials12 have evaluated the optimal glycemic level in patients with T2D and HF. Observational evidence13 suggests that tight glycemic control (HbA1c<7% (53 mmol/mol)) may be associated with worse prognosis than less tight control, irrespective of the agent used. However, the higher mortality among patients subjected to tight glycemic control can in part be explained by a decrease in HbA1c in the sickest patients with HF with cachexia.
The excess mortality among patients with T2D and HF can be caused by a deranged metabolism in cardiac and skeletal muscle.14 Increased levels of catabolic hormones in patients with HF cause insulin resistance, hyperglycemia, hyperinsulinemia, lipolysis, and proteolysis,15 which may affect left ventricular function and promote the progression of HF.14 In patients with HF, we have demonstrated abnormalities of whole-body protein turnover and muscle metabolism.16 These changes lead to muscle wasting17 ,18 that contributes to a poor prognosis.19 Being an anabolic hormone,20 insulin may prevent these changes, and studies suggest that insulin treatment may improve left ventricular function21 and cardiac efficiency.22 ,23
The present study was undertaken to obtain randomized data on the effects of reducing blood sugar to 7.5% (58 mmol/mol) in patients with T2D and HF. We hypothesized that optimization would have no deleterious effect on left ventricular function or at best increase the performance of the heart. As secondary end points, we looked on the effect on cardiopulmonary exercise (CPX) capacity, body composition, and muscle strength.
Subjects and methods
Patients
We included 40 patients with chronic HF and dysregulated T2D (HbA1c≥7.5% (58 mmol/mol)). The patients were stable on optimal HF medication, in New York Heart Association (NYHA) class 2–3, and had left ventricular ejection fraction (LVEF)≤45%. We excluded patients who had significant cardiac valve disease, physical or psychological disability, severe angina, were unable to give informed consent, and whose age was below 18 years.
Design
Patients were recruited and randomized 1:1 between September 2010 and November 2012 in blocks of 8–4 months of either optimization (OPT) or no optimization (non-OPT) of glycemic control by drawing sealed envelopes in an open-labeled design. All patients were assigned to an outpatient diabetes clinic regardless of the randomization outcome, and they were told not to change their antidiabetic medication unless instructed to do so. The treatment target for the OPT group was HbA1c<7.5% (58 mmol/mol). Glycemic control was optimized by assessment of the daily blood glucose profile, adjustment of the insulin dosage, use of oral antidiabetics, and by supply of dietary advice provided by a trained dietician during contacts to the outpatient clinic and tailored to the individual patient's needs. Events of sensed or measured hypoglycemia (blood glucose <4 mM) were registered.
Patients randomized to the non-OPT group were instructed to continue their prescribed antidiabetic medication, but doses were reevaluated and reduced if necessary in case of hypoglycemia. Antidiabetic treatment was intensified if blood glucose measurements increased and HbA1c reached a level above 10% (86 mmol/mol). Anticongestive medications were not altered during the study period.
The primary outcome was defined as changes in left ventricular contractile reserve capacity function from baseline to follow-up measured by dobutamine stress echocardiography. Secondary outcomes were changes in resting echocardiographic measures of systolic and diastolic function, CPX capacity, muscle strength, fat and lean tissue mass measured by DXA, and N-terminal pro-brain natriuretic peptide (NT-proBNP).
Echocardiography
Echocardiography was performed by a single operator. Sonovue (Bracco, Initios Medical AB, Copenhagen, Denmark) was administered intravenously to enhance the left ventricular endocardial border delineation. LVEF was measured using the biplane-modified Simpson's method and wall motion scoring (WMS) by registering the contractile function of each segment. Peak systolic longitudinal mitral plane velocities during the ejection phase (S′max) were measured by tissue Doppler imaging and global strain by two-dimensional speckle tracking. Measurements were performed at rest and during the dobutamine stress test. However, Sonovue was only administered at rest and at peak dobutamine levels. We assessed the left ventricular diastolic function from the E/A ratio and E/e′ ratio. The parameters were estimated as the average of either three (sinus rhythm) or five (atrial fibrillation) consecutive heart beats. All echocardiographic investigations were blinded prior to analysis. During the dobutamine stress test, blood pressure and heart rate were registered, and echocardiography was performed after 3 min at each dobutamine stress level (5, 10, 20, 30, 40 µg/min/kg).
Six minutes hall-walk test
The patients performed a 6 min hall-walk test (6-MWT) on a straight 50 m indoor course after echocardiography and at least 30 min of rest.
CPX test
Patients performed a staged exercise bicycle test using a ZAN600 CPET (nSpire Health GmbH, D-97723 Oberthulba, Germany) with stages lasting 1 min and with increments of 10 W/min. Blood pressure, heart rate, and ECG were measured repeatedly every second minute. Oxygen consumption was measured continuously.
Muscle strength, body composition, and questionnaire
Muscle strength was measured by hand-grip strength (Jamar hydraulic hand dynometer (5030J1) Sammons Preston Rolyan, USA) according to the manufacturer by trained technical staff that were unaware of the randomization. The strength of each hand was defined as the average of three repeated measurements. Body composition was investigated by dual-energy X-ray absorptiometry (DXA) scanning on a Hologic Dicovery W (Santax Medico, Denmark). Whole-body lean tissue mass and fat tissue mass were measured, and the patients filled out the self-reported 12-item short form health survey (SF-12).
Blood samples
Blood samples were analyzed for creatinine, urea, electrolytes, alanine-aminotransferase, HbA1c, hemoglobin, low-density lipoprotein (LDL), triglycerides, non-esterified fatty acids (NEFA), insulin-like growth factor 1 (IGF-1), and NT-proBNP, cortisol, metanephrines, glucagon, C peptide, and insulin levels.
Statistics
On the basis of the previous investigations of the reproducibility of echocardiography, a design with 40 enrolled patients, an expected drop-out of 10%, a significance level of 5%, a power of 80%, and a coefficient of variation of ∼ 5%, we expected to be able to detect changes in left ventricular function in the order of 4%.
Baseline characteristics are presented as numbers for categorical variables and mean±SD or median (25–75th centile). For comparison between groups at baseline, Student's unpaired t test was used for normally distributed data, Wilcoxon rank sum test for skewed data, and Fischer's exact test. Outcome measurements were analyzed using a repeated measurement mixed-effects linear model (xtmixed) unless stated otherwise. p Values refer to the interaction of our intervention (ie, glycemic optimization) on time unless reported otherwise. Post hoc t tests based on the mixed effect model were used to assess development over time and during dobutamine stimulation in each group and between the groups. The results of the estimated mean difference are presented with SEM unless stated otherwise. Stata V.12 (College Station, Texas, USA) was used for statistics.
Ethics statement
Data were collected according to the protocol at the Department of Cardiology, Department of Endocrinology and Metabolism, and the Department of Medicine, Viborg, Denmark. The protocol was approved by the Central Denmark Region Committee on Health Research Ethics (ID: 20090047) and conducted according to the Declaration of Helsinki. Informed written consent was obtained from each patient. The project is registered at http://www.clinicaltrial.gov identifier NCT01213784.
Results
Patients
A total of 91 patients were screened for eligibility, and 40 patients were enrolled. One patient withdrew consent (allocated to non-OPT), and was lost to follow-up. Thirty-nine patients completed the study. Three patients withdrew consent to the dobutamine stress test due to discomfort. Eleven patients could not perform the CPX test due to knee/leg pain or discomfort using the breathable device. Eight patients had to cease the 6-MWT due to pain in the lower extremities.
Patients were similar in each group with regard to baseline characteristics, here among duration of T2D and related complications (retinopathy, nephropathy, and neuropathy). However, diastolic blood pressure was highest in the OPT group (p=0.03) (table 1).
Patient characteristics in each group (mean±SD/median (25–75%)/n)
Intervention
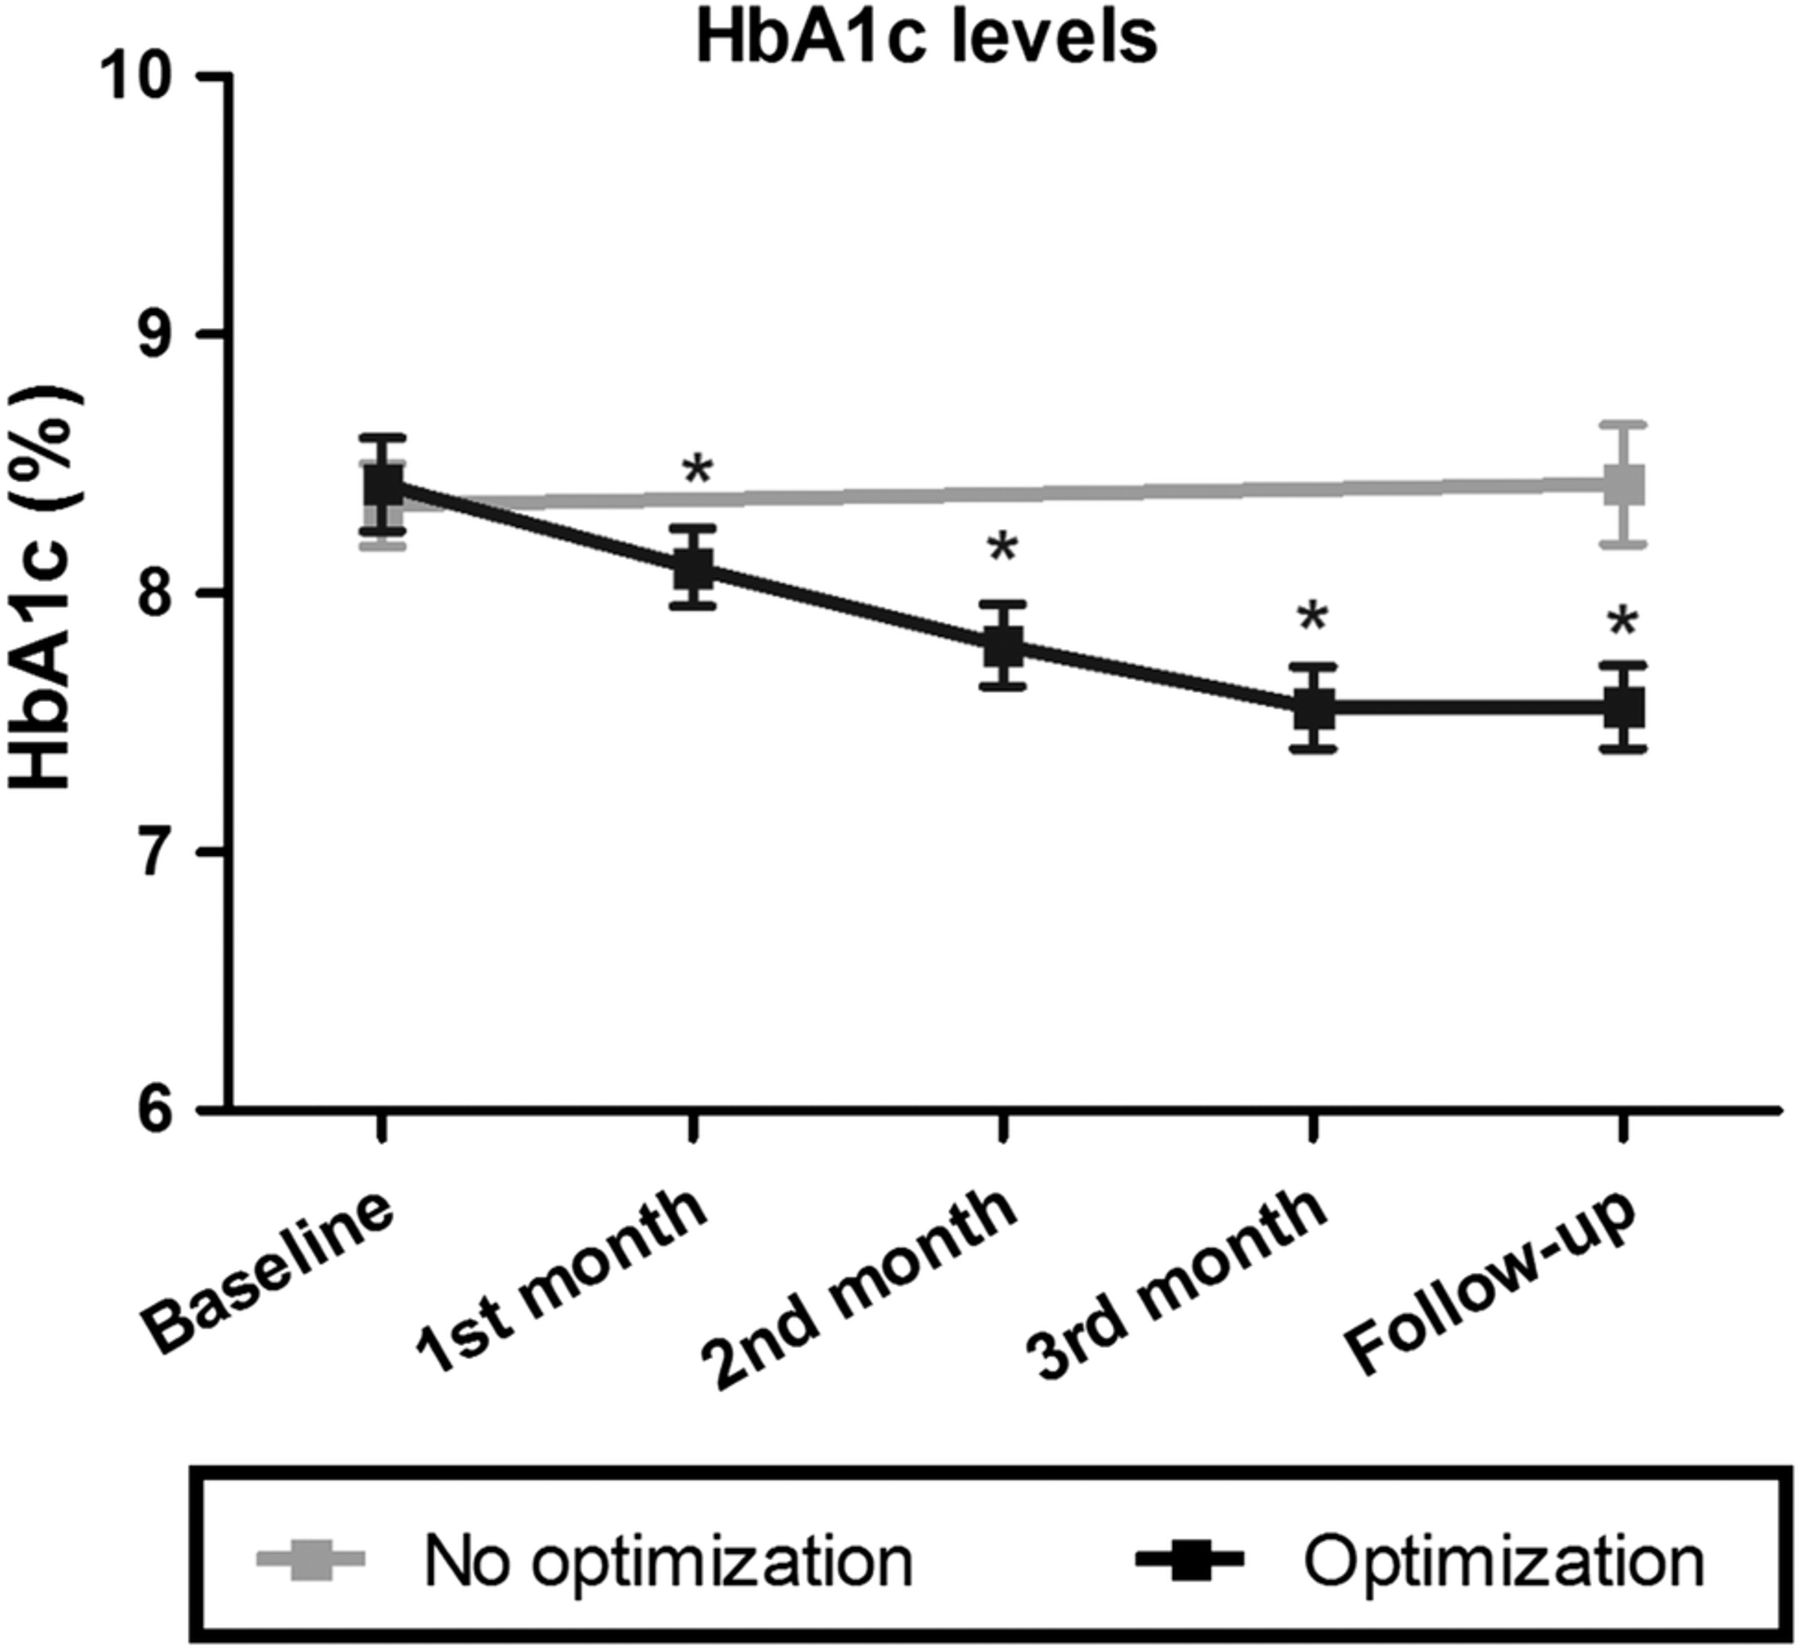
HbA1c was reduced by 0.9±0.1% (9±2 mmol/mol) (p<0.001) from baseline to follow-up in the OPT group (table 1), and had already decreased significantly after 1 month, but did not differ during the second and the third months as compared with follow-up (figure 1). In the non-OPT group, HbA1c was unchanged during the study period (p=0.63) (table 1, figure 1).

Hemoglobin A1c levels during the study (mean±SEM). The change from baseline to follow-up between groups differed significantly (p<0.001). *Indicates significant difference (p<0.05) as compared with baseline.
The change in fasting blood glucose levels differed significantly between the study groups (p=0.02) (table 2). In the OPT group, patients had 10±5 contacts to the diabetes outpatient clinics. Their contacts consisted of 6±3 consultations, 3±3 phone contacts, and 1±1 dietician visits during the intervention period. Medical glycemic optimization was achieved by adjusting the insulin and the metformin dosages (table 2). In the non-OPT group, one patient had insulin dosage adjusted for safety reasons as HbA1c rose to more than 10% (86 mmol/mol). Eleven patients experienced hypoglycemia in the non-OPT group as compared with 12 patients in the OPT group. There was no difference between the two groups with regard to the total number of hypoglycemia events (p=0.33), and there was no hospitalization due to worsening of heart failure. The dose of loop diuretics (furosemide) did not change in any of the groups during the study period (p=0.75, online supplementary table S1).
Changes in antidiabetic treatment, weight, DXA, CPX, and 6 min hall-walk test
Supplemental material
Echocardiographic and blood pressure measurements
There was no difference between the two groups with regard to changes in myocardial contractile reserve measured by LVEF, strain, S′max, WMS (figure 2) or diastolic parameters (E/A ratio (p=0.26), or E/e′ (p=0.13), online supplementary table S2). Resting S′max decreased in the OPT group compared with the non-OPT group (p=0.04 for interaction, online supplementary table S2). However, there was no interaction of glycemic optimization on time in any other measurements of left ventricular function neither at rest (LVEF: p=0.97; strain: p=0.42; WMS: p=0.57) nor at peak dobutamine stress (LVEF: p=0.96; strain: p=0.54; S′max: p=0.77; WMS: p=0.41), and likewise there was no interaction on changes in blood pressure or heart rate at rest (systolic blood pressure: p=0.97; diastolic blood pressure: p=0.11; heart rate: p=0.17) or at peak dobutamine-stress level (systolic blood pressure: p=0.17; diastolic blood pressure: p=0.98; heart rate: p=0.15) (see online supplementary table S2).
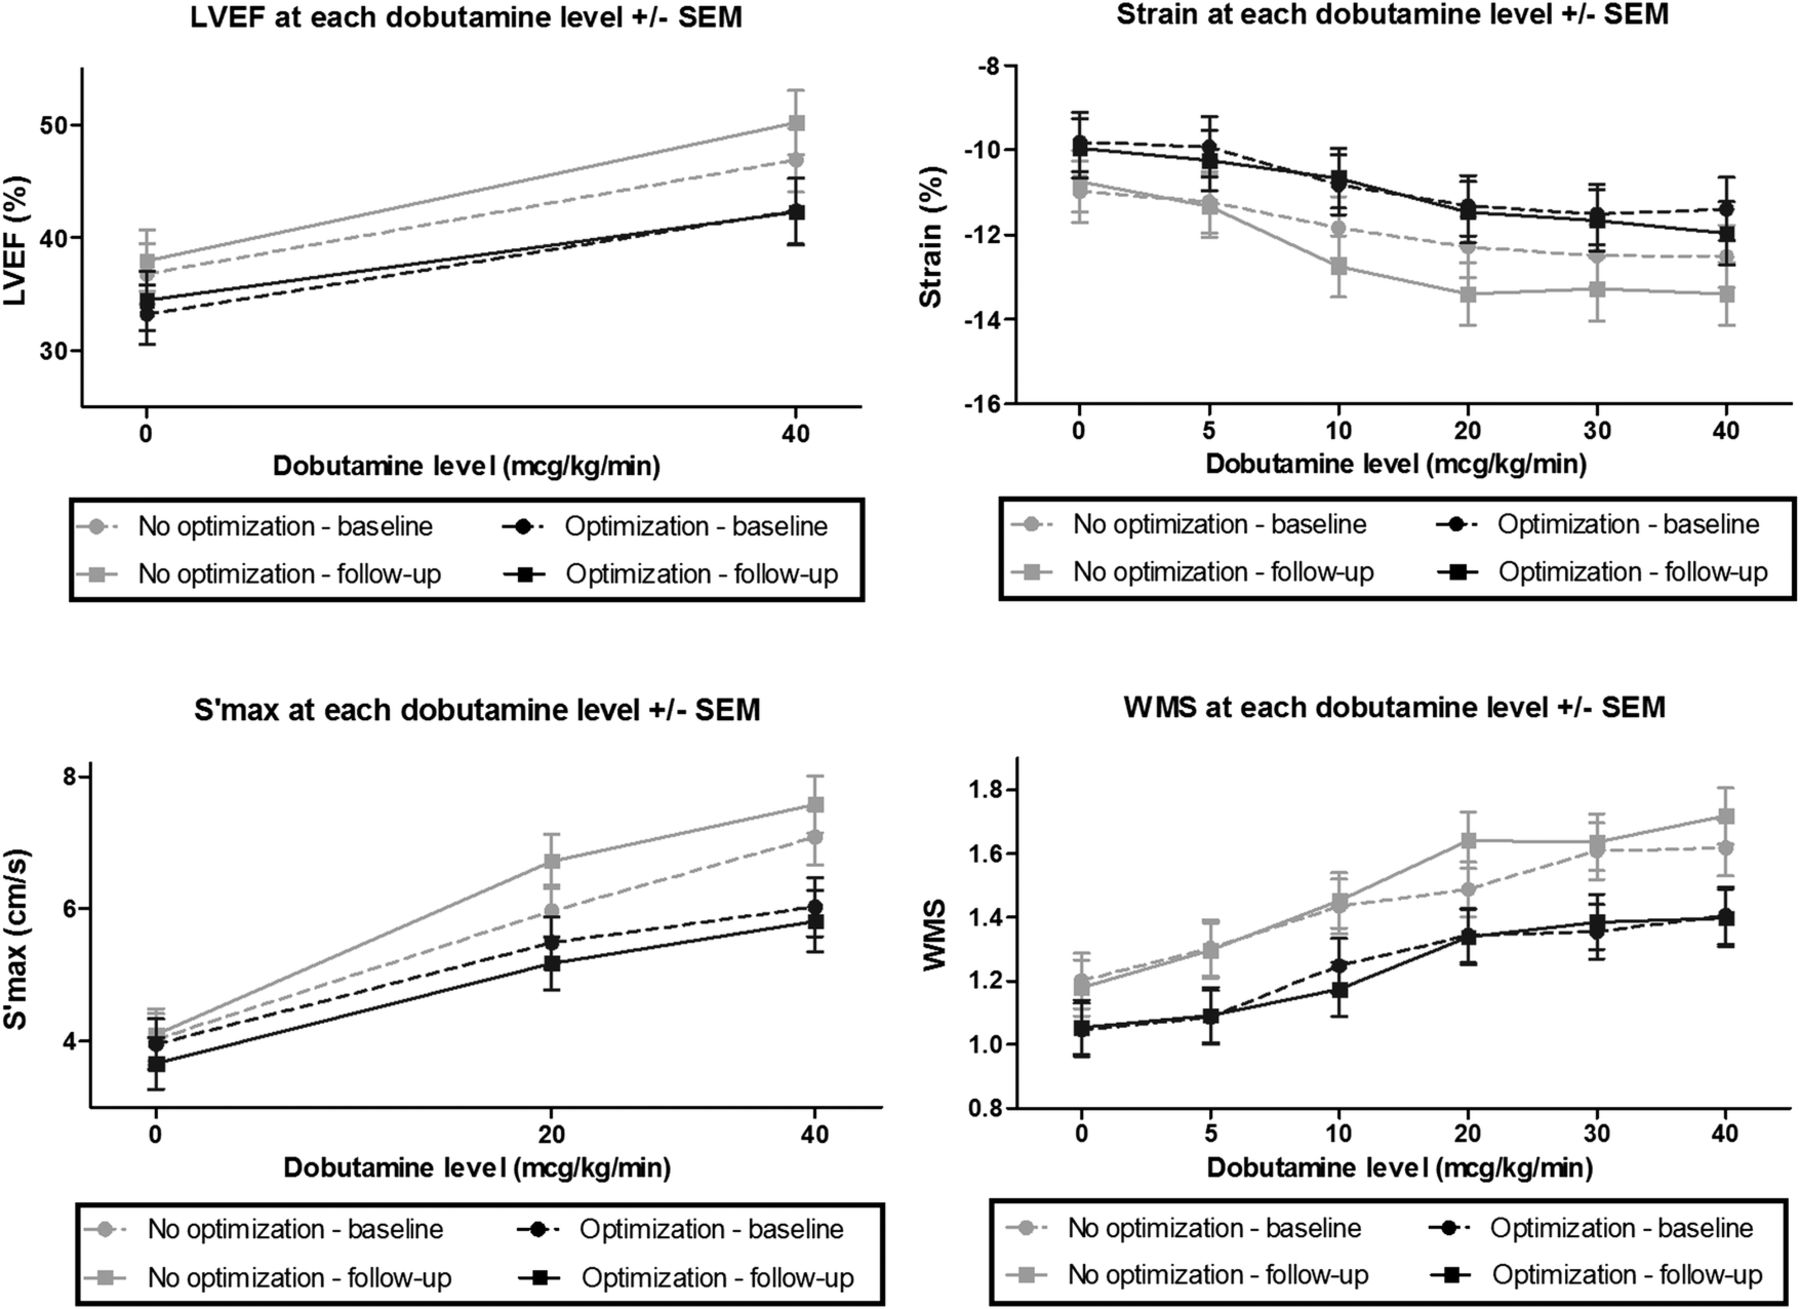
Measurements of myocardial contractile function at rest and during dobutamine stress test (mean±SEM) in each study arm at baseline and follow-up.The change from baseline to follow-up did not differ between study arms with regard to (A) left ventricular ejection fraction (p=0.18), (B) strain (p=0.10), (C) S′max (p=0.32) and (D) wall motion scoring (p=0.35).
Muscle strength, body composition, and exercise testing
Muscle strength deteriorated by −2.4±0.8 kg in the non-OPT group (p=0.002), hence significant differences in changes between the two groups were observed (p=0.01) (figure 3, table 2) without any differences in the baseline values (p=0.46). When comparing patients in whom muscle strength decreased with those in whom it remained unchanged or increased, no differences in duration of diabetes, HF, baseline level of HbA1c, LVEF, or age were found. DXA examinations did not differ at baseline (lean: p=0.52; fat: p=0.23), and difference in changes in lean (p=0.07) and fat (p=0.07) tissue mass from baseline to follow-up did not reach statistical significance (table 2). Baseline measurements on walking distance (p=0.28), exercise capacity (p=0.88), peak oxygen consumption (p=0.82) did not differ and we found no treatment effect on these parameters (table 2).

Muscle strength—handgrip test. Difference between baseline and follow-up is shown for each patient with lines and bars marking mean±SEM for each group. The p value refers to the difference in delta value between groups.
SF-12 questionnaire
Optimization of glycemic control had no effect on changes in the self-reported SF-12 questionnaire score during the study period in the OPT group compared with the non-OPT group (p=0.66, online supplementary table S1).
Blood samples
NEFA decreased in the OPT group (p=0.02), but did not change in the non-OPT group (p=0.93). However, the difference in changes between the two groups did not reach significance (p=0.14, online supplementary table S1). Glucagon levels decreased significantly by 10% in the OPT group (p=0.01), but did not change in the non-OPT group, and the difference from baseline to follow-up between the groups were significant (p=0.04, online supplementary table S1). The intervention had no effect on difference in changes in creatinine, urea, C peptide, IGF-1, cortisol, metanephrine, or NT-proBNP levels between the two groups (see online supplementary table S1).
Discussion
This randomized study is the first to evaluate the effect of tighter glycemic control in patients with T2D and HF based on a ‘real-life’ setting in diabetes outpatient clinics. The main findings are that 4 months of glycemic optimization had no deleterious effect on left ventricular contractile reserve and CPX capacity. Muscle strength declined in patients with non-optimized T2D and HF (unchanged HbA1c of 8.4% (68 mmol/mol)) compared with patients who were subject to tighter glycemic control to an HbA1c level of 7.6% (60 mmol/mol). No difference in the incidences of hypoglycemia or fluid retention was recorded between the two settings.
Cardiac effects
We found no deleterious effect of 4 months of optimization of glycemic control on left ventricular systolic or diastolic contractile reserve capacity in patients with T2D and HF. The dobutamine stress test was used to evaluate the contractile reserve. It was chosen owing to its prognostic value in patient with diabetes.24 Resting S′max did seem to decrease in the OPT group, but we believe that the significance of this finding should be interpreted cautiously since all other measures of changes in left ventricular systolic and diastolic function did not differ between the study groups.
The patients achieved optimization of glycemic control owing to close contact with the outpatient clinics through visits and phone and dietician consultancy. Their medical treatment was predominantly adjusted through an increase in insulin dosage, which is otherwise known to cause fluid retention and may have unfavorable effects in patients with T2D and HF.7 Our findings are intriguing and useful for clinicians treating these patients because they indicate that an increase in insulin dosage does not give rise to weight gain, does not worsen symptoms (SP-12), and entails no deterioration in left ventricular reserve function or CPX capacity in these patients when glycemic levels are optimized. However, these findings need to be confirmed in larger studies before definitive statements regarding T2D treatment in HF are incorporated into clinical guidelines.
The results from short-term studies have shown disappointing effects of increases in substrate accessibility on left ventricular function in patients with T2D and HF.25 ,26 This indicates that possible beneficial effects of metabolic intervention may require long-term intervention. In the present randomized trial, patients with T2D and HF underwent 4 months of glycemic optimization. This result suggests that optimization of glycemic control to an HbA1c target of 7.5% (58 mmol/mol) should not be sought specifically in an attempt to improve left ventricular contractile function, but on the other hand does not cause any harm.
Muscle strength and body composition
Muscles are continuously undergoing remodeling, which, during ageing, involves net muscle wasting and sarcopenia.27 Muscle wasting is even more pronounced in patients with HF in whom it correlates with reduced muscle strength.28 Investigations have revealed that sarcopenia is also frequent in other chronic conditions and is associated with cachexia.29 This is believed to be partly due to low-grade inflammation and release of pro-inflammatory cytokines, which induces an imbalance in proteolysis and protein synthesis and thus leads to muscle wasting.18 Such loss of whole-body mass, lean body mass, and muscle strength is a strong predictor of outcome in patients with T2D30 and HF,18 ,31 and the loss of muscle strength is even more pronounced in case of coexisting T2D and HF.32 Approaches to prevent or even reverse the loss of muscle mass and muscle function are therefore highly relevant in patients with T2D and HF. A promising target is optimization of glycemic control as poorly regulated diabetes is related to reduced muscle strength.33 During a follow-up period of only 4 months, we found a 6% reduction in muscular strength in the non-OPT group at a stable HbA1c of 8.4% (68 mmol/mol). This deterioration is six times higher than the age-related decline in muscle strength.27 We believe that such a degree of muscle wasting is due to a combination of HF and poorly regulated T2D in the present study population,28 ,33 but this remain merely speculative as no clinical prospective studies have to the best of our knowledge evaluated muscle wasting in patients with T2D and HF . However, optimization of glycemic control to an HbA1c level of 7.6% (60 mmol/mol) preserved muscle strength, which was consistent with a trend toward preserved lean and fat tissue mass in the OPT group as compared with the non-OPT group (table 2). We observed no effect on cardiopulmonary capacity and 6-MWT results (table 2). However, these tests may be restricted by leg fatigue, joint pain, or other factors, which may limit their value34 and quite a few of our patients were unable to perform the exercises. In previous trials, muscle wasting was a prognostic factor independent of exercise capacity and LVEF,18 and wasting was associated with increased hospitalization and mortality.19 The rapid decline in muscle strength observed in the non-OPT group is a strong indicator of the importance of achieving acceptable glycemic control in these high-risk patients.
Study limitations
The present study was designed to mirror a ‘real-life’ outpatient setting with a multifaceted, individually tailored antidiabetic approach. The predominant pharmacological change in the OPT group was in the form of an increase in insulin dosage. It is unknown whether other strategies such as incretin administration would have had other beneficial effects. However, this study was not designed to evaluate the effect of a certain drug, the frequency of glucose measurements or visits, or how to intensify glycemic control, but rather to evaluate the effect of a moderate reduction of glycemic levels.
It is possible that a larger reduction in HbA1c and enrollment of more symptomatic or cachectic patients would have yielded different results. However, the baseline characteristics of the patients in the present study are similar to those reported in previous studies of unselected patients from heart failure clinics,3 ,35 and they are representative of moderately dysglycemic patients.36
To evaluate on muscle strength, we applied hand grip test. Even though 6-MWT and CPX testing were performed, we cannot conclude to what extent muscle strength was affected in the lower extremities as the applied tests are limited by cardiopulmonary capacity and musculoskeletal conditions.34 Thus, we argue that muscle strength assessment focusing on upper and lower extremities should be performed in future studies.
It can be argued that optimized glycemic control for a longer duration than 4 months could have shown beneficial cardiac effects. However, other medical heart failure therapies with documented prognostic benefit and similar duration as used in the present study have shown to improve cardiac function.37
We enrolled 40 patients and performed power calculation based on cardiac functional parameters. Thus, we cannot rule out the possibility of type 1 and type 2 errors on our outcome measurements, such as muscle strength and lean body mass, and our results need to be confirmed in large-scale studies. Future studies evaluating tighter glycemic control should be powered to elucidate the effect on clinical outcomes, such as mortality and hospitalization.
Conclusion
In patients with T2D and HF, intensified glycemic control prevented deterioration in muscle strength, without increasing the incidence of hypoglycemic events, fluid retention or affecting left ventricular contractile reserve and cardiopulmonary capacity. However, large-scale randomized trials evaluating clinical end points are needed.
References
Footnotes
Contributors All authors contributed considerably to discussions on protocol design and provided critical revision of the manuscript. RN finalized the protocol, conducted the study, analyzed the data, drafted the manuscript, and incorporated coauthors’ suggestions into the manuscript, and is the guarantor of the manuscript. HN, HW, and AB drafted the protocol. HW and HEB assisted with the cardiac examinations, interpretations, and defining cardiac outcomes. JR recruited patients. JA participated with interpretation concerning DXA examinations. HN, NM, and HHT assisted with recruitment, intervention, defining outcomes, and participated with advice concerning non-cardiac outcomes.
Funding The study was supported by an unrestricted grant from The Danish Diabetes Association (no grant number assigned).
Competing interests None declared.
Ethics approval The Central Denmark Committee on Health Research and Ethics.
Provenance and peer review Not commissioned; externally peer reviewed.
Data sharing statement Original raw data will be kept on the site of collection for 5 years after publication. It will be accessible only by the authors or with proper legal authority.