Article Text

Abstract
Aims Understanding type 2 diabetes mellitus is critical for designing effective diabetes prevention policies in Qatar and the Middle East.
Methods Using the Qatar 2012 WHO STEPwise approach to surveillance survey, a subsample of 1224 Qatari participants aged 18–64 years was selected. Subjects had their fasting blood glucose levels tested, had not been diagnosed with or treated for diabetes, had a fasting time >12 hours and were not pregnant. We applied a hypothesized structural equation model (SEM) to assess sociodemographic, behavioral, anthropometric and metabolic variables affecting persons with type 2 diabetes mellitus.
Results There is a direct effect of triglyceride levels (0.336) and body mass index (BMI) (0.164) on diabetes status. We also found that physical activity levels negatively affect BMI (−0.148) and positively affect high-density lipoprotein (HDL) (0.106); sociodemographic background negatively affects diet (−0.522) and BMI (−0.352); HDL positively affects total cholesterol (0.230) and has a negative effect on BMI (−0.108), triglycerides (−0.128) and waist circumference (−0.104). Diet has a positive effect on triglycerides (0.281) while family history of diabetes negatively affects total cholesterol (−0.104). BMI has a positive effect on waist circumference (0.788) and mediates the effects of physical activity over diabetes status (−0.028). BMI also mediates the effects that sociodemographic factors (−0.058) and physical activity (−0.024) have on diabetes status. BMI and HDL (−0.002) together mediate the effect of physical activity on diabetes status and similarly HDL and tryglycerides (−0.005) also mediate the effect of physical activity on diabetes status. Finally diet and tryglycerides mediate the effects that sociodemographic factors have on diabetes status (−0.049).
Conclusions This study's main finding is that triglyceride levels and BMI are the main variables directly affecting diabetes status in the Qatari population.
- Lipids and Diabetes
- Analytic Methods
- Triglycerides
- BMI
This is an Open Access article distributed in accordance with the Creative Commons Attribution Non Commercial (CC BY-NC 4.0) license, which permits others to distribute, remix, adapt, build upon this work non-commercially, and license their derivative works on different terms, provided the original work is properly cited and the use is non-commercial. See: http://creativecommons.org/licenses/by-nc/4.0/
Statistics from Altmetric.com
Key messages
What is already known about this subject?
Diabetes and metabolic disease are serious public health challenges in Qatar, and carry an increasing burden of disease to the health systems in the WHO East Mediterranean region.
What are the new findings?
This study shows that BMI and triglyceride levels are the main variables affecting diabetes status in Qatari nationals mediated by levels of physical activity, sociodemographic variables like education level and marital status and dietary patterns.
How might these results change the focus of research or clinical practice?
The results of this study show the potential that behavioral and metabolic interventions might have in reducing the impact that diabetes has in Qatar's health system.
Introduction
The global epidemic of type 2 diabetes mellitus and other non-communicable diseases (NCDs) have affected the Middle East and Northern Africa particularly severely.1–6 According to the WHO, the Eastern Mediterranean region has the second highest regional prevalence of type 2 diabetes in the world at 9.3%.7 Diabetes attributable deaths are expected to increase by two-thirds between 2008 and 2030 and the global prevalence of pre-diabetes will increase to 470 million by 2030.8–10 These consequences will predominantly affect Northern Africa and the Middle East, where the prevalence of type 2 diabetes is expected to rise to 10.8% by 2030.7 One of the Middle Eastern countries most affected by the diabetes epidemic is Qatar, where the STEPwise approach to surveillance (STEPS) survey reported prevalence of diabetes for Qatari nationals was 16.7% in 2012.11 ,12
The high and growing prevalence of type 2 diabetes in the region has heightened the need for effective early interventions that tackle the disease's long-term harmful effects at both individual and health system levels.5 ,13–18 There is a strong link between anthropometric and metabolic risk factors and both pre-diabetes and type 2 diabetes. Early detection of individuals at risk for developing type 2 diabetes is an effective tool for reducing the prevalence and impact of the disease. In addition, early detection is critical to helping define an individual's subsequent risk for developing type 2 diabetes.12 ,19 ,20
The disease pathway of type 2 diabetes is defined by stepwise increases in blood glucose level and consists of three stages. The first stage, known as normoglycemia, encompasses the normal glucose range of 65–99 mg/dL. The second stage, termed pre-diabetes, occurs in people with blood glucose levels between 100 and 126 mg/dL.21 The final stage is the full expression of a diabetic state and is defined by a blood glucose level >126 mg/dL.22
Transitioning to type 2 diabetes is associated with the simultaneous presence of increased insulin resistance and β-cell dysfunction associated with an abnormal lipid profile. This dynamic pathway is theorized to be closely linked to abnormal glucose levels that are present once type 2 diabetes has been diagnosed.9 ,23–27 These abnormalities are hypothesized to start before glucose changes are detectable, suggesting that early lifestyle and behavioral interventions in high-risk individuals are effective at reducing the risk of developing type 2 diabetes.9 ,23–27 For this reason, WHO recommends type 2 diabetes screening in non-clinical settings for behavioral, metabolic and cardiovascular risk factors that lead normoglycemic subjects first to a prediabetic state and then to type 2 diabetes.21
The WHO has identified the following risk factors for type 2 diabetes: obesity, high blood pressure, smoking, lipid abnormalities, family history of diabetes and low consumption of fruit and vegetables.28 Despite the high prevalence of type 2 diabetes in the Middle East, few studies have examined type 2 diabetes in a Middle Eastern context. We propose using a structural equation model (SEM) as a novel method to test a hypothesized model of cross-sectional variables affecting diabetes status in the Qatari population, using data from a WHO nationally representative survey of Qatari nationals. Examining type 2 diabetes in this region using a SEM has the benefit of allowing us to hypothesize and model specific regional disease frameworks linked to particular metabolic profiles and behavioral patterns. Analysis with SEM permits us to define local interactions of sociodemographic, behavioral, anthropometric and metabolic variables in terms of direct effects and indirect (ie, mediator) effects on diabetes status.28 Unlike traditional regression models, SEM can simultaneously assess all relevant regression pathways as either independent and/or dependent factors that play a role in type 2 diabetes.28
Research design and methods
The Qatar STEPS survey
WHO developed the STEPS to support countries in building and strengthening their capacity to conduct NCD surveillance programs.29–33 The STEPS tool is a risk factor assessment instrument that gathers information at three different levels. The first level gathers demographic and behavioral risk factor information using a questionnaire; the second collects physical measurements in a household setting; the third collects fasting blood samples for biochemical tests.34
In this framework, risk factors were defined as any attribute, characteristic or exposure that would increase an individual's probability of developing a chronic NCD. According to the WHO World Health Report 2002, the major identified behavioral risk factors for developing type 2 diabetes are tobacco use, harmful alcohol use, unhealthy diet (low fruit and vegetable consumption) and physical inactivity,35 while the major biological risk factors are overweight and obesity, raised blood pressure, raised fasting blood glucose (FBG), abnormal blood lipids and raised total cholesterol.35 The above-mentioned behavioral and biological risk factors are captured in the STEPS risk factor instrument.
The STEPS survey conducted in Qatar in 2012 was a nationally representative survey that included only Qatari nationals between the ages of 18 and 64 years.12 This STEPS survey uses a sample frame consisting exclusively of Qatari households in order to assess only the stable population of Qatar.12 The sample size was 2850 Qatari citizens and the overall non-response rate was 12%, resulting in 2496 Qatari citizens being interviewed.
FBG levels and exclusion criteria
Participants were included in our study if they had a FBG test performed, no lifetime diagnosis of diabetes, were not pregnant during the test and had not eaten during the previous 12 hours or taken any form of diabetes or dyslipidemia medication. Based on these criteria, 1133 participants were included in our analyses. According to international standards,21 we defined subjects with a FBG above 126 mg/dL as having type 2 diabetes and those with a FBG between 100 and 125 mg/dL as prediabetic. Normoglycemia, was defined as a FBG between 65 and 99 mg/dL for the purpose of building our hypothetical model.21
Variables and effects assessed
We selected the sociodemographic, behavioral, anthropometric and metabolic variables to be included in our SEM based on a literature review of previous theoretical models of diabetes transition.28 ,36–38 We assessed 23 variables including: sex, age, highest level of education (defined as no formal schooling, less than primary school, primary school completed, preparatory school completed, secondary school completed, college/university completed and postgraduate degree), marital status (never married, currently married, divorced and widowed), consanguinity between father and mother (yes or no), smoking status (was defined as positive if a subject ever smoked), body mass index (BMI) (<18.5, 18.5–24.9, 25–29.9, 30–40, >40), family history of diabetes, waist circumference (male: <94, 94–102, >102 cm; female:<80, 80–88, >88 cm), blood pressure (either >135mm Hg systolic and/or >85 mm Hg diastolic or current treatment or diagnosis of high blood pressure), FBG (<100 mg/dL, 100–125 mg/dL, >125 mg/dL), HDL (<40, 40–60, >60 mg/dL), triglycerides (<150, 150–200, >200 mg/dL), total cholesterol (<200, 200–240, >240 mg/dL) and physical activity (average self-reported hours per week of vigorous-intensity work and sports activities, moderate-intensity activity for sports and work, and walking). We also included measures of dietary quality based on the STEPS tool.35 These included fruit and vegetable intake using the 7-day average recall dietary assessment of the STEPS questionnaire.29 ,34 ,39 With these two dietary components we created Healthy Eating Index—2010 (HEI) scores.40 The HEI is a measure of diet quality that is independent of quantity and that can be used to assess compliance with the US Dietary Guidelines for Americans and monitor changes in dietary patterns.40 It is based on a score between 0 and 5, where 5 is the highest quality diet. We also included as a measure of dietary quality the number of days per week the participants ate out of their homes and the self-reported weekly frequency of fast food consumption.
Statistical analysis and SEM
SEM and factor analysis of diet, physical activity and sociodemographic characteristics were used to describe the sociodemographic, latent behavioral, anthropometric and metabolic variables affecting normoglycemia, pre-diabetes and diabetes based on the model used by Bardenheier et al.28 SEM correlates groups of interrelated variables into a single factor or latent construct involving path analysis, including the direct effects of factors and correlations among them.28 ,41 ,42 SEMs are often best understood using a graphic where direct effects are depicted as vectors stemming from an independent variable (exposure) and pointing towards a dependent variable (outcome). A confounder, according to the use of these directed acyclic graphs, is depicted as a variable with direct effects on both the exposure and the dependent variable.28 Correlations between the measurement errors of two variables are represented by two-headed curving arrows, in which case only the measurement error terms were defined as correlated.41 ,42
Analyses proceeded in two stages. First, congruent with our hypotheses, we created and confirmed the a priori factor structure. We confirmed these latent behavioral constructs for physical activity, diet and sociodemographic variables. An assumption of this analysis is that an underlying unmeasured variable is identified by the shared variance of the observed variables.28 ,41 ,42 The constellations of factors that comprise self-reported physical activity, diet and sociodemographic patterns may best be modeled in terms of their shared variance rather than to the individual account of the underlying immeasurable source.28 ,41 ,42 Second, we proceeded to test the hypothesized model with special emphasis on observing the linkage between latent behavioral, sociodemographic, anthropometric and biological variables, as well as the direct effects and correlations that define them.
The aim of this hypothesized model was to assess modifiable behavioral and metabolic factors such as physical activity, diet, lipids, obesity and high blood pressure together with sociodemographic variables that influence normoglycemia, pre-diabetes and type 2 diabetes in Qatar. Since age, sex and consanguinity are strong confounders that are linked to other factors in the model, their effects, while included in our model, are not shown in the final graphic.
Our hypothesized model is depicted in figure 1. We hypothesized 77 paths that directly and/or indirectly affect diabetes status. These 77 paths emanate from the 21 observed variables, three latent variables and two covariates. It is important to note the data's inherent temporality resultant from the STEPS survey's design which is of cross-sectional nature. In this case, sex and family history of diabetes are determined at birth, while other variables such as age are a function of birth date. Moreover, physical activity and dietary intake were reported for the 7-day period prior to the survey and it is assumed that these behavioral reports were routine patterns.18 A detailed description of our model can be found in the online supplementary material.
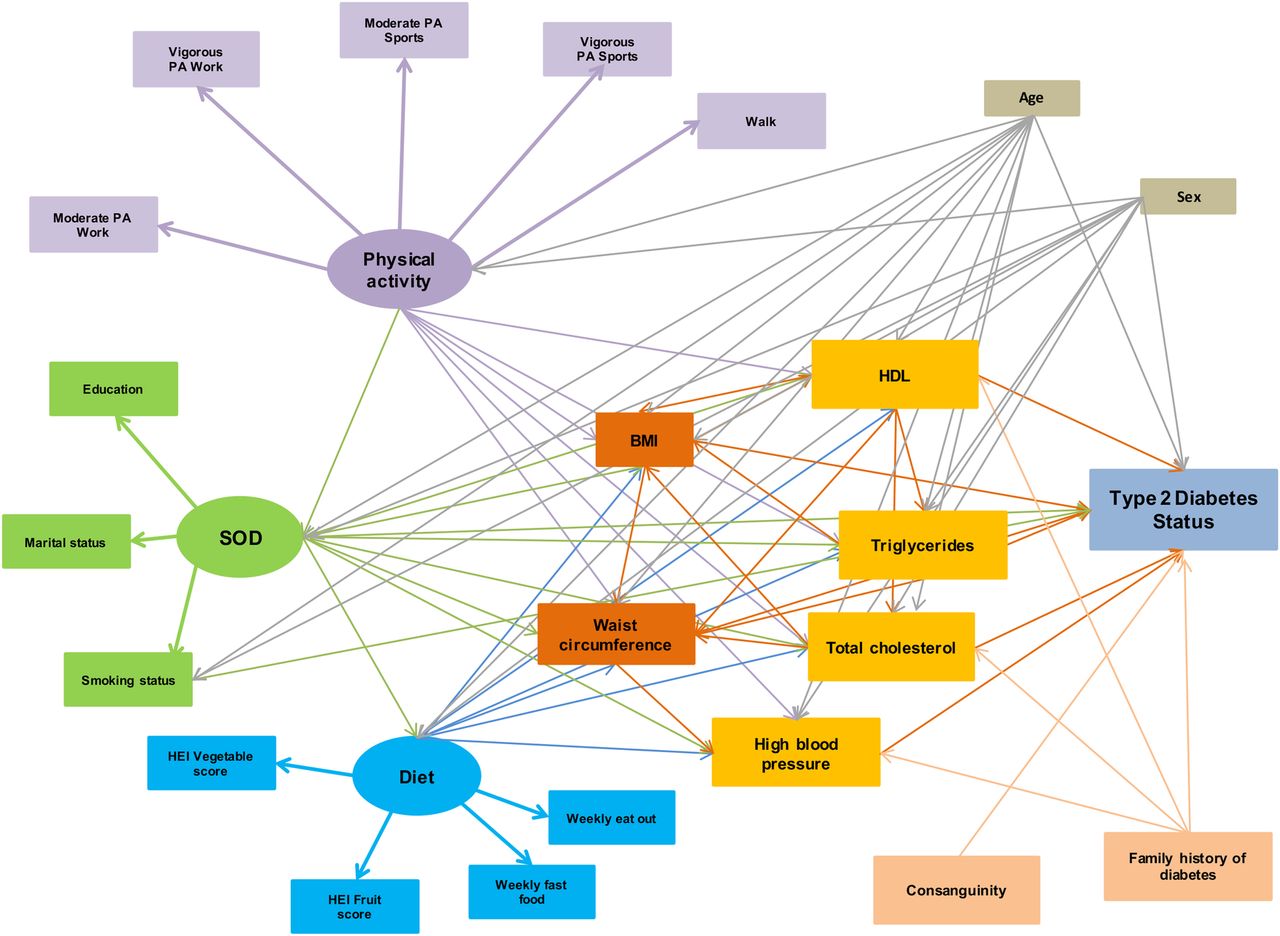
Hypothesized factors for diabetes in the STEPwise approach to surveillance 2012 survey—Qatar among adults aged 18–64 years. Ellipse indicates latent, unobservable constructs (to be identified using factor analysis); box indicates observed variable; straight line with one arrowhead denotes direct effect.
Supplemental material
We used STATA V.13.1 for data management and descriptive statistics. In addition, we employed Mplus V.7.31 software for confirmatory factor analysis and testing the structural model. We accounted for the complex cross-sectional survey design of STEPS by including the sample weights in our analyses. We applied a weighted least squares means and variance adjusted (WLSMV) model fit, designed for categorical data analysis in Mplus.43 In the WLSMV analysis, SEs for the standardized path coefficients are not computed. Consequently, we only report the standardized estimates and the fit statistics of the models. The indices of the statistical model used to fit the data were the standard criteria for evaluating SEM models and were reported throughout. For the purpose of this study they include the Comparative Fit Index (CFI) >0.90, root mean square error of approximation (RMSEA) <0.08 and weighted root mean square (WRMR) ≈1. Modification indices were used to evaluate and select specific paths for the best-fitting model. p <0.05 were considered statistically significant.
Results
Descriptive statistics
Among the 1133 participants, 960 (84.7%) were considered normoglycemic, 136 (12%) were prediabetic and 37 (3.3%) had FBG values in the diabetes range (p=0.536). Compared with those with normal glucose, at the p<0.05 level, individuals with type 2 diabetes or pre-diabetes were more likely to be between 45 and 55 years of age (24.32% and 30.37% vs 14.93%, p=0.000), be obese (37.83% and 47.05% vs 32.6%, p=0.000) or morbidly obese (21.62% and 13.23% vs 8.35%, p=0.000), have no formal schooling (13.51% and 8.82% vs 3.96%, p=0.007), with a considerably greater proportion of individuals with type 2 diabetes with less than a primary school education in comparison to those people with pre-diabetes or normoglycemia (10.81% vs 2.94% and 3.64%, p=0.007). They were also less likely to never have been married (10.81% and 18.38% vs 25.2%, p=0.025) and more likely to be divorced (10.81% and 4.41% vs 4.79%, p=0.025). At this same significance level, it was also found that a greater proportion of women with type 2 diabetes and pre-diabetes had a large waist circumference in comparison to women with normoglycemia (78.94% and 64% vs 51.76%, p=0.036). This was also the case for men (76.47% and 57.14% vs 43.98%, p=0.03). All the descriptive statistics are reported in table 1.
Characteristics of the STEPS participants according to normal glucose status, pre-diabetes and diabetes
Diet and physical activity
When dietary patterns were analyzed we found that people with type 2 diabetes had lower mean vegetable HEI scores (6.53) than individuals with pre-diabetes (8.02) or normoglycemia (7.94) (p=0.032). In contrast, individuals with type 2 diabetes showed no difference in mean fruit HEI scores (4.63) compared to individuals with pre-diabetes (5.23) or normoglycemia (4.88) (p=0.51). We found that subjects with normoglycemia on average ate out (2.08) the same amount of times per week as subjects with pre-diabetes (1.89) or type 2 diabetes (1.62) (p=0.37). Average weekly fast food consumption was similarly not significantly different between subjects, with normoglycemic individuals eating fast food 1.62 times per week, patients who are prediabetic subjects eating 1.55 times and patients who are diabetic subjects eating 1.61 times (p=0.88).
For the physical activity measures, we found that there was no statistically significant difference between subjects with type 2 diabetes, pre-diabetes and normoglycemia regarding their weekly time spent performing vigorous physical activity at work (4.01, 1.46 and 1.49 hours/week, respectively; p=0.059), moderate physical activity at work (3.42, 3.94 and 3.97 hours/week; p=0.95), vigorous physical activity through sports (0.12, 0.48 and 1.07 hours/week; p=0.19) or moderate physical activity through sports (0.59 vs 0.99 and 1.27 hours/week; p=0.25). In addition, subjects with type 2 diabetes walk the same amount compared to subjects with pre-diabetes or normoglycemia (6.53, 4.33 and 4.05 hours/week; p=0.2). All diet and physical activity data are reported in table 2.
Health Eating Index for fruit and vegetables, food frequency and weekly hours of physical activity according to normal glucose status, pre-diabetes and diabetes
SEM and path analysis
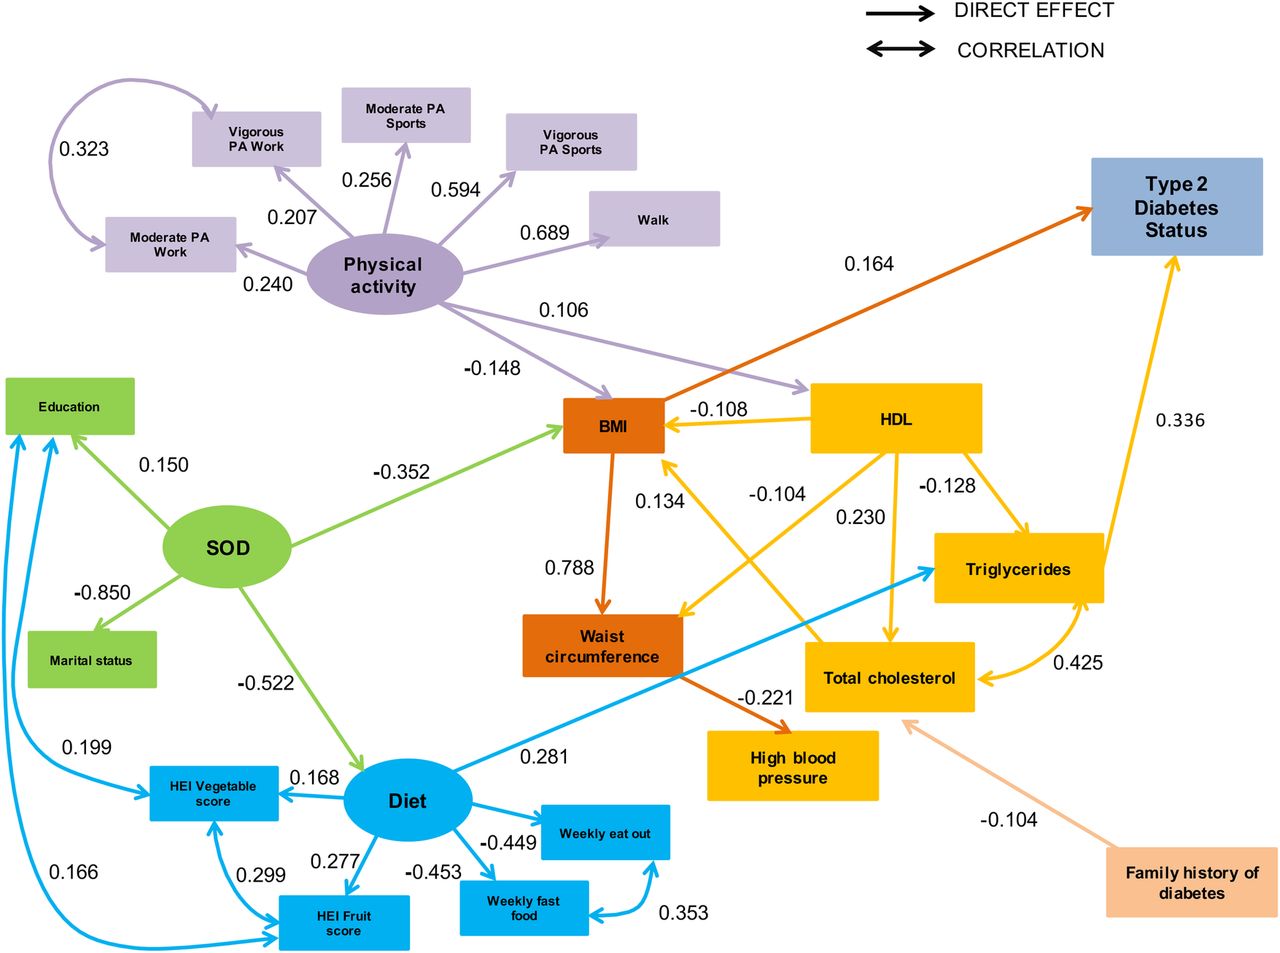
The hypothesized model fitted the data well (CFI 0.920; RMSEA 0.052; WRMR 1.654). Non-significant paths were then removed to increase parsimony and a few additional paths were added to improve model fit. Specifically, we dropped consanguinity and smoking status as variables and added the following correlations: HEI fruit score and educational status; HEI fruit score and vegetable score; prevalence of eating out versus eating fast food per week; HEI vegetable score and educational status; and total cholesterol and triglycerides. We also added correlations between weekly hours of moderate and vigorous physical activity at work. All items depicting the latent variables of physical activity, diet and sociodemographic characteristics had significant factor loadings, except for smoking status. The final model had excellent fit (CFI 0.971; RMSEA 0.032; WRMR 1.253) and the fully standardized path coefficients are presented in figure 2. We report pathways only for statistically significant standardized path coefficients at the p<0.05 level (figure 3).

Final model of factors for diabetes in the STEPwise approach to surveillance 2012 survey—Qatar among adults aged 18–64 years. Ellipse indicates latent, unobservable constructs; box indicates observed variable; straight line with one arrowhead denotes direct effect; curved line denotes correlation. Adjusted for sex and age.

Indirect effects of factors for diabetes in the STEPwise approach to surveillance 2012 survey—Qatar among adults aged 18–64 years. Ellipse indicates latent, unobservable constructs; box indicates observed variable; curved line with one arrowhead denotes indirect effect. Adjusted for sex and age. BMI, body mass index; HDL, high-density lipoprotein; HEI, Healthy Eating Index; PA, physical activity.
The two risk factors deemed to have a direct statistically significant effect on type 2 diabetes and pre-diabetes statuses were triglycerides (0.336) and BMI (0.164). Sociodemographic background had a strong negative effect both on diet (−0.522) and BMI (−0.352). Total cholesterol had a positive effect on BMI (0.134). Diet had in turn an important positive effect on triglycerides (0.281). Physical activity had a negative effect on BMI (−0.148) and a positive effect on HDL (0.106). HDL had a strong positive effect on total cholesterol (0.230) and a negative effect on triglycerides (−0.128), BMI (−0.108) and waist circumference (−0.104). Family history of diabetes was found to have a negative effect on total cholesterol (−0.104). In addition, waist circumference had a negative effect on hypertensive status (−0.221); in contrast, BMI had a very strong positive effect (0.788) on waist circumference.
There are specific indirect effects between sociodemographic background and diabetes status, which are mediated by diet and tryglyceride levels (−0.049; p=0.007) and BMI (−0.058; p=0.001). Triglycerides also mediated the indirect effects between diet and diabetes status (0.095; p<0.000). We also found an indirect effect between physical activity and diabetes status that was mediated by BMI (−0.024; p=0.009), HDL and BMI (−0.002; p=0.049) and HDL and tryglycerides (−0.005; p=0.043). Important correlations found and added post hoc to the final model were weekly prevalence of eating out and weekly fast food consumption (0.353), as well as educational status and HEI vegetable score (0.166) and HEI fruit score (0.199). In addition, we found correlations between HEI vegetable score and HEI fruit score (0.299), moderate and vigorous physical activity at work (0.323) and total cholesterol and triglycerides (0.417). All results from our SEM analysis are reported in table 3.
Statistically significant latent variable factor structure, direct effects and correlations of the final SEM model
Conclusions
To the best of our knowledge, this is the first study to use SEM to analyze modifiable behavioral and metabolic determinants for diabetes status in a Middle Eastern country. The primary finding of the study is that triglycerides and BMI have a critical effect on diabetes status as independent risk factors for type 2 diabetes. Tryglycerides were also found to mediate the effects that diet, physical activity and sociodemographic background have on diabetes status. These results reinforce the findings from studies44 ,45 showing that triglycerides and BMI are not only the common characteristics of the dyslipidemia associated with insulin resistance and type 2 diabetes, but are also the link between the central pathophysiological feature of a diabetic's abnormal lipid profile and modifiable behavioral variables such as diet and physical activity.46 ,47 Some evidence also suggests that fasting triglyceride levels can aid in predicting transition to type 2 diabetes.48 For this reason, adequate control of triglycerides has been proposed as a therapeutic goal in the metabolic control of subjects with pre-diabetes and type 2 diabetes. Our study findings that triglycerides are strongly linked to dietary quality support this proposal in an Arabic context.18
The second crucial finding of this study is that BMI has a direct positive effect on diabetes status. The most influential factor affecting BMI is the negative association with sociodemographic background, which links social determinants of health such as education and marital status to abnormal metabolic control leading to obesity. This result matches findings from previous research, which showed that sociodemographic factors are linked to dietary intake, metabolic risk and high BMI.49 Our model also identified a negative effect between physical activity and BMI that is consistent with studies of specific type 2 diabetes risk factors.32 Higher levels of physical activity are associated with lower BMI. Furthermore, total cholesterol was directly affected by a family history of diabetes. Family history of diabetes can be genetic and/or environmental and has been linked to obesity, hyperlipidemia, abnormal metabolic control and risk for type 2 diabetes.9 Consistent with our findings, a review of genomic studies reiterated that significant gene–diet and gene–environment interactions result in altered lipid metabolism, inflammation and other metabolic imbalances that lead to cardiovascular disease and obesity.50 We found that the genetic and behavioral effects of sociodemographic factors, diet and physical activity levels on BMI and lipid profile (expressed in low HDL and high triglyceride values) tend to mediate the metabolic effects of obesity on diabetes status.
One shortcoming of the Qatar STEPS survey is that it did not collect income data or alcohol consumption data from its respondents and we were unable to explore the links between diabetes and income status and diabetes and alcohol consumption. Further research into the links between socioeconomic status and type 2 diabetes in Qatar would be beneficial. In addition, the STEPS dietary intake data are limited to fruits and vegetables, which may bias dietary inputs that might influence metabolic risk and obesity. This might be one of the reasons why diet did not have a statistically significant effect on BMI or diabetes status. Inclusion of comprehensive dietary intake variables in future Qatari health surveys might be helpful in determining the links between dietary inputs, metabolism and obesity. Another concern is that the link between triglyceridemia and diabetes status is influenced by the fed–fasted state, insulin sensitivity and lifestyle factors. Triglyceride levels are a sensitive lifestyle biomarker and determination at a single time point may inaccurately reflect long-term triglyceridemia. This is also the case for other biomarkers used to populate our hypothesized model such as HDL. Our main outcome measure (FBG), also defined diabetes status according to only a single point in time when in reality FBG can naturally fluctuate. As a result, we acknowledge that the lack of a second confirmatory FBG measure may bias our estimates. A final limitation of this study is the cross-sectional nature of the STEPS survey, which prevents us from making causal inferences about diabetes status. Ideally our model would include longitudinal outcomes because they would be able to show how risk factors affecting type 2 diabetes transition evolve in time. Nonetheless, our study is a valuable initial step in furthering diabetes research in a highly affected region that has limited access to relevant data. Future research could build on our work by disentangling what affects different risk factors in time and their individual contribution to type 2 diabetes transition.
Our model of risk for type 2 diabetes in Qatar confirms previously established associations of modifiable factors such as physical activity and BMI with type 2 diabetes status. Our results also provide evidence that type 2 diabetes mellitus can be prevented with behavioral changes in the lifestyles of those at high risk for developing the disease. As part of Qatar's National Health Insurance Scheme a diabetes disease management program was launched last year with the aim of improving outcomes, controlling diabetes and offering prevention education. In line with this initiative, further research on diabetes in Qatar and the Middle East region should focus on the preventive roles that patients, families and physicians have within the healthcare system. Preventive roles need to be incorporated into a primary healthcare model grounded on an integrated system of diabetes prevention that is based on patient welfare and personalized care. As more Qataris develop type 2 diabetes, the population will spend increasing periods of time living with the debilitating complications of the disease. This adds considerable urgency to public policy deliberations on the matter. Effective implementation of primary prevention of type 2 diabetes mellitus represents a unique opportunity to reduce the burden of diabetes and its complications.
Acknowledgments
This work was supported by The Supreme Council of Health Qatar and the Public Health Department who organized the STEPS survey's data collection and processing according to WHO guidelines. The STEPS survey was conducted in collaboration with the WHO which provided guidance and technical support during all phases of the survey. We must thank Leanne Riley of WHO for her collaboration and help during the early stages of this paper.
References
Footnotes
Contributors AR-U created the statistic model, performed the main analyses and drafted the document, tables and figures. FMHA edited the draft document, provided comments on the model and statistical model and liaised with local authorities over issues of data collection and dissemination. HR edited the draft document, provided comments on the model and statistical model and liaised with local authorities over issues of data collection and dissemination. MJR edited the draft document, statistical model, figures and tables and helped with the submission of the document. GDR helped with the statistical model design, evaluated model fit and provided methodological assesment of the paper in its different stages. EM liaised with local authorities, helped editing the draft document, provided comments over the statistical model, scope of the research and guidance as to the methods and drafts at all stages of the process.
Funding This work received no specific grant from any funding agency in the public, commercial or not-for-profit sectors.
Competing interests None declared.
Patient consent Obtained.
Ethics approval Supreme Council of Health, Qatar; WHO.
Provenance and peer review Not commissioned; externally peer reviewed.
Data sharing statement All data from the 2012 STEPS Qatar is held by the Supreme Council of Health who together with LSE Health analysed the data. The authors will provide a covariance matrix on request that will enable total replication of the SEM model and results on request by email to a.e.roman-urrestarazu@lse.ac.uk.