Article Text

Abstract
Background The dynamics of physiological and behavioral risk factors of diabetes in rural India is poorly understood. Using data from a health and demographic surveillance site of Birbhum district in West Bengal, India, this study aims to assess the risk factors associated with type 2 diabetes mellitus.
Research design and methods A total of 7674 individuals aged ≥18 years participated in a cross-sectional study. Venous plasma glucose method was used for measuring and reporting glucose concentrations in blood, categorized as individuals with diabetes, pre-diabetes or impaired, and normoglycemic. Aside from a set of physiological and behavioral risk factors, a range of socioeconomic confounders of diabetes was computed. Bivariate analysis with χ2 test, and multivariate ordered logit regression methods were deployed to attain the study's objective.
Results Overall 2.95% and 3.34% of study participants were diagnosed as individuals with diabetes and pre-diabetes or impaired, respectively. Compared to the poorest, the richest have higher probability (β: 0.730; 95% CI 0.378 to 1.083) of being diagnosed with diabetes. As compared to people with normal body mass index, overweight/obese people are more prone to being diagnosed with diabetes (β: 0.388; 95% CI 0.147 to 0.628). With a decreasing level of physical activity, people are more likely to be diagnosed with diabetes.
Conclusions To curb the level of diabetes, this study recommends a culturally sensitive, focused intervention for the adoption of physical activity with more traditional dietary practices, to control the level of overweight/obesity. Attention should be paid to relatively older patients with diabetes or adults with pre-diabetes.
- Type 2 Diabetes
- Physical Activity
- Body Mass Index
- Diet
This is an Open Access article distributed in accordance with the Creative Commons Attribution Non Commercial (CC BY-NC 4.0) license, which permits others to distribute, remix, adapt, build upon this work non-commercially, and license their derivative works on different terms, provided the original work is properly cited and the use is non-commercial. See: http://creativecommons.org/licenses/by-nc/4.0/
Statistics from Altmetric.com
Key messages
Being overweight or obese and low physical activity are the significant physiological and behavioral risk factors for diabetes in rural India.
A focused lifestyle modification intervention to encourage physical activity and traditional dietary intake should be encouraged in rural India where the effect of tobacco and alcohol use did not appear to have any significant effect on diabetes.
In future, study sites such as health and demographic surveillance system-Birbhum Population Project should aim to collect more information on diabetes, and its related comorbidity and mortality patterns among the sampled cohort population.
Introduction
As a signatory to the sustainable development goals (SDGs), India has committed to extend every possible effort to reduce one-third of premature mortality from non-communicable diseases (SDG: 3.4) by 2030.1 In 2012, non-communicable diseases (NCDs), also known as chronic diseases, killed over 38 million people in the world, and 1.5 million of all deaths were attributed to diabetes.2 In 2011, under the leadership of the WHO, over 190 countries endorsed a global mechanism to reduce the burden of diabetes called a ‘Global Action Plan for the Prevention and Control of NCDs 2013–2020’.3 Globally, an estimated 422 million adults were living with diabetes in 2014, compared to 108 million in 1980.2 Diabetes accounted for 12% of health expenditures in 2010, or at least $376 billion—a figure expected to hit $490 billion by 2030.4 With over 1.25 billion people, India has a little lower prevalence of diabetes (among adult population) than the global level (India: 7.8% vs worldwide: 8.5%).2 Diabetes is growing alarmingly in India, with more than 65 million people having the disease, compared to 51 million in 2010.5
Type 2 diabetes mellitus (formerly called non-insulin-dependent or adult-onset) which results from the body's ineffective use of insulin comprises 90% of diabetes cases.2 Risk factors of diabetes can be categorized as ‘metabolic or physiological risk factors'—overweight or obesity, and hyperlipidemia (high levels of fat in the blood); and ‘modifiable behavioral risk factors' –unhealthy diet, physical inactivity and the harmful use of tobacco and alcohol.2 ,6–10 In addition, socioeconomic factors act as potential confounders of diabetes, driven by forces that include ageing, rapid unplanned urbanization and the globalization of unhealthy lifestyles.2 ,6 ,7
Despite having a lower body mass index (BMI) on average, some Asian countries have similar or even higher prevalence of diabetes than Western countries,11 and the risk of type 2 diabetes starts at a lower BMI for Asians than for Europeans.12 In India, traditional dietary patterns are being lost as the population adapts to more industrialized and urban food environment.6 These changes enhance type 2 diabetes risks by increasing body weight and central adiposity.6 As lower income Asian countries shift away from agricultural labor toward a service sector economy, energy expenditure has declined dramatically, even in rural India. A meta-analysis revealed that current smokers had a 45% increased risk of developing diabetes compared with non-smokers.13 The accumulation of visceral adipose tissue among smokers may be due to increased plasma cortisol levels induced by the stimulation of sympathetic nervous system activity. Smoking decreases testosterone level leading to adiposity. High consumption of alcohol leads to excess caloric intake and obesity, which in turn accelerates propensity for diabetes.14
Although modification of physiological and behavioral risk factors are known to be essential for preventing and managing the type 2 diabetes, there is currently insufficient information available on type 2 diabetes and associated factors in Asian countries, especially for rural India. Using a cross-sectional data of 7674 individuals drawn from a health and demographic surveillance system (HDSS) site in rural India, this study assesses the physiological and behavioral risk factors associated with type 2 diabetes mellitus. It is hoped that this study will help understand strategies to halt the level of diabetes in a rural Indian context.
Methods
Data set
Data for the present study were drawn from the Birbhum Population Project (BIRPOP), a Health and Demographic Surveillance System (HDSS) site located in Birbhum district of West Bengal, a state located along the eastern boundary of India.15 The HDSS-BIRPOP site covers 4 of 19 blocks of Birbhum, namely Mohammad Bazar, Rajnagar, Sainthia, and Suri I. At its inception in 2008, the 2001 National Census was used as the sampling frame to select the study population. By adopting a multistage sampling design, 12 300 self-weighted households were sampled taking into account a 10% dropout and non-participation rate. The HDSS-BIRPOP collects extensive data on demographic processes, population health and epidemiology, and healthcare utilization, with a focus on anthropometric indices of cardiometabolic health, and cardiometabolic imaging data in a subgroup of individuals. More about the sampling procedure and the profile of HDSS-BIRPOP is available elsewhere.15
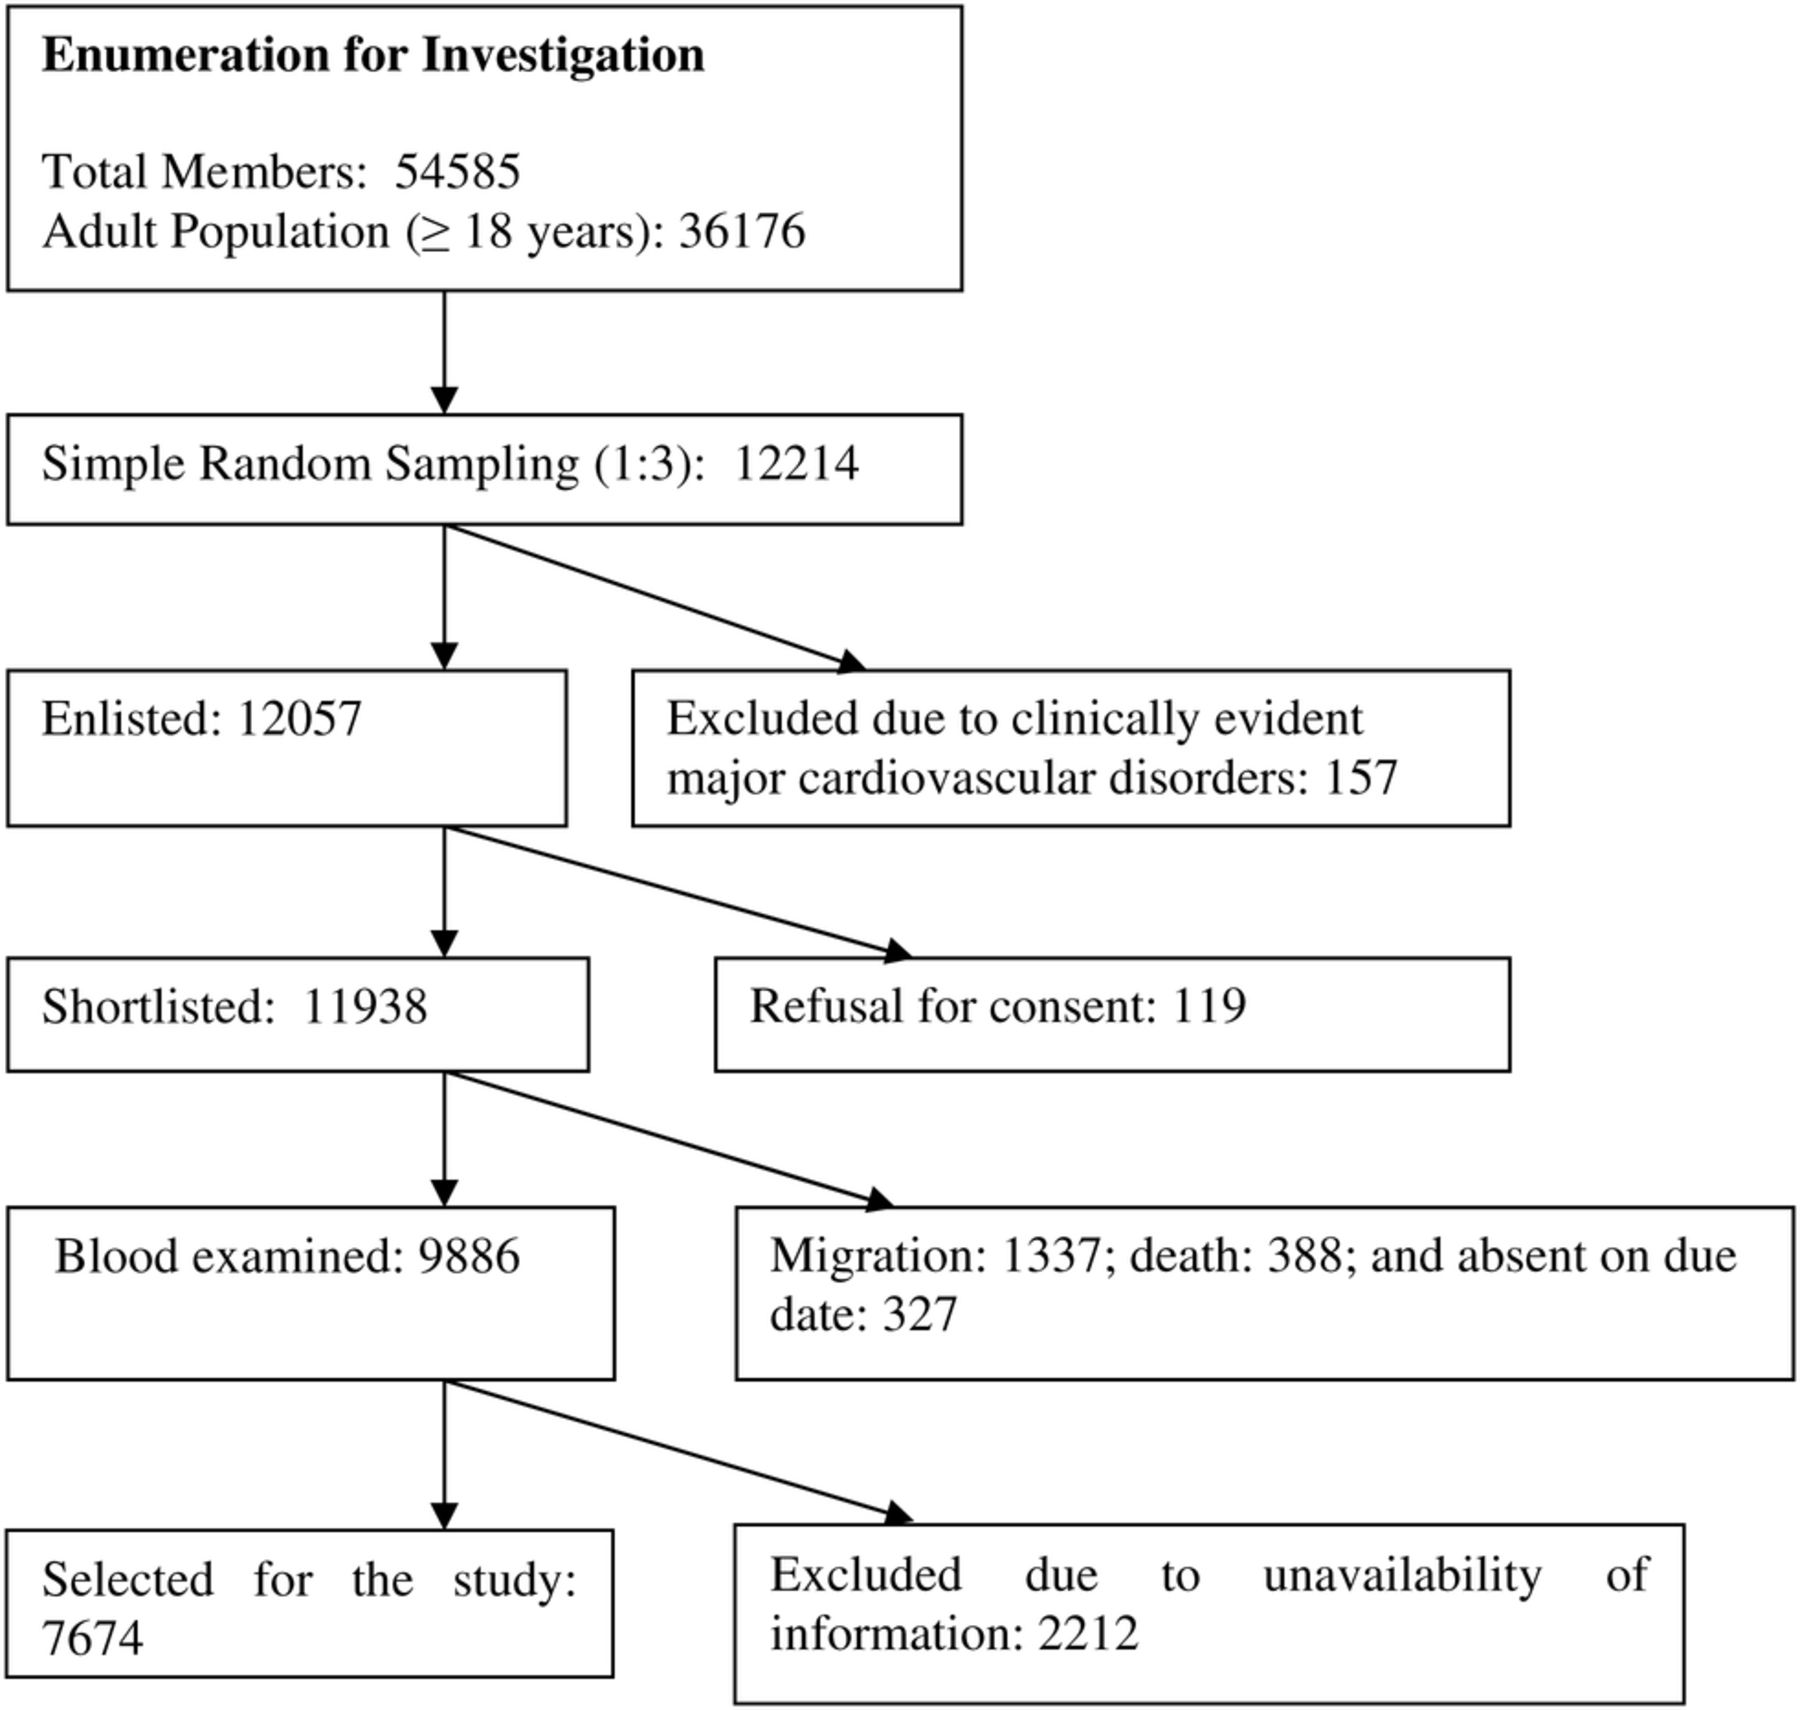
The data used in the study were collected between July 2012 and March 2013. It covered 12 557 households comprising a total of 54 585 rural Indians. Blood samples were collected from a subsample of 9886 individuals drawn from 36 176 adults (over ≥18 years). At completion, 7674 individuals with blood tests were found eligible to be included in this study. The study flow chart is shown in figure 1. The participants have no clinical evidence of major cardiovascular disorders, which was defined as having a history of myocardial infarction, angina pectoris, prior revascularization, heart failure, atrial fibrillation, stroke, or peripheral arterial disease and end organ damage at enrolment. In addition, none of the participants were found to be suffering from type 1 diabetes mellitus.
Selection of participants included in this study.
The survey was conducted by 44 trained interviewers who had at least an undergraduate degree and some exposure to large scale sample surveys. All the interviewers (designated as the surveyors in HDSS-BIRPOP) were native speakers of at least one of the local languages—Bengali and Santhali (a tribal language). The follow-up protocols include study visits to each household every 3 weeks for assessment of follow-up for clinical events. Despite (small) effects of migration, there was very little loss in the follow-up within this cohort (1% per year maximally). Ethical clearance for collection and analysis of the blood samples was obtained through a formal review by the HDSS' institutional review board and signed informed consent from the participating individuals.15
Defining type 2 diabetes mellitus
To define type 2 diabetes mellitus, this study has adopted the guideline developed by the WHO and the definition of the International Diabetes Federation.16 People were diagnosed with diabetes if they recorded fasting plasma glucose (FPG) ≥126 mg/dL or if they were taking antidiabetic drugs (oral hypoglycemic or insulin). The FPG cut-point for impaired fasting glucose ranged from 110 to 125 mg/dL; and individuals were categorized as normoglycemic (defined if individual has normal glucose level with low risk of developing diabetes or cardiovascular disease) if FPG was <110 mg/dL.16
Venous plasma glucose is the standard method for measuring and reporting glucose concentrations in blood. The study participants were instructed to fast for at least 12 hours prior to blood collection. Fasting blood samples were obtained by a trained phlebotomist in K2-EDTA tubes (3.0 mL); fluoride tubes (2.0 mL) and serum tubes (7.0 mL). Serum was prepared within 2 hours of blood collection. Plasma glucose was estimated by using the hexokinase/glucose-6-phosphate dehydrogenase method within 2 hours of blood collection.
Covariates
Guided by the existing literature, this study uses a set of potential physiological and behavioral risk factors of diabetes. The variables representing physiological characteristics are BMI categorized as normal, underweight and overweight/obese; and physical activity level, categorized as high, medium, and low. BMI is defined as the ratio of the weight in kilograms to the square of the height in meters (kg/m2). A BMI of <18.5 kg/m2 is widely used as a practical measure of being underweight, indicating chronic energy deficiency, whereas BMI ranges of 18.6–22.9 kg/m2 and ≥23 kg/m2 are considered indicative of normal, and overweight/obesity, respectively.17 The level of physical activity was measured by asking how often (never, irregular/once or twice a day, or daily) an individual undertook certain types of physical activity on a typical day. The details of computing physical activity levels are discussed in appendix 1. Information obtained on tobacco use (both smoking and chewing), and alcohol consumption was used as the behavioral risk factors of diabetes. Respondents were investigated if they were currently (preceding 30 days of survey date) using tobacco or consuming alcohol, or if they have any history of tobacco use or alcohol consumption.
In addition, a list of potential confounders of diabetes was adapted to measure the risk factors of diabetes. The variables include completed age (categorized as 18 to 24, 25 to 34, 35 to 44, and ≥45 years), sex (categorized as male or female), level of education (categorized as illiterate, grades 1 to 5, 6 to 10, and ≥11), religion (Hindu, Islam or Others), social group (categorized as scheduled caste, scheduled tribe, other backward class, and others), occupation (categorized as unemployed, non-earning household chore, labor, and service/ pensioner/ retired), and wealth quintile (categorized as poorest, poorer, middle, richer, and richest). Scheduled Castes and Scheduled Tribes are identified by the government of India as socially and economically backward social groups and considered to be in need of protection from social injustice and exploitation, whereas other backward classes are a diverse collection of intermediate castes; others, or the so-called ‘general’ castes, are a residual group that enjoys higher status in the social group hierarchy. To compute a composite proxy indicator of income, a relative index of household wealth quintile was calculated using principal component analysis of the standard set of assets owned by the household, including ownership of consumer items and dwelling characteristics. Individuals were ranked on the basis of their household scores and divided into different quintiles, each representing 20% of the score, ranked between 1 (poorest) and 5 (richest).18
Statistical analysis
To attain the study's objectives, descriptive as well as multivariate analyses were deployed. χ2 Test was used to understand the proportional difference in diabetes prevalence. Ordered logit regression model was applied to understand the net effects of the correlates of diabetes. The ordered logit model is used when the outcome variable is categorized on an ordinal scale, ordered by some conceptual or subjective criteria.19 It is the probability model used here for the diabetes score, which is ordered from 0 (categorized as normoglycemic) to 1 (impaired or pre-diabetes), to 2 (individuals with diabetes). The ordered logit model can be expressed as for
for  categories of the response variable, where
  is the cumulative probability up to and including j, for a covariate vector
  ; and
; and  is the cut-point for the
  th category. Exponentiating both sides of the equation gives the odds of falling into category
  or lower versus falling into a category higher than
  with a given set of covariates. The OR for a unit change in a particular covariate, say from
  to
to  , is given by
 where
where  is the coefficient of interest. A negative coefficient indicates that a higher value of the independent variable increases the odds of a lower value of the outcome. Since some of the selected predictor variables appear to have multicollinearity issues, a variance inflation factor (VIF) was estimated. All VIF values were much smaller than 5.0, suggesting that the possibility of high multicollinearity was low. The analyses were conducted using statistical software, Stata V.12. The variables found significant at p<0.05 level in the ordered logit regression model were brought to attention.
Results
Table 1 represents the percentage distribution of diabetes status by selected background characteristics. The χ2 test reveals that age group, education, social group, wealth quintile, body mass index, and physical activity level were measured to have a significant (p<0.05) difference in proportion within each group. Overall 2.9% and 3.3% of study participants were diagnosed with diabetes and pre-diabetes or impaired, respectively. The proportion of people diagnosed with diabetes was estimated high with increasing age, and almost 6% of those surveyed with education of 11th grade or above were diagnosed with diabetes. Almost 4% of people belonged to the ‘others’ social group, and nearly 7% of the richest respondents were diagnosed with diabetes. Nearly 7% of overweight/obese people were with diabetes, whereas close to 5% of people who had recorded low physical activity were with diabetes.
Percentage distribution of diabetes status by select background characteristics
Table 2 shows the coefficient (β) with 95% CI estimated from ordered logit regression predicating the factors associated with diabetes. People who belonged to age group 15–44 years (β: 1.352; CI 0.802 to 1.902), and age group ≥45 years (β: 1.747; CI 1.203 to 2.291) have increasing risk of diabetes, as compared to people in the 18–24 years age group. Compared to the poorest, the richest have a higher probability (β: 0.730; CI 0.378 to 1.083) of being diagnosed with diabetes. As compared to people with normal BMI, people who are underweight tend to have low rate of diabetes (β: −0.419; CI −0.650 to 0.188); whereas overweight/obese people are more prone to being diagnosed with diabetes (β: 0.388; CI 0.147 to 0.628). With decreasing level of physical activity, people are more likely to be diagnosed with diabetes.
Coefficient (β) with 95% CI estimated from ordered logit regression predicting the factors associated with diabetes
Discussion
Using data of 7674 individuals from HDSS-BIRPOP, this study demonstrates the physiological and behavioral risk factors associated with the type 2 diabetes mellitus. While performing the analysis, the potential socioeconomic confounders were taken into consideration. Results indicate that age group, economic status, being overweight/obese, and low level of physical activity are the potential risk factors of diabetes. Although these risk factors appear as independent characteristics associated with diabetes, they are also interrelated.
Studies have demonstrated that the risk of type 2 diabetes tend to develop early in the life cycle among Indians, as compared to non-Indians. This study explains the higher probability of diabetes among people in their advanced age. This finding is consistent with the claim that the countries with the largest number of patients with diabetes are, and will be, India, China and the USA; in the first two countries diabetes occurs mostly in the age range of 45–64 years, in contrast with age >65 years in developed countries.9 A younger age at onset of diabetes has been noticed in Asian Indians in several studies, but this study focuses on an adult group aged ≥18 years only.
The high BMI for overweight/ obesity increases the probability of diabetes. Indians have, on average, a lower BMI than those of European descent, and risk of diabetes starts to increase at very low levels of BMI for Indians.9 Higher percentage of body fat that is concentrated in the abdominal area is a key risk factor for developing diabetes. Also, irrespective of economic status, people living in rural India, increasingly refrain from labor-intensive activities leading to low physical activity.7 ,9 ,20 Efforts that focus on diet and physical activity have the potential to reduce the risk of obesity, the single most important risk factor for type 2 diabetes. Nutrition transition refers to a shift from consumption of simple, traditional foods to foods high in calories, sugar, and animal fat but low in vitamins and minerals derived from fruits and vegetables. Interactions between Westernized diets and lifestyle and genetic background may accelerate the growth of diabetes in the context of rapid nutrition transition. This food intake behavior is increasingly becoming common in rural India, which could lead to overweight/obesity, a prelude to diabetes.21 In earlier years there was a very low prevalence of diabetes among rural population. However, studies from Maharashtra22 and Andhra Pradesh23 report very high prevalence of diabetes along with correlation with BMI. More commonly, rich and privileged groups have abandoned the traditional diet, and as their purchasing power is high, they are inclined to buy high calorie foods.
Early detection of individuals with diabetes or pre-diabetes and treatment in outpatient settings provides cost-saving ways of tackling the disease. Several randomized controlled trials have shown that lifestyle modification can reduce conversion from pre-diabetes to type 2 diabetes by 50%. Now the basic science needs to play the role for prevention and treatment for diabetes in new directions.24 Integrating individual-level factors with environmental and policy factors to produce an interacting network are the need of the hour. An intervention could be designed to encourage physical activity, which in turn will maintain BMI and ultimately reduce the burden of diabetes. While designing the intervention, attention should be paid to aged people. Restoration of traditional diets in rural India should be encouraged, over food with high calorie concentration. Traditional Indian diets are largely based on polished white rice and refined wheat, having high glycemic index (GI) and glycemic load (GL) values.25 Previously the metabolic effects of high GI or GL diets were nullified by high levels of physical activity.
In Brazil, Colombia, and Fiji, contextually relevant environmental interventions that were accompanied by national health education and promotional programs showed tremendous success in increasing physical activity at the population level.26 Despite convincing evidence that type 2 diabetes is largely preventable through diet and lifestyle modifications, most current agricultural, nutrition, and urban planning policies are not conducive to nutritious eating and active living. Efforts to increase active travel in rural areas should be integral to strategies to curb the level of diabetes, thus preventing NCDs in India.
Study limitations and way forward
Limitations of this study include the cross-sectional nature of data, which prevents us from drawing causal inferences. Second, the study uses information on people who consume alcohol and tobacco users based on their recollection, which could generate recall errors. However, this study does provide physiological and behavioral risk factors of diabetes that can be used for future focused interventions. The study tool and the measure of physical activity patterns that we have used here is not a strictly standardized measure similar to Global Physical Activity Questionnaire (GPAQ) or other recent adaptations in India.27 The scale used here is a crude measure based on initial exercises to understand the broad patterns of physical activity in the population, and identify the major activities according to their intensity levels. We are in the process of adapting the scale to the above measures in the ensuing future rounds of data collection. In future, the HDSS-BIRPOP also aims to collect further specific information on diabetes, and its related co-morbidity and mortality patterns among the sampled cohort population. In the present data set, we do not have any detailed information on food consumption or dietary intake, but investigation of dietary practices, an important behavioral factor that influences the risk of glucose intolerance is being included in an upcoming study on the study cohort. Additionally, in future studies every effort will be made to increase the participation rate.
Appendix 1
Our summary measure for individual physical activity is a combination of different types of physical activity and the reported frequency of such activity by individuals in a typical week. Information was collected on seven different types of physical activity: heavy manual work such as lifting loads, pulling carts and heavy agricultural work, was classified as ‘heavy physical activity’ (HPA); ‘moderately high physical activity’ (MHPA) included activities such as carrying water, filling utensils with water, playing active games such as football, volleyball or swimming, and washing clothes; cooking and other normal household chores, washing utensils, dusting/mopping rooms and cleaning household premises were classified as ‘moderate physical activity’ (MPA); activities such as driving vehicles, tractors, light agricultural work (such as watering plants or spraying insecticides) were grouped into ‘light physical activity’ (LPA); finally, activities such as teaching, working in shops/vending wares in a stationary position were considered ‘sedentary activity’ (SA). Each of these component activities were coded on a scale of 0–2, where ‘0’ denoted such activities were never conducted, ‘1’ for occasional reporting of such activities, usually once or twice in a week, and ‘2’ denoting usual or regular activity. Consequently, the scores for each of the five domains mentioned above were computed as a simple additive score of the component activity variables, a higher score denoting higher experience of each activity. Finally, these five physical activity domains were aggregated to derive a composite measure of physical activity as follows:
CPAS=(SA×0)+(LPA×2)+(MPA×4)+(MHPA×6)+(HPA×8); where CPAS denotes the Composite Physical Activity Score.i
The CPAS was then normalized into a scale of 0–100 to smoothen the distribution, and finally three equal-sized tercile classes were computed from the normalized score variable. These three classes were subsequently used as ordered variables in subsequent multivariate analysis.
References
Footnotes
Contributors AB, SM, AC and RKR. provided intellectual input through different stages of preparation of this manuscript equally.
Funding This work was supported by the Department of Health and Family Welfare, Government of West Bengal, India (Memo number: HF/O/MERT/1464/HSL (MISC)—35/2008).
Competing interests None declared.
Ethics approval This study was executed by the Birbhum Population Project (BIRPOP) of the Society for Health and Demographic Surveillance (SHDS), a Health and Demographic Surveillance System (HDSS). Ethical approval was obtained from the ethics review committee appointed by the chairperson of the governing body of HDSS-BIRPOP. This survey was conducted only after obtaining an informed and written consent from the participants. More information on the ethics review can be accessed from the BIRPOP's official website—http://www.shds.in/.
Provenance and peer review Not commissioned; externally peer reviewed.
Data sharing statement No additional data are available.
↵i The listing of specific component physical activities and their grouping into the five physical activity domains were based on an elaborate qualitative community-level ranking exercise, first involving a free-listing of the daily activities by selected groups of adult community members from both sexes, followed by pile-sorting of these activities into similar, hierarchical groups of physical activity in an increasing order of severity or involvement of physical stress or energy. The multipliers used in order to derive the aggregate score are arbitrary constants, but with the property that each higher-ordered domain is twice as stressful as its preceding domain. Using alternative scoring matrices such as equal (unitary) weights yielded results that were not significantly different.