Article Text

Abstract
Objective Remission of pre-diabetes to normal is an important health concern which has had little success in the past. This study objective was to determine the effect on remission of pre-diabetes with a high protein (HP) versus high carbohydrate (HC) diet and effects on metabolic parameters, lean and fat body mass in prediabetic, obese subjects after 6 months of dietary intervention.
Research design and methods We recruited and randomized 24 pre-diabetes women and men to either a HP (30% protein, 30% fat, 40% carbohydrate; n=12) or HC (15% protein, 30% fat, 55% carbohydrate; n=12) diet feeding study for 6 months in this randomized controlled trial. All meals were provided to subjects for 6 months with daily food menus for HP or HC compliance with weekly food pick-up and weight measurements. At baseline and after 6 months on the respective diets oral glucose tolerance and meal tolerance tests were performed with glucose and insulin measurements and dual energy X-ray absorptiometry scans.
Results After 6 months on the HP diet, 100% of the subjects had remission of their pre-diabetes to normal glucose tolerance, whereas only 33.3% of subjects on the HC diet had remission of their pre-diabetes. The HP diet group exhibited significant improvement in (1) insulin sensitivity (p=0.001), (2) cardiovascular risk factors (p=0.04), (3) inflammatory cytokines (p=0.001), (4) oxidative stress (p=0.001), (5) increased percent lean body mass (p=0.001) compared with the HC diet at 6 months.
Conclusions This is the first dietary intervention feeding study, to the best of our knowledge, to report 100% remission of pre-diabetes with a HP diet and significant improvement in metabolic parameters and anti-inflammatory effects compared with a HC diet at 6 months.
Trial registration number NCT0164284.
- Pre-Diabetes
- Insulin Sensitivity
- Cardiovascular Risk Factors
- Dietary Intervention
This is an Open Access article distributed in accordance with the Creative Commons Attribution Non Commercial (CC BY-NC 4.0) license, which permits others to distribute, remix, adapt, build upon this work non-commercially, and license their derivative works on different terms, provided the original work is properly cited and the use is non-commercial. See: http://creativecommons.org/licenses/by-nc/4.0/
Statistics from Altmetric.com
Significance of this study
What is already known about this subject?
Reduction in caloric intake (without controlling micronutrient content) for weight loss has generally not been successful for remission of pre-diabetes (impaired glucose tolerance, IGT) to normal glucose tolerance (NGT).
Diabetic medications used to treat pre-diabetes are not without side effects and require long-term use.
What are the new findings?
One hundred percent remission of pre-diabetes IGT to NGT is obtained in obese adults using a high protein (HP) diet but not a high carbohydrate (HC) diet.
Increase in percent lean body mass and decrease in percent fat body mass with weight loss is obtained on the HP diet, but a decrease in percent lean body mass and percent fat body mass with weight loss on the HC diet in IGT subjects.
How might these results change the focus of research or clinical practice?
This study demonstrates that strict adherence to dietary intervention with the HP diet is possible and results in remission of pre-diabetes to NGT.
The HP diet plans are adjustable with a wide variety of different meal plans and initial instructions could be provided to the subjects along with follow-up consultations by phone and email.
Introduction
The prevalence of type 2 diabetes in the USA has increased dramatically in the last decade. According to the Centers for Disease Control and Prevention (CDC) National Diabetes Statistics Report of 2014 there are currently 29.1 million people with diabetes, 21 million are diagnosed and 8.1 million undiagnosed. The prevalence of subjects with impaired glucose tolerance (IGT) or pre-diabetes is in excess of 86 million.1 The Diabetes Prevention Program (DPP)2 and ACTNOW3 studies showed that the rate of conversion for IGT to type 2 diabetes is 7–10% per year with no significant difference in ethnicity. The primary risk factor for type 2 diabetes is obesity as 90% are either overweight or obese. As body mass index (BMI) increases from 23 to >35 kg/m2, there is a 93-fold increase in type 2 diabetes. Obesity also increases the risk of heart disease, hypertension and other metabolic diseases.4 Lifestyle changes, including weight loss and exercise, reduces the risk of developing diabetes by 58%,2 whereas therapeutic intervention reduces the risk by 32% (metformin)2 and 72% (pioglitazone)3 in pre-diabetes subjects. Few studies have been carried out to show some remission of pre-diabetes (IGT) to normal glucose tolerance with diets and weight loss.5 ,6
Our previous feeding study (all food provided) comparing a high protein (HP) diet in normal glucose tolerant, obese, premenopausal women showed similar weight loss over the 6 months. However, subjects on the HP diet had a significant improvement in insulin sensitivity, and decrease in cardiovascular risk (CVR) factors, inflammatory markers, oxidative stress7 and increase in GLP -1, GIP and gastrin8 at 6 months compared with the HC diet subjects. Other diet studies have recommended various methods for weight loss9–19 some of which suggested advantages of low carbohydrate (CHO),15 ,16 higher fat17 or HP diets.18
Observations substantiate the validity of using a HP diet for weight loss. Suppression of hunger and inducement of satiety have been observed with the HP diet.8 ,13 ,20 The thermic effect of feeding also increases with protein primarily by the increase in protein synthesis.21 The low glycemic index (GI) of foods high in proteins has also been observed to be a factor in maintaining satiety. A high GI meal induces hyperglycemia which is followed a few hours later by the sensation of hypoglycemia and an earlier return of hunger.22 The diet composition can alter a number of other variables even though the weight loss may be the same with an isocaloric HP versus a high carbohydrate (HC) diet. The plasma lipids which are a major CVR factor can be effected by the macronutrient diet composition.23 ,24 For instance, a decrease in triglycerides was observed on a low CHO diet.23 Protein intake by itself induces insulin release; however, it is a much less potent secretagogue for insulin than is glucose in normal individuals.25 This suggests that HP diets may help preserve the β cells by increasing sensitivity and decreasing insulin load per meal.
Higher protein content in the diet may also help maintain lean body mass.20 Studies showed nitrogen balance remained positive after a hypocaloric HP diet but became significantly negative after a hypocaloric HC diet.26
Another important aspect of a HP diet is the anti-inflammatory effect and decreased glucose area under the curve (AUC) compared with a HC diet as was shown in our previous study.7 Other studies have demonstrated that hyperglycemia during glucose challenge or elevation of FFA27 leads to activation of leukocytes and reactive oxygen species (ROS). We have also shown that hyperglycemia in vivo and in vitro activates T cells, increases inflammatory cytokines, lipid peroxidation, and ROS.28 Studies also have shown that hyperglycemia in type 2 diabetes and obesity is associated with increased inflammatory markers.29
In this diet feeding study, we investigated the effects of a HP diet (30% kcals from protein, 40% kcals from CHO and 30% kcals from fat) versus a HC diet (15% kcals from protein, 55% kcals from CHO and 30% kcals from fat) for 6 months on obese women and men with pre-diabetes with restriction of 500 kcal intake/day (based on resting metabolic rate (RMR)) on remission of pre-diabetes to normal glucose tolerance, insulin sensitivity, weight loss, changes in lean and fat body mass, inflammatory markers and CVR factors.
Research design and methods
Patients
We recruited women and men aged 20–50 years with a BMI≥30 to ≤55 kg/m2 with pre-diabetes for a total of 24 participants. Subjects were selected on the basis of inclusion criteria of age, BMI, fasting glucose of <126 mg/dL, 2-hour glucose level of 140–199 mg/dL during a standard oral glucose tolerance test (OGTT), and glycated hemoglobin (HbA1c) of 5.7–6.4%. They were excluded if they had proteinuria or elevated serum creatinine (>1.5 mg/dL), surgical or premature menopause, history of liver disease, abnormal liver function tests, diabetes mellitus, on antidiabetic agents or insulin, thyroid disease with abnormal thyroid-stimulating hormone (TSH), weight >350 lbs, triglycerides >400 mg/dL, low-density lipoprotein (LDL) cholesterol >160 mg/dL, systolic blood pressure >145 or diastolic blood pressure >100 mm, use of medications known to effect lipid or glucose metabolism, pregnancy or the desire to become pregnant in the next 6 months, weight loss of more than 5% of body weight in the past 6 months, smoked, or history of cancer undergoing active treatment. After subjects met the above criteria, they were asked to keep a food diary for a week. Those found to be non-adherent and unable to keep diet diary or deemed unable to adhere to the protocol were excluded from the study.
Of the 233 subjects screened by phone, 178 signed the consent form and were screened. Thirty-eight of these subjects met all the inclusion criteria and were randomized to a HP diet (18 subjects) versus HC diet (20 subjects) for a period of 6 months. Six subjects in the HP group and eight subjects in the HC group dropped out within a few weeks after screening due to their work schedule, driving distance or moved out of area. Since there were no data (OGTT, MTT, dual energy X-ray absorptiometry (DXA), weight, metabolic markers) other than baseline (Bl) on those subjects that dropped out, they were not included in the data analysis of comparison of changes from Bl to 6 months on the diet interventions. Therefore, 12 subjects in each group completed the 6-month study as shown in figure 1 and data analyzed.
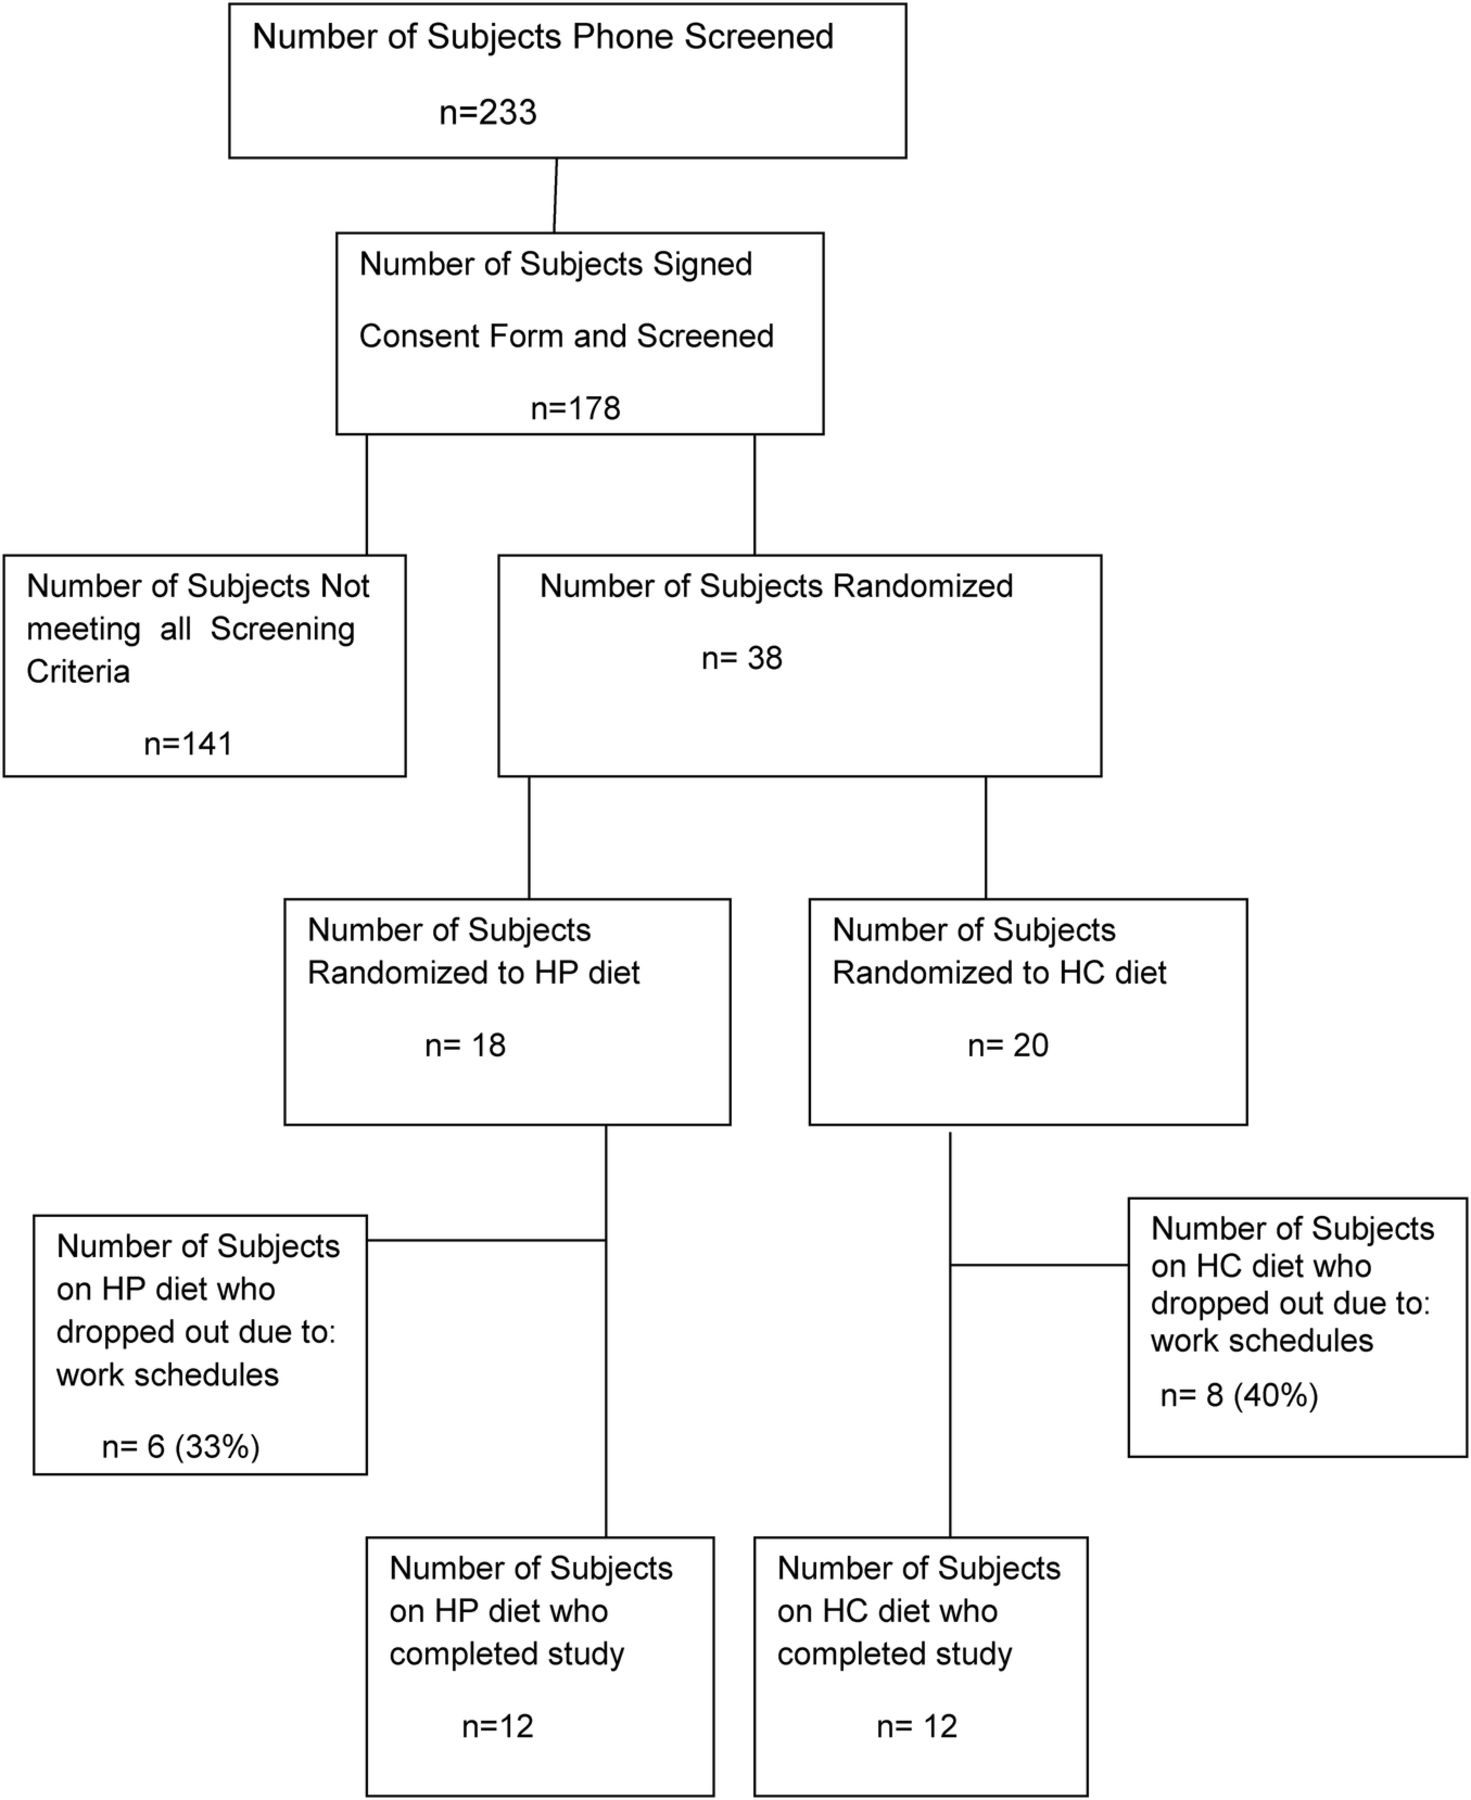
Shows the recruiting and screening of subjects for the participants in the study. HC, high carbohydrate; HP, high protein.
Study design
The study was a prospective randomized trial of a HP diet (30% kcals from protein, 40% kcals from CHO, 30% kcals from fat) versus HC diet (15% kcals from protein, 55% kcals from CHO, 30% kcals from fat) for a period of 6 months. The study was approved by the Institutional Review Board of the University of Tennessee Health Science Center (UTHSC).
All participants were seen in the General Clinical Research Center (GCRC) at UTHSC for all their visits. After signing the consent form, a history and physical examination, height and weight, blood pressure (BP) and waist measurements were done. At the Bl and at 6 months of the study participants underwent a standard OGTT and mixed meal tolerance test. The meal for the MTT for the HP group was a HP meal and the meal for the MTT for the HC group was a HC meal. Both HP and HC meals were 300 calories (the same as the 75 g OGTT). Glucose and insulin were measured at Bl and at 30 min intervals for 2 hours. These tests were repeated after being on the diet for 6 months. Each provocative test was performed after an overnight fast with 2 or more days between tests. At Bl and 6 months, DXA scan, RMR, chemistry profile, complete blood count (CBC), vitamin D, parathyroid hormone (PTH) and lipid profiles were performed. Urine collections for 24 hours were performed for creatinine clearance (CrCl), microalbumin, calcium (Ca) and urinary urea nitrogen (UUN). These determinations were performed to determine the changes in body weight and body composition (lean mass (LM) and fat mass (FM)), insulin sensitivity and glucose response, lipid profile, Ca metabolism and protein breakdown (by urinalysis). Subjects were assessed for level of activity and all were at minimum activity. Patients were requested to continue their current level of physical activity throughout the study. After meeting the screening criteria, subjects were randomized to either the HP or HC diet using a permuted block randomization method generated by the biostatistician.
Subjects were considered to have remission of their pre-diabetes if at 6 months they had a fasting glucose of <100 mg/dL, and a 2-hour glucose level of <140 mg/dL during a single OGTT.
Diet-related parameters
Diet composition
Study participants either followed a HP or HC diet for 6 months, based on initial randomization using a randomization table. Calorie maintenance needs were determined on an individual basis using the RMR. After maintenance, caloric needs were established for each individual; 500 kcals/day were subtracted from the determined caloric needs to promote a 1–2 lbs weekly weight loss. On average, an 1800 kcal/day diet for a 100 kg individual was used to achieve adequate weight loss. A one-time calorie reduction of 200 kcal was made if a subject reached a plateau and did not lose weight for two consecutive weeks during the 6 months. No subject was on <1200 kcal/day.
A feeding study was necessary to ensure accurate macronutrient consumption. The meals were dispensed as prepackaged foods from stored frozen food by the dietician affiliated with the UT GCRC dietary services on the site of the GCRC, maintaining the macronutrient and caloric requirements established at randomization. Subjects were given three meals a day plus snacks between meals. All foods were available at local grocery stores and met the recommended daily intake (RDI) of vitamins and mineral for women and men aged 20–50 years as assessed by the University of Minnesota Nutrition Data System. Both the HP and HC diets contained more than the RDI for Ca of 1000 mg/day for women and men 20–50 years of age30 by providing an average of 1725 and 1684 mg for HC and HP diets, respectively. As the participants were obese and might be at risk for diabetes mellitus and coronary heart disease, it was prudent to ensure the participants follow a healthy diet that could minimize their health risks. For example, dietary fat sources focused on monounsaturated and polyunsaturated fats, that is, plant oils, semiliquid margarine, nuts;31–33 dietary CHO sources emphasized whole grains, fruits, vegetables and legumes; and dietary protein sources included lean meats, fish, chicken, eggs and non-fat dairy foods, that is, fat-free milk and low-fat cheese. The dietary principles are consistent with the guidelines of the Institute of Medicine32 and American Diabetes Association.34
Diet compliance
For our feeding, study participants were given detailed instructions during the prestudy orientation at screening visits. A variety of foods with the same macronutrients were offered to increase choices and adherence. After choosing their preferences for meals and snacks, they were instructed to adhere to the diet to which they were assigned. All food was provided to the participants who came in weekly to pick-up their food and daily menu food record for the week and weight checks for 6 months. The participants were required to turn in their record when they returned for the next food pick-up to check for compliance of diet adherence.
We used frequent interaction, behavior modification, individualized diet with food variety and food record systems which have been shown to increase dietary compliance. The food records served as a ‘motivational enforcement’. Recording dietary intake emphasized the importance of the diet as a key component to the study.35 Compliance was assessed by objective and subjective parameters which included weekly subject contact and detailed review of their food diaries.
DXA assessment of body composition
Hologic Discovery QDR Bone Densitometer (V.8.3) was used to measure body composition by measurements of the entire body. DXA measurements were performed at Bl and 6 months. Body composition, LM composition, FM, and bone mineral content were assessed.7 The DXA Quality Assurance manual for the GCRC was used to standardize patient positioning and scan analysis.
Resting metabolic rate
Indirect calorimetry was used to assess RMR of each participant at the beginning of the study to determine the caloric intake for the diets for each subject and at 6 months to determine changes in their metabolic rate. A Cardio Coach (Korr Medical Technologies) was used for the determination of the RMR. The subjects after an overnight (10-hour) fast were at absolute rest in a reclining position for 15 min after which respiratory exchanges were measured continuously for 15 min measuring oxygen consumption and CO2 production to determine the RMR.7 ,36
Laboratory procedures
Determination of plasma metabolic hormones, cytokines, markers of CVRs, and lipids
Glucose and insulin levels for the OGTT and MTT were measured at 0, 30, 60, 90, and 120 min and AUC calculated for Bl and 6 months. Insulin, inflammatory cytokines (tumor necrosis factor (TNF)α and interleukin (IL)-6), CVR factors (BP, triglycerides, LDL, high-density lipoprotein, cholesterol, BMI), adiponectin, oxidative stress (ROS) (dichlorofluorescein (DCF)), β-hydroxybutyrate, HbA1c were measured using our previously established methods.7 ,29 Coefficient of variation of the assays were all <5%.
CBC with diff and chemistry metabolic profile, TSH, cortisol, UUN and other tests to exclude chemical and metabolic abnormalities and protein balance were determined by standard laboratory procedures. Protein and muscle mass catabolism were assessed via 24-hour UUN, CrCl and Ca at Bl and at 6 months. Ca balance was assessed by 24-hour urine Ca excretion as well as serum Ca, 25 OH-vitamin D and PTH, at Bl and 6 months. BMI and waist were measured by standard methods.
Insulin sensitivity
The HOMA IR and insulin sensitivity index (ISI; using the Matsuda index) were calculated as previously described from plasma glucose and insulin measurements obtained during the 2-hour OGTT.3 ,7
Statistical analysis
The primary outcomes examined were remission of pre-diabetes, markers of insulin sensitivity, CVR factors, inflammatory cytokines and change in lean and fat body mass from Bl to 6 months. Initially, change was compared between the two arms using Wilcoxon rank-sum test to compare the effects of the two diets. In addition, Wilcoxon signed-rank test was used to compare Bl and 6 months data to assess effects of each diet.
To assess the effectiveness of randomization, Wilcoxon rank-sum test was used to compare Bl variables between the two arms. A p value <0.05 was considered statistically significant. If important Bl differences were identified, they were included in analysis using generalized linear models.
All analyses were conducted using SAS V.9.3 (SAS Institute, Cary, North Carolina, USA). Results are presented as mean±SE. Statistical significance was declared if the two-sided p value was <0.05. The study was designed to recruit 12 subjects in each arm. Power analysis was performed according to two scenarios at 5% significance level. In the first objective, the changes were compared between the two arms. Assuming the Bl to follow-up correlation is 0.25 and the effect size (the ratio of variance of interaction effects to within cell variance) is 0.40, interaction effects could be tested with at least 80% power. Just as important, in the absence of interaction effects, focus was shifted on assessing marginal treatment arm differences. Assuming again the Bl to follow-up correlation is 0.25 and an effect size of 0.80 (ratio of mean weight change to within SD), the changes could be tested with at least 80% power. Note that extended models having Bl covariates should lead to greater statistical power under both scenarios.
Results
Table 1 shows the mean and SE of various parameters monitored on the 12 HP and 12 HC diet subjects from Bl through 6 months and the significant difference of changes of the parameters in the subjects on the HP and HC diets. At Bl, the HP and HC groups were not statistically different. Of great significance is the 100% (12/12) remission of pre-diabetes to normal glucose tolerance in all the HP diet group subjects; whereas, there was only a 33% (4/12) remission in the HC group. Subjects on the HP and HC had significant weight loss at 6 months from their Bl weights but not significantly different between the HP and HC groups at 6 months. HbA1c and insulin sensitivity (HOMA IR and ISI) were all significantly improved at 6 months from Bl in the HP and HC diets; however, the HP group had significantly greater improvement in these parameters compared with the HC group at 6 months. The CVR factors (BP, cholesterol, triglycerides, LDL) and inflammation markers (TNFα, IL-6) were significantly decreased in both diet groups; however, the HP diet resulted in significantly greater reduction in the triglycerides, LDL, oxidative stress (ROS-DCF), TNFα, and IL-6 compared with the HC diet at 6 months. This reduction in TNFα, IL-6 demonstrates a better anti-inflammatory effect of the HP diet compared with the HC diet.
Effect of HP or HC diets on remission of pre-diabetes, weight loss, insulin sensitivity, inflammatory cytokines and cardiovascular risk factors
Figure 2 A–D shows the mean±SD for glucose and insulin values for the OGTT and MTT for the HP and HC diet groups. There was no significant difference of the Bl HP versus HC glucose or insulin AUC for the OGTTs. OGTT glucose and insulin AUCs for the HP and HC diet groups were both significantly less at 6 months compared with Bl. Importantly, the OGTT glucose and insulin AUCs for the HP diet were significantly less than the HC diet at 6 months, showing a greater improvement in glucose disposal and insulin sensitivity with the HP diet than the HC diet. The MTT HP versus HC glucose (p=0.01) and HP versus HC insulin (p=0.001) AUCs at Bl were significantly different demonstrating the difference in glycemic and insulin responses to the HP versus HC meal of the same caloric intake (300 kcal). Glucose and insulin AUCs for the HP and HC diets at 6 months were significantly less than at Bl. Additionally, the glucose and insulin AUCs for the HP MTT were significantly less than the glucose and insulin AUCs of the HC MTT after 6 months on the respective diets again demonstrating greater glucose disposal and improved insulin sensitivity with the HP diet.

The figure shows the mean±SD of glucose and insulin for the 2-hour OGTTs and MTTs for the 12 HP diet subjects and the 12 HC diets subjects. The symbols represent the following:  HP diet baseline (HP_Bl);
  HP diet at 6 months (HP_6 m);
  HC diet baseline (HC_Bl); and
  HC diet at 6 months (HC_6 m). p Values for the glucose AUC for the OGTTs are: HP_Bl versus HP_6 m=0.0005; HC_Bl versus HC_6 m=0.005; HP_6 m versus HC_6 m=0.0001. p Values for the insulin AUC for the OGTTs are: HP_Bl versus HP_6 m=0.0001; HC_Bl versus HC_6 m=0.005; HP_6 m versus HC_6 m=0.0001. p values for the glucose AUC for the MTTs are: HP_Bl versus HP_6 m=0.0005; HC_Bl versus HC_6 m=0.005; HP_Bl versus HC_Bl=0.01; HP_6 m versus HC_6 m=0.0001. p values for the insulin AUC for the MTTs are: HP_Bl versus HP_6 m=0.001; HC_Bl versus HC_6 m=0.01; HP_Bl versus HC_Bl=0.001; HP_6 m versus HC_6 m=0.0001. AUC, area under the curve; HC, high carbohydrate; HP, high protein; OGTT, oral glucose tolerance test.
Ketones were monitored by β-hydroxybutyrate determination on fasting blood during the study. β-Hydroxybutyrate for both groups showed no significant difference at 6 months from Bl and no significant difference between groups and demonstrated no significant ketosis induced by the diets. All parameters on the chemistry profile and CBC were in the normal range at Bl and 6 months. UUN increased significantly in the HP group from Bl to 6 months (8.5±2 to 17±2 g/24 hour) compared with no increase in the HC group (8.6±2 to 8.7±1.5 g/24 hour) verifying the HP group was consuming their HP diet. Neither 25-OH vitamin D, PTH, CrCl, microalbumin, serum or urinary Ca levels changed significantly in either the HP or HC group from Bl to 6 months (data not shown).
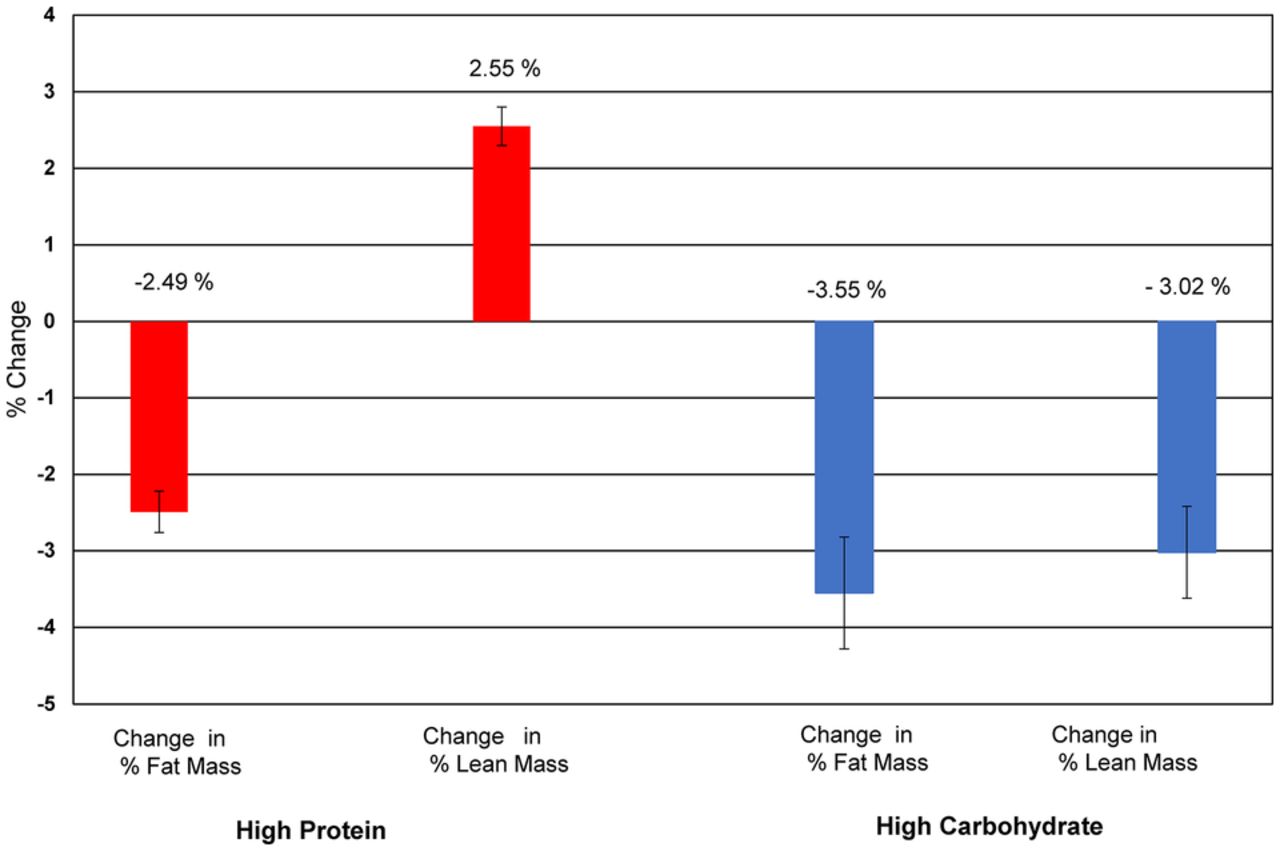
Figure 3 shows the percent LM and FM changes in the HP and HC groups. The HP group had a significant percent LM increase with a significant decrease in percent FM from Bl to 6 months on the HP diet. However, the HC group had a significant decrease in both the percent LM and FM from Bl to 6 months on the HC diet.

The figure shows the effect of the HP and HC diets on percent changes in lean body mass and fat body mass at 6 months on the diets. HC, high carbohydrate; HP, high protein.
Conclusions
There are several important findings of this study which previously have not been reported. (1) The HP diet resulted in 100% remission of pre-diabetes to normal glucose tolerance while the HC diet resulted in only 33% remission. To the best of our knowledge, this is the first lifestyle intervention study where 100% remission of pre-diabetes was obtained. Our results show that high efficacy can be achieved with dietary modification if parameters are rigorously controlled and monitored. (2) The HP group had greater improvement in insulin sensitivity, greater reduction in CVR factors, oxidative stress (ROS) and inflammation than the HC diet group. (3) The HP diet group's percent lean body mass (LM) increased while percent body FM was decreased; whereas, the HC diet group lost both percent LM and FM. (4) There was no physical activity modification during the 6 months on the diets, and since all subjects were minimally physically active, we were able to study the direct effect of the HP versus HC diets. (5) Diet meals were given to each patient weekly at our CRC along with survey of food consumption which resulted in a high level of compliance (>90%; table 1).
The HC group sustained higher glucose and insulin levels with both the OGTTs and MTTs compared with the HP diet group after 6 months on the diet. The greater insulin response with the HC diet likely equates to greater β cells stress. The higher sustained glucose elevation with ingestion of glucose or higher glycemic foods as in the HC diet correlates with increased oxidative stress and inflammation in the HC group compared with the HP group as our data show. A study showed antioxidant enzymes induced by repeated intake of excess energy in the form of high-fat, HC diets are not sufficient to block oxidative stress and inflammation in healthy human subjects.37 Thus, the fact that our HP diet had a significantly greater reduction in ROS and inflammation markers than the HC diet in pre-diabetes subjects is of great health importance.
Although both HP and HC diet subjects did minimal exercise activity, the percent LM was preserved in the HP group while FM was lost. This preservation of percent LM in the HP diet group may be an important factor in improving insulin sensitivity since muscle is a major insulin sensitive tissue for glucose uptake. Since exercise builds muscle mass, it would be of interest to know if the subjects had been on an exercise programme if the LM would be conserved in the HC group or if there could be a greater increase in the LM in the HP group with exercise in conjunction with the LM preserving effect of a HP diet.26 ,38
Although some studies have reported a HP diet can cause negative Ca balance, increased Ca loss in the urine and adversely affect the bone,39 our HP and HC diets contained more than the Food and Drug Administration (FDA) recommended amount of Ca/day30 and showed no bone loss or loss of Ca in the urine.40 The protein composition in our HP diet was 30% which is at the upper limit of suggested protein consumption range (10–30%). This may not be at a high enough percentage to cause a negative Ca balance as has been reported.
A possible limitation is assessment of insulin sensitivity by HOMA-IR with the African-American(AA) subjects;41 however, the majority of the subjects in our study were AA and neither Bl HOMA-IR nor ISI (Matsuda index) was significantly different between the HP and HC groups. Also, both methods of assessment showed greater improvement of insulin sensitivity with the HP diet than the HC diet at 6 months.
Diet compliance is an important factor in macronutrient composition diet studies. Most studies rely on a patient's recall food questionnaire of meals they ate days to weeks before which is generally inaccurate. Strengths of this feeding study are that it was a randomized control trial where all food and daily diet plans were provided to each subject in the HP and HC diet groups at their weekly visit to the CRC along with daily food consumption survey each week for 6 months. This monitoring resulted in >90% compliance of diet adherence. Our study demonstrates for the first time that strict adherence of dietary intervention is possible and can produce meaningful and reliable results and remission of pre-diabetes. At an additional 6-month follow-up visit after 6 months on the diet study, the subjects that chose to stay on the HP diet plans purchasing their own food and with consultations with the investigators when needed maintained their weight loss and normal glucose levels.
The daily cost of such a diet (HP or HC) was about $13 a day with minimal personnel involvement (except for weekly pick-up of diet supplies). The diet plans are adjustable to the subjects food likes and dislike with a wide variety of choices with different meal plans for each day of the week. Weekly meal plans and initial instructions could be provided to the subject and phone and email consultation provided when needed. By this method, the HP diet plan would allow for a diet care plan to be instituted by primary care physicians and offer an economical means of a nutritional weight loss diet and remission of pre-diabetes in men and women.
Acknowledgments
The authors thank J Crisler and A Ammons at UTHSC for assays of hormones and cytokines, all of the nursing and recruiting staff of the Clinical Research Center unit, all of whom are affiliated with the UTHSC, for their efforts and Nibedita Chowdhury, MD for assisting with some of the OGTT and MTTs and Dr John Christman for reviewing this manuscript. The authors also thank all the study volunteers for their participation in the study. The Medical Student Research Fellowship Program from the National Institutes of Health/National Institute of Diabetes and Digestive Diseases (C5T35DK007405-28; S Solomon, principal investigator (PI)) at the University of Tennessee Health Science Center funded participation of second year medical students Emily Bruno, Sherell Hicks, Channing Garber and Blake Daniels of this research study.
References
Footnotes
Contributors FBS wrote the manuscript, researched data and contributed to the conception, design, coordinated recruitment and following subjects on the study. AEK reviewed patient information, data and edited the manuscript. AB provided information on diets and provided daily food and menus to participants, reviewed and edited the manuscript. JW was the biostatistician in charge of statistical analysis and reviewed the manuscript. CS conducted history and physical examinations of subjects. BD and CG reviewed and edited manuscript and organized patient data. FBS and AEK are the guarantors of this work and, as such, had full access to the data in the study and take responsibility for the integrity of the data and accuracy of the data analysis. The manuscript has been read and approved by all the authors. AEK passed away July 18 2016, prior to publication of this paper. His contributions to diabetes research spanned over 40 years and he mentored numerous students. His presence will be greatly missed.
Funding The study was funded by the American Diabetes Association (7-12-CT-41) and the AD Baskin Research Fund (PIs FBS and AEK). Clinical Trials reg. no. NCT0164284, clinicaltrials.gov.
Competing interests None declared.
Patient consent Obtained.
Ethics approval University of Tennessee Health Science Center Institutional Review Board.
Provenance and peer review Not commissioned; externally peer reviewed.
Data sharing statement No additional data are available.