Article Text

Abstract
Objective Rising global temperatures might contribute to the current worldwide diabetes epidemic, as higher ambient temperature can negatively impact glucose metabolism via a reduction in brown adipose tissue activity. Therefore, we examined the association between outdoor temperature and diabetes incidence in the USA as well as the prevalence of glucose intolerance worldwide.
Research design and methods Using meta-regression, we determined the association between mean annual temperature and diabetes incidence during 1996–2009 for each US state separately. Subsequently, results were pooled in a meta-analysis. On a global scale, we performed a meta-regression analysis to assess the association between mean annual temperature and the prevalence of glucose intolerance.
Results We demonstrated that, on average, per 1°C increase in temperature, age-adjusted diabetes incidence increased with 0.314 (95% CI 0.194 to 0.434) per 1000. Similarly, the worldwide prevalence of glucose intolerance increased by 0.170% (95% CI 0.107% to 0.234%) per 1°C rise in temperature. These associations persisted after adjustment for obesity.
Conclusions Our findings indicate that the diabetes incidence rate in the USA and prevalence of glucose intolerance worldwide increase with higher outdoor temperature.
- Type 2 Diabetes
- Epidemiology
- Environment
- Brown Adipose Tissue
This is an Open Access article distributed in accordance with the Creative Commons Attribution Non Commercial (CC BY-NC 4.0) license, which permits others to distribute, remix, adapt, build upon this work non-commercially, and license their derivative works on different terms, provided the original work is properly cited and the use is non-commercial. See: http://creativecommons.org/licenses/by-nc/4.0/
Statistics from Altmetric.com
Significance of this study
What is already known about this subject?
The prevalence of type 2 diabetes is increasing rapidly worldwide. Interestingly, it was recently shown that acclimatization of patients with type 2 diabetes to moderate cold for only 10 days already improves insulin sensitivity. Physiologically, cold exposure activates brown adipose tissue (BAT) that has been identified to combust large amounts of lipids to generate heat. Previously, it has been shown that BAT activity is negatively associated with outdoor temperature. It is thus conceivable that an increased flux of fatty acids toward BAT may result in a compensatory increased flux of glucose to other metabolically active tissues, explaining improved insulin sensitivity at lower temperature.
What are the new findings?
On the basis of the putative role of BAT in the control of insulin action and the effect of ambient temperature on BAT activity, we hypothesized that the global increase in temperature contributes to the current type 2 diabetes epidemic. Therefore, in this study, we aimed to assess the association of outdoor temperature with diabetes incidence and prevalence of glucose intolerance, on a countrywide as well as a global scale. Here we show that the diabetes incidence rate in the USA and the prevalence of glucose intolerance worldwide increase with higher outdoor temperature.
How might these results change the focus of research or clinical practice?
On the basis of our results, a 1°C rise in environmental temperature would account for over 100 000 new diabetes cases per year in the USA alone, given a population of nearly 322 million people in 2015. This emphasizes the importance of future research into the effects of environmental temperature on glucose metabolism and the onset of diabetes, especially in view of the global rise in temperatures with a new record set for the warmest winter in the USA last year.
Introduction
The prevalence of type 2 diabetes is increasing rapidly worldwide. In 2015, 415 million adults globally were suffering from diabetes, and expectations are that the prevalence will rise by almost 55%, up to 642 million cases by 2040.1 In high-income countries, 91% of adults affected by diabetes have type 2 diabetes.1 The type 2 diabetes epidemic accompanies the increasing prevalence of obesity.2
With increasing body mass index (BMI), glucose and lipids are initially stored in expanding (subcutaneous) adipose tissue compartments. However, according to the lipid overflow hypothesis, when the storage capacity of adipose tissue is exceeded, lipids can accumulate in organs (steatosis) including the pancreas, liver, heart and skeletal muscle, resulting in insulin resistance of those organs.3 The variability in the degree of steatosis and the heterogeneity of body fat distribution over subcutaneous and visceral fat depots probably explains the only modest association between measures of overall body fat and insulin resistance.3–5 For example, South Asians are prone to develop type 2 diabetes at a relatively low BMI, presumably because of the limited lipid storage capacity of their adipose tissue depots.6 Interestingly, a very low-calorie diet can rapidly diminish steatosis and insulin resistance independent of weight loss7 indicating dissociation between insulin resistance and obesity perse.
Recently, brown adipose tissue (BAT) has emerged as an organ that is capable of combusting large amounts of lipids to generate heat.8 Physiologically, BAT is activated by cold exposure.9 ,10 Indeed, prolonged cold acclimatization recruits BAT activity10 and is able to induce modest weight loss.11 A recent landmark paper showed that acclimatization of patients with type 2 diabetes to moderate cold for only 10 days already improved insulin sensitivity as determined by a markedly higher glucose infusion rate during a hyperinsulinemic–euglycemic clamp, while body weight was unaltered.12 It is conceivable that an increased flux of fatty acids toward BAT will result in a compensatory increased flux of glucose to other metabolically active tissues, thereby improving systemic insulin sensitivity.13
It has previously been shown that BAT activity is negatively associated with outdoor temperature and is highest in winter.14–16 Considering the putative role of BAT in the control of insulin action, combined with the effect of ambient temperature on BAT activity, we hypothesized that the global increase in temperature contributes to the current type 2 diabetes epidemic. Recently, a positive association was found between outdoor temperature and glycated hemoglobin (HbA1c),17 indicating that systemic glucose homeostasis is influenced by environmental temperature. However, the importance of this association, especially in relation to the increasing diabetes burden, has never been studied on the population level. Therefore, in the present study, we aimed to assess the association between outdoor temperature and glucose metabolism on a countrywide as well as a global scale. We specifically hypothesized that diabetes incidence and prevalence of glucose intolerance increase with rising outdoor temperatures.
Research design and methods
Diabetes incidence rate in the USA
Data on diabetes incidence in 50 states of the USA and 3 territories (ie, Guam, Puerto Rico and Virgin Islands) were available for the years 1996–2013. Via the National Diabetes Surveillance System of the Centers for Disease Control and Prevention (CDC), age-adjusted diabetes incidence rates per 1000, along with the corresponding 95% CI, were available for all states and territories per year.18 The diabetes incidence rate was self-reported via the Behavioral Risk Factor Surveillance System (BRFSS) and defined as the rate of adults (18–76 years) who reported to be told by a health professional in the last year they had diabetes (type 1 or 2). Data were age-adjusted to the 2000 US standard population using age strata of 18–44, 45–64 and 65–76.7 Detailed information on survey methods can be found elsewhere.19 We restricted our analysis to the 1996–2009 period as major changes in the survey methods were implemented between 2010 and 2011. Data on the mean annual temperature per state were collected through the National Centers for Environmental Information.20 Obesity prevalence (ie, BMI≥30) per state or territory per year, expressed as a percentage with a corresponding 95% CI, was also obtained via the BRFSS of the CDC.19 ,21
Prevalence of raised fasting blood glucose worldwide
Data on country-wise prevalence rates of raised fasting blood glucose and obesity (ie, BMI≥30) were available and obtained through the WHO's Global Health Observatory online data repository system, which provides various health-related statistics for its member states.22 In this database, the prevalence of raised fasting blood glucose is defined as the percentage of the population with fasting blood glucose ≥7.0 mmol/L or on medication for raised blood glucose.23 We used the most recent age-adjusted and sex-adjusted estimates available which were based on data from 2014. Country-wise mean annual temperature data for 2014 were obtained via the Climatic Research Unit, University of East Anglia, using the 3.23 release of its data set.24 ,25
Statistical analyses
First, for each state or territory of the USA separately, we performed a weighted meta-regression analysis to estimate the association between mean annual temperatures (°C) and age-adjusted diabetes incidence rates, both measured yearly during the period 1996–2009. Age-adjusted diabetes incidence rate was included as the dependent variable and mean annual temperature was included as the independent variable. Moreover, in order to adjust for the underlying secular trends in temperature and diabetes incidence, all meta-regression models were adjusted for the effect of time passage by including the variable year as an additional independent variable in the models. For Guam, Illinois and the Virgin Islands, there were insufficient data to perform a meta-regression analysis, and therefore these were excluded from further analyses.
Second, a meta-analysis was performed to integrate the results of the meta-regression analyses into an overall effect estimate, representing the mean strength of the association between mean annual temperature and diabetes incidence rate in the USA during the period 1996–2009. For the worldwide data, we performed a meta-regression analysis with age-adjusted and sex-adjusted country-wise prevalence of raised fasting blood glucose as the dependent variable and mean annual temperature as well as the World Bank income group (ie, low, lower middle, upper middle and high income)22 as the independent variables. For meta-regression analysis and meta-analysis, the DerSimonian and Laird random-effects model was used.26 ,27 Weights were calculated as  with
with  being the SE of the age-adjusted incidence rate in year i and
  the estimated between-study variance.28 SEs of the age-adjusted incidence rates were unknown and therefore estimated as
  with UL the upper limit and LL the lower limit of the 95% CI of the age-adjusted incidence rate.
To establish whether the association between mean annual temperature and diabetes incidence rate was mediated through effects on body weight, we first calculated an overall effect estimate for the association between mean annual temperature and obesity prevalence in the USA using a similar approach as described above. Since this overall effect size significantly differed from zero, we added obesity prevalence as an independent variable in the meta-regression models relating mean annual temperature and diabetes incidence rate. Subsequently, we again performed a meta-analysis to integrate the estimates of the obesity prevalence corrected meta-regression analyses into an overall effect estimate for the association between mean annual temperature and diabetes incidence rate adjusted for obesity prevalence in the USA during the period 1996–2009. For the global data, we performed a similar analysis by considering obesity prevalence as a mediator variable in the meta-regression models.
We also composed a map of the USA showing the mean annual temperature over the period 1996–2009 and β coefficients from the obesity-adjusted meta-regression analyses per state. This map provides insight into potential geographically determined confounding factors (eg, sea influences, biomes or altitudes), which could be apparent from a non-random distribution of β coefficients overlapping with geographical patterns.
Programming was performed in STATA Statistical Software V.12.0 (Statacorp, College Station, Texas, USA) and R V.3.1.0 using the ‘metafor’ package.29 Maps were computed using MATLAB V.R2015a (The MathWorks, Natick, Massachusetts, USA).
Results
National level: USA
Table 1 shows data on annual temperature, diabetes incidence rate and obesity prevalence in the period 1996–2009 for each included US state or territory. During these 14 years, the age-adjusted diabetes incidence rate was highest in Puerto Rico, West Virginia and South Carolina and lowest in Minnesota, Massachusetts and Colorado. The mean change (Δ) in annual temperature between two consecutive years ranged from −0.11°C (Minnesota) to +0.09°C (Hawaii).
Temperature characteristics, mean diabetes incidence, and mean obesity prevalence in the USA* over the period 1996–2009
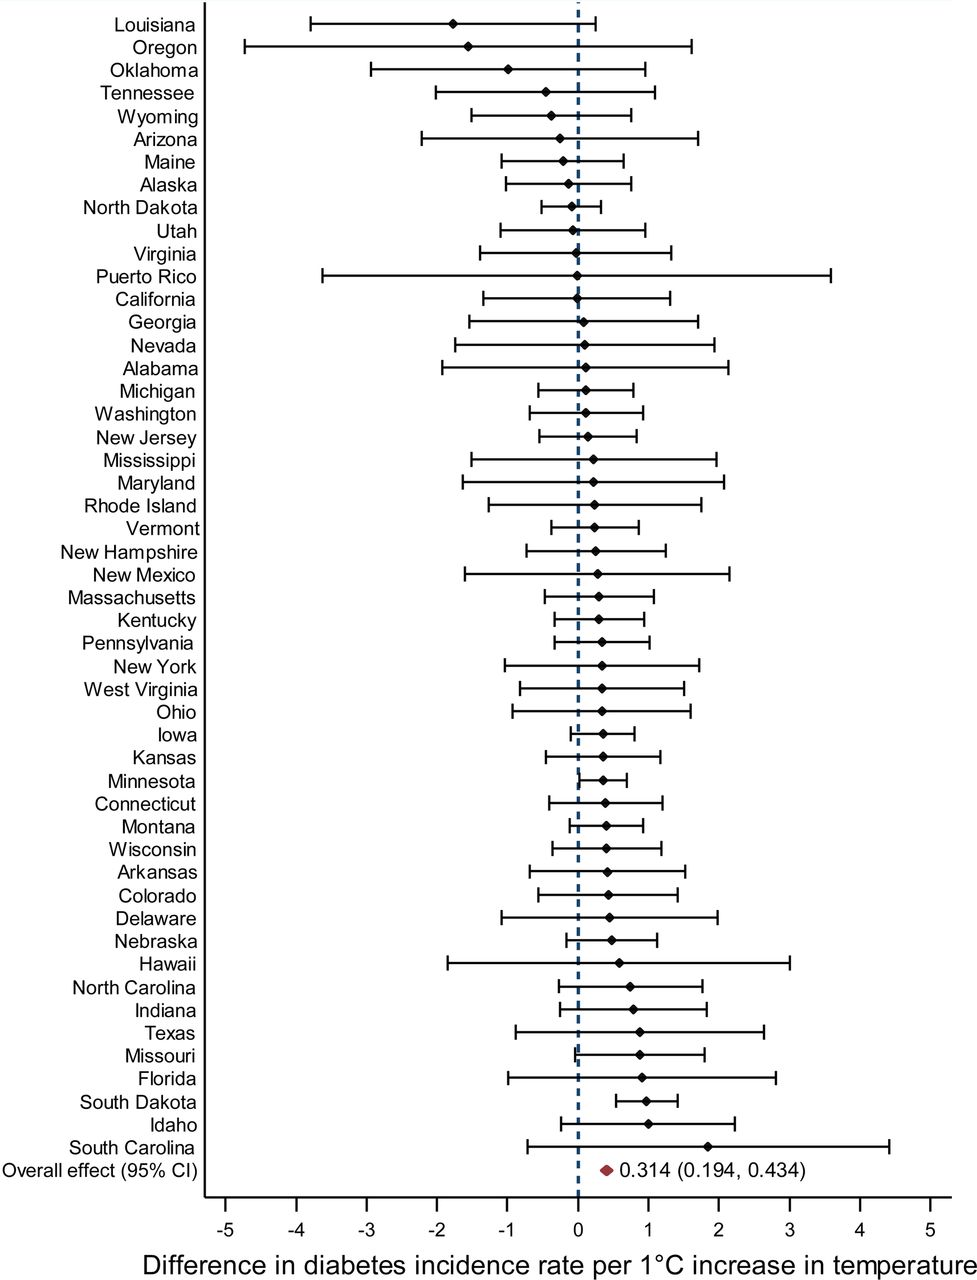
Both diabetes incidence rate (figure 1) and obesity prevalence (see online supplementary figure S1) increased with higher mean annual temperature. The overall effect estimate for the association between mean annual temperature and diabetes incidence rate was 0.314 (95% CI 0.194 to 0.434), indicating a 0.314 increase in the diabetes incidence rate per 1000 for each degree Celsius increase in mean annual temperature. Similarly, obesity prevalence increased by 0.173% (95% CI 0.050% to 0.296%) for each degree Celsius increase in mean annual temperature.

The association between mean annual temperature and diabetes incidence in the USA over the period 1996–2009. The forest plot represents the differencea,b in diabetes incidence rate per 1°C increase in temperature.a The β coefficient from meta-regression analysis. Error bars represent a 95% CI.b Adjusted for the effect of time passage. Diabetes incidence rate is the age-adjusted diabetes incidence rate per 1000.
supplementary figures
After adjustment for obesity prevalence, the positive association between mean annual temperature and diabetes incidence rate attenuated only slightly (see online supplementary figure S2). Per degree Celsius increase in mean annual temperature, the obesity-adjusted diabetes incidence rate increased by 0.290 (95% CI 0.164 to 0.416) per 1000.
Figure 2 shows a map of the USA, illustrating the relation between the mean annual temperature per state over the period 1996–2009 and the magnitude of the corresponding change in obesity-adjusted diabetes incidence rate. As can be appreciated from this figure, the diabetes incidence rate increases in most states with higher mean annual temperature, while there is no apparent geographical pattern which could explain this association.
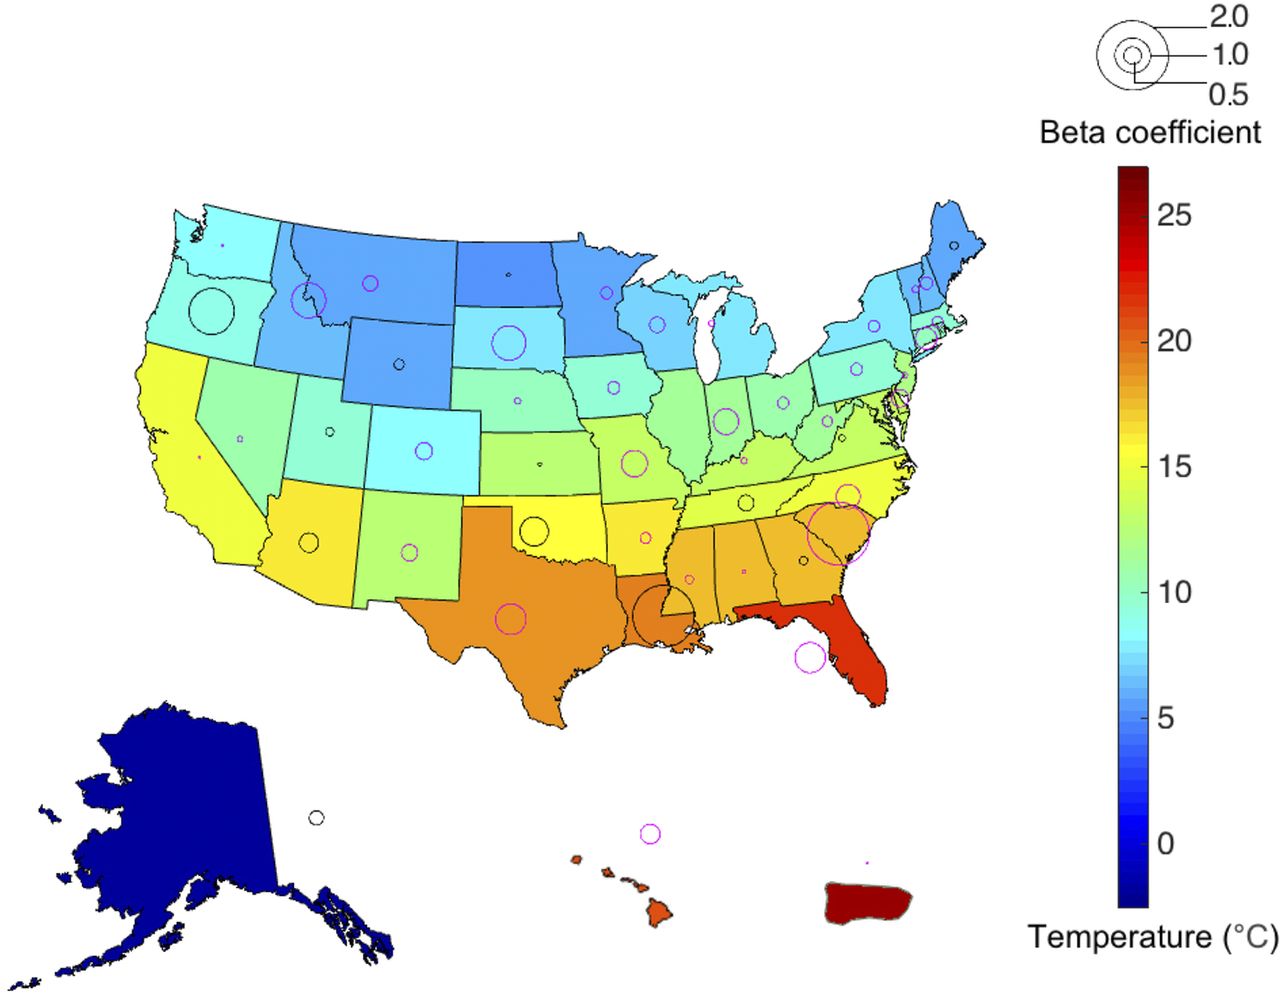
Map of the USA (including Alaska, Hawaii and Puerto Rico), showing the mean annual temperature and the magnitude of the β coefficientsa from the obesity-adjusted meta-regression analysis,b per state or territory over the period 1996–2009.a The β coefficient from meta-regression analysis, representing the difference in diabetes incidence rate per 1°C increase in temperature; red circles indicate a positive β coefficient, while blue circles indicate a negative β coefficient.b Adjusted for the effect of time passage. Diabetes incidence rate is the age-adjusted diabetes incidence rate per 1000.
Global level
Prevalence data on raised fasting blood glucose and obesity were available for 190 countries. The worldwide aggregated age-adjusted and sex-adjusted prevalences of raised fasting blood glucose levels and obesity were 9.65% (95% CI 9.11% to 10.13%) and 19.51% (95% CI 17.94% to 21.07%), respectively. There was a positive association between mean annual temperature and country-wise age-adjusted, sex-adjusted and income-adjusted prevalence of raised fasting blood glucose. The prevalence increased by 0.170% for each degree Celsius rise in temperature (95% CI 0.107% to 0.234%).
There was also a positive association between mean annual temperature and country-wise age-adjusted, sex-adjusted and income-adjusted obesity prevalence. For each degree Celsius rise in temperature, the obesity prevalence increased by 0.295% (95% CI 0.137% to 0.454%). Interestingly, the increase in obesity prevalence for each degree Celsius rise in average temperature was larger in women (0.503%) as compared with men (0.111%; mean difference 0.391%, 95% CI 0.160% to 0.622%). After additional adjustment for obesity prevalence, the association between mean annual temperature and country-wise age-adjusted, sex-adjusted and income-adjusted prevalence of raised fasting glucose slightly attenuated (0.106% increase for each degree Celsius rise in temperature, 95% CI 0.057% to 0.155%; figure 3).

The worldwide association between mean annual temperature and age-adjusted, sex-adjusted, income-adjusted and obesity-adjusted prevalence of raised fasting blood glucose for 190 countries in 2014. Colors indicate the six WHO regions.40 The size of each circle is inversely proportional to the SE of the estimate of the prevalence of raised FBG. FBG, fasting blood glucose.
Given the extremely high prevalence of raised fasting glucose in some relatively small countries (figure 3), we performed a sensitivity analysis excluding all countries (n=29) with a prevalence of raised fasting blood glucose higher than 15%. Under this restrictive scenario, the association between mean annual temperature and country-wise age-adjusted, sex-adjusted, income-adjusted and obesity-adjusted prevalence of raised fasting blood glucose remained present: 0.051% increase in prevalence for each degree Celsius rise in temperature (95% CI 0.003% to 0.099%; see online supplementary figure S3).
Conclusions
The association between outdoor temperature and fasting blood glucose concentration has rarely been examined in the past, and studies showed discordant results.30 ,31 These studies were performed in selected study populations from specific cities and the conflicting results indicate that the results are not generalizable to other places. To the best of our knowledge, this study is the first to assess the association of outdoor temperature with diabetes incidence and the prevalence of raised fasting blood glucose on a national and global level. Using 14-year longitudinal state-level data from the USA, we show that the overall diabetes incidence rate is higher in warmer years. Per 1°C increase in temperature, we found an overall increase in age-adjusted diabetes incidence of 0.314 per 1000.
Importantly, we expect confounding in this association to be minimal, as temperature itself is hardly influenced by any extraneous factors, apart from the passage of time and geographical location. Hence, we adjusted the models for the underlying secular trends in temperature and diabetes incidence by adjusting for time passage. Also, by first determining the association for each state separately before pooling for obtaining the overall effect estimate, we minimized the effect of potential geographically determined confounding factors, and in this way we also precluded all other differences between states that could influence or bias the association between temperature and diabetes incidence. Furthermore, the distribution of the magnitudes and directions of the β coefficients over the USA (figure 2) appeared to be random as we could not distinguish a pattern overlapping with geographic (eg, sea influences, biomes or altitudes) or demographic characteristics, indicating that these factors do not explain the association. Our results are therefore unlikely to be merely due to interstate demographic, socioeconomic or other differences.
On the global scale, detailed longitudinal international data on diabetes incidence rates were unfortunately unavailable for a large number of countries. Therefore, we used country-wise estimates of the prevalence of raised fasting blood glucose instead. In accordance with the results of the USA, we found that on a global level the prevalence of glucose intolerance is higher in warmer countries. This association between temperature and raised fasting blood glucose cannot be merely due to international differences in age, sex, income or obesity prevalence, as our analyses were adjusted for these variables. Although we cannot exclude residual confounding by population stratification, the fact that this association closely parallels our findings in the USA supports the notion that the ambient temperature affects the occurrence of glucose intolerance worldwide.
The associative design of our study does not allow us to draw conclusions on causality. However, it is tempting to speculate that the mechanism underlying our present findings is related to an interplay between BAT activity and glucose clearance from the circulation by metabolically active tissues. Recently, peripheral insulin sensitivity in patients with type 2 diabetes was shown to increase markedly after 10 days of mild cold exposure.12 These patients had an increased glucose uptake by skeletal muscle, probably explained by an increased overall flux of fatty acids toward BAT, reducing the fatty acid flux to other tissues.13 Interestingly, in this short-term cold acclimation study, body weight was unaffected,12 indicating that the effects of temperature on glucose metabolism can occur independently of body weight. This is further supported by another study showing that higher BAT activity after cold exposure was associated with lower blood glucose and HbA1c levels independent of body fat.32 In line with these findings, we found that adjustment for obesity prevalence only slightly attenuated the association of outdoor temperature with both diabetes incidence in the USA and prevalence of glucose intolerance worldwide. Therefore, our data are consistent with the hypothesis that a decrease in BAT activity with increasing environmental temperature may deteriorate glucose metabolism and increase the incidence of diabetes. The role of BAT activity as an underlying pathway in the association between outdoor temperature and diabetes incidence may even be genetic in origin. According to the cold climate genes hypotheses, DNA areas involved in thermogenesis may have encountered selection pressure during evolution in areas with cold climates.33 The biological effects of the gene products may also decrease susceptibility to diabetes. Interestingly, DNA areas that regulate uncoupling proteins, including uncoupling protein 1 that drives heat production in BAT, have been proposed as candidates for these cold climate genes.33
Besides BAT activity, physical activity could be a potential mediator in the association between temperature and diabetes incidence, as physical activity varies with environmental temperature.34 Although a decrease in physical activity with increasing mean annual temperature may theoretically explain our findings, physical activity has been shown to be highest between daily temperatures of 15°C and 20°C and decreases with higher but also lower temperatures.35 ,36 Therefore, we do not expect that physical activity completely explains the positive association between outdoor temperature and diabetes incidence. Unfortunately, data on physical activity for the USA were not available for the period 1996–2009, and therefore we were not able to further elucidate the mediating effects. This topic evidently requires further investigation.
There are several potential limitations to our study. First, we used state-level and country-level aggregated data on incidence and prevalence rates. Although individual-level data would have yielded more accurate results, acquiring individual-level data on such a large scale was not feasible. Moreover, we used statistical techniques, that is, meta-regression and meta-analysis, which can appropriately account for the uncertainty in the aggregated effect estimates. Second, available data on BMI were categorically organized (ie, obesity prevalence) and BMI could therefore not be applied as a continuous variable in the models. Although continuous data would have been more accurate, the prevalence of obesity is by definition closely related to the average BMI and its distribution in the general population, implying that obesity prevalence can be used as a valid surrogate measure for average BMI in a given population. It should be emphasized that we were not able to evaluate the linearity of the association between BMI and diabetes incidence or prevalence in our models, as continuous data on BMI were not available. Although adjustment for obesity prevalence only slightly attenuated the association between outdoor temperature and diabetes, mediation via BMI should be further evaluated in future studies to assess whether a non-linear association between BMI and diabetes might account for our results. Third, owing to the observational nature of our analyses, we cannot exclude residual confounding. For the USA, however, we largely circumvented this issue by analyzing longitudinal state-level data for each state separately before pooling the results. Furthermore, adjustment for important intercountry differences, that is, age, sex, income and obesity, did not materially change the results on the global level. Importantly, adjusting for income also takes along other intercountry differences, as many surrogate measures which are often applied for adjusting for global inequalities in the degree of social development are based on the gross national income (GNI) per capita. In fact, the WHO uses a four-group classification scheme, based on the Work Bank Atlas methodology to estimate GNI per capita,37 according to which each country is categorized as low, lower middle, upper middle or high income.22
In conclusion, diabetes incidence rate in the USA and prevalence of glucose intolerance worldwide increase with higher outdoor temperature. On the basis of our results, a 1°C rise in environmental temperature would account for over 100 000 new diabetes cases per year in the USA alone, given a population of nearly 322 million people in 2015.38 These findings emphasize the importance of future research into the effects of environmental temperature on glucose metabolism and the onset of diabetes, especially in view of the global rise in temperatures with a new record set for the warmest winter in the USA last year.39
References
Footnotes
LLB, NAA, HP and PCNR contributed equally.
In memoriam (17 January 2016) Dr Anton J de Craen, Department of Gerontology and Geriatrics, Leiden University Medical Center, Leiden, The Netherlands
Contributors LLB and NAA were involved in study concept and design, acquisition of data, analysis and interpretation of data, statistical analysis, and drafting of the manuscript. MRT was involved in study concept and design, analysis and interpretation of data, and critical revision of the manuscript. CAB was involved in MATLAB programming, analysis and interpretation of data, and critical revision of the manuscript. AJdC was involved in study concept and design, analysis and interpretation of data, and statistical analysis. HP and PCNR were involved in study concept and design, analysis and interpretation of data, critical revision of the manuscript, and study supervision.
Funding LLB is supported by an excellence grant from the Board of Directors of the Leiden University Medical Center. NAA is supported by a VENI grant (#91615080) from the Netherlands Organization of Scientific Research. PCNR is an established investigator of the Dutch Heart Foundation (2009T038).
Competing interests None declared.
Provenance and peer review Not commissioned; externally peer reviewed.
Data sharing statement No additional data are available.