Article Text

Abstract
Objective Nutrition therapy is an integral part of self-management education in patients with type 2 diabetes. Carbohydrates with a low glycemic index are recommended, but the ideal amount of carbohydrate in the diet is unclear. We performed a meta-analysis comparing diets containing low to moderate amounts of carbohydrate (LCD) (energy percentage below 45%) to diets containing high amounts of carbohydrate (HCD) in subjects with type 2 diabetes.
Research design and methods We systematically reviewed Cochrane library databases, EMBASE, and MEDLINE in the period 2004–2014 for guidelines, meta-analyses, and randomized trials assessing the outcomes HbA1c, BMI, weight, LDL cholesterol, quality of life (QoL), and attrition.
Results We identified 10 randomized trials comprising 1376 participants in total. In the first year of intervention, LCD was followed by a 0.34% lower HbA1c (3.7 mmol/mol) compared with HCD (95% CI 0.06 (0.7 mmol/mol), 0.63 (6.9 mmol/mol)). The greater the carbohydrate restriction, the greater the glucose-lowering effect (R=−0.85, p<0.01). At 1 year or later, however, HbA1c was similar in the 2 diet groups. The effect of the 2 types of diet on BMI/body weight, LDL cholesterol, QoL, and attrition rate was similar throughout interventions.
Limitations Glucose-lowering medication, the nutrition therapy, the amount of carbohydrate in the diet, glycemic index, fat and protein intake, baseline HbA1c, and adherence to the prescribed diets could all have affected the outcomes.
Conclusions Low to moderate carbohydrate diets have greater effect on glycemic control in type 2 diabetes compared with high-carbohydrate diets in the first year of intervention. The greater the carbohydrate restriction, the greater glucose lowering, a relationship that has not been demonstrated earlier. Apart from this lowering of HbA1c over the short term, there is no superiority of low-carbohydrate diets in terms of glycemic control, weight, or LDL cholesterol.
- Carbohydrate(s)
- Dietary Intervention
- Type 2 Diabetes
- Glycemic Control
This is an Open Access article distributed in accordance with the Creative Commons Attribution Non Commercial (CC BY-NC 4.0) license, which permits others to distribute, remix, adapt, build upon this work non-commercially, and license their derivative works on different terms, provided the original work is properly cited and the use is non-commercial. See: http://creativecommons.org/licenses/by-nc/4.0/
Statistics from Altmetric.com
Key messages
The ideal amount of carbohydrates in the diet in the management of type 2 diabetes is unclear.
The current meta-analysis conducted according to the GRADE system of rating quality of evidence shows that low to moderate carbohydrate diets have greater glucose-lowering effect compared with high-carbohydrate diets.
The greater the carbohydrate restriction, the greater glucose lowering.
Apart from improvements in HbA1c over the short term, there is no superiority of low-carbohydrate diets in terms of glycemic control, weight, or LDL cholesterol.
Introduction
Nutrition therapy is an integral part of self-management education in patients with type 2 diabetes. Current recommendations suggest a hypocaloric diet for overweight patients with the aim of achieving weight loss and improving glycemic control and carbohydrates with a low glycemic index to improve postprandial glucose control.1 However, the ideal energy percentage (E%) of carbohydrate in the diet is unclear. Traditionally, an intake of 45–60% carbohydrate (high-carbohydrate diet (HCD)) has been recommended, but in recent years, diets with a restricted amount of carbohydrate, that is, low-carbohydrate diets (LCD), have been suggested by some experts2 and are preferred by some patients (http://www.diabetes.co.uk/diet-for-type2-diabetes.html). The arguments have been an improved glycemic control,3 a quicker and more pronounced weight loss in obese people without diabetes, and a more beneficial effect on lipids.2 However, this is not supported by the evidence from high-quality randomized controlled trials (RCTs) of type 2 diabetic subjects, and the published studies have been heterogeneous with regard to amount and types of carbohydrate, fat, and protein in the LCD and HCD diets compared. Conclusions on the efficacy of LCD compared with HCD from recent reviews are thus conflicting with regard to glycemic control and weight loss.4–8 A very recent critical review based on predefined criteria9 found no evidence of any superiority of LCD compared with HCD.
Objective
We aimed to examine the effects of low to moderate carbohydrate diet in comparison to HCD in subjects with type 2 diabetes by meta-analysis of high-quality RCTs. The assessed outcomes were HbA1c, BMI/weight, LDL cholesterol, quality of life (QoL), and dropout rates. The meta-analysis was part of the basis for the Danish National Guideline for lifestyle intervention in type 2 diabetes using the Grading of Recommendations Assessment, Development, and Evaluation (GRADE) system of rating quality of evidence.
Methods
Eligibility criteria
We specified eligibility criteria for the search and meta-analyses using the PICO approach: determination of the Population (P), Intervention (I), Comparison (C), and Outcomes (O). We subsequently defined the specific question to be explored in the literature: What is the effect of dietary carbohydrate restriction compared with the recommended diet containing 45–60% carbohydrate in people with type 2 diabetes?
Population was subjects with type 2 diabetes based on clinical criteria. Intervention was randomized trials comparing carbohydrate restriction (below 45%) to diet of 45–60% carbohydrate. Interventions aimed at also changing the glycemic index of the diet were not included. Carbohydrate restriction could be combined with a higher fat intake, a higher protein intake, or both. The selected primary outcomes of the analysis were glycemic control (HbA1c) and body mass index (BMI) after 1 year or more. Secondary outcomes were HbA1c and BMI before 1 year, LDL cholesterol, QoL, and dropout rates. Weight was included in the analysis if BMI was not available, whereas anthropomorphic data were expected to be limited in the included trials, and were therefore not considered.
Information sources and search strategy
A research librarian performed systematic literature searches including the following databases: EMBASE, MEDLINE, and COCHRANE LIBRARY databases.
Literature search was performed in October 2014. It was limited to references published in English or Scandinavian languages from January 2004 to October 2014. Three searches were made, first for guidelines, then for reviews, and finally for RCTs. The results of all searches were entered into the Covidence software program for analyses.10
Study selection
After each search, based on title and abstract, one author (OS) extracted relevant reports and papers for full-text evaluation by two independent authors (GMP, HKA, or OS).
Only high-quality guidelines based on GRADE or similar evaluation systems and systematic reviews of randomized trials were included. Clinical guidelines were evaluated using the AGREE II-software, if relevant to the issues we address.11 Similarly, systematic reviews were evaluated using AMSTAR.12 Evaluations were performed by two authors independently (GMP, HKA, or OS). Disagreements were primarily resolved through discussions and second by the third author.
Data collection process and risk of bias in individual studies
Two reviewers independently extracted data from the included randomized trials and recorded details about study design, interventions, participants, and outcome measures.
The risk of bias was assessed against the key criteria: random sequence generation; allocation concealment; blinding of participants, personnel, and assessors; incomplete outcome data; selective outcomes reporting; and other sources of bias, in accordance with the recommendations of the Cochrane Collaboration.13 The following ranking was used: low risk, high risk, or unclear (lack of information or uncertainty over the potential bias). Authors resolved disagreements by consensus, consulting a third author if necessary.
Results
No guidelines based on GRADE or other comparable evaluation systems address the issues of the present review.
Eleven reviews were selected for full-text evaluation (figure 1). The predefined criteria for entering the analysis and the issues we address were fulfilled in only one high-quality review.6 Furthermore, only part of this review was relevant for the present analysis, so we entered data from individual studies rather than using estimates from the review.
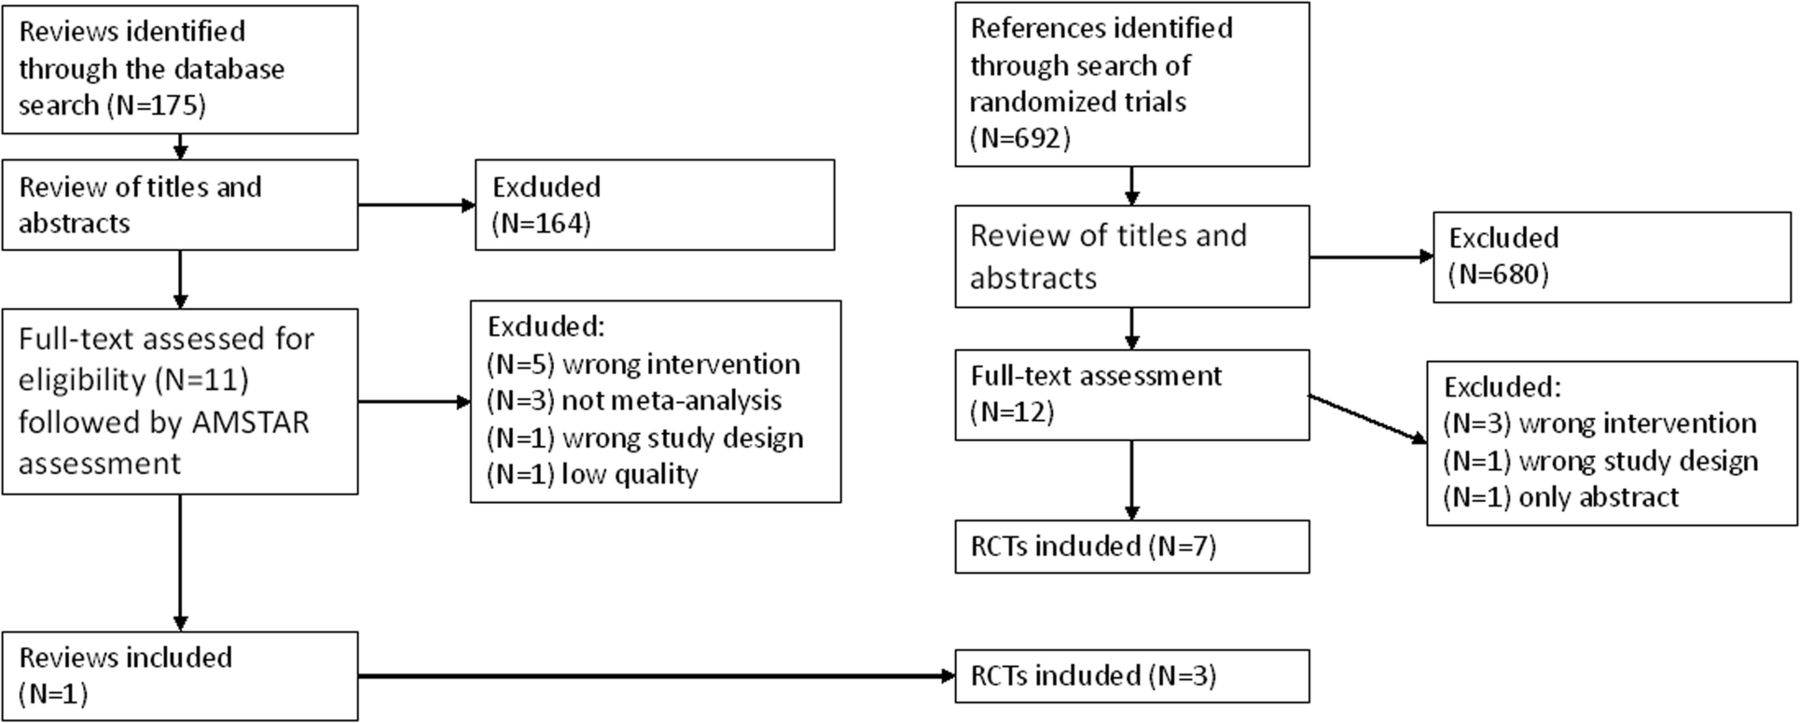
Flow chart of the selection process.
The search for RCTs revealed 692 papers, of which 12 were selected for full-text assessment (figure 1). Seven RCTs that fulfilled the defined criteria and had relevant outcomes were included in the analyses,14–20 together with three other RCTs21–23 identified in the review by Ajala et al.6 In two of the included RCTs, the QoL data were located in separate papers.24 ,25
Study characteristics and risk of bias
All trials were conducted in outpatient settings using parallel RCT designs. In two trials, a number of subjects were randomized to diets not relevant for the comparison,21 ,23 and these groups were therefore not included in the analysis. In total, 1376 subjects with type 2 diabetes were included in this analysis. Forty-nine percent were male, and the average age was 58 years. The majority were obese—mean BMI ranged from 26 kg/m2 in an Asian population20 to 37 kg/m2 in an American population. Table 1 shows characteristics of the included studies.
Characteristics of included studies
In five randomized trials, the duration of the intervention was 12 months, in two, it was 3 months, in one, it was 6 months, and in two studies, the intervention was 24 months. Subjects randomized to the LCD or HCD groups received comparable nutrition therapy by trained dieticians, with about the same number and frequency of follow-up sessions. Self-reported food intake was monitored in all trials using 1–7 days diaries, but energy percent intake of carbohydrates, fat, and protein was only available in nine trials (table 1). In the LCD groups, subjects were instructed to substitute calories from carbohydrates with either protein,16 ,17 fat,14 ,18 ,21–23 or both.15 ,19 ,20 The average predefined targets for the assigned carbohydrate restriction were 25% (range 14–40%). The average reported intake was 30% (range 14–45%) after 3 or 6 months of intervention, and 38% (range 27–45%) at 1 year (5 trials). Three trials had 24 months follow-up.15 ,16 ,22 Reported carbohydrate intake either increased further compared with 12 months, from 42% to 48%15 and 27% to 31%,22 or remained high (45%).16 In five trials,14 ,17 ,19 ,21 ,22 subjects were advised to increase their daily physical activity equally in each group.
Usable data were available on three or more of the predefined outcomes (BMI, HbA1c, LDL cholesterol, and weight).
QoL was evaluated using different scales,14–16 and others used questionnaires for depression, problem areas in diabetes, and physical activity.18 ,20
The mean HbA1c at baseline was just below 7.0% (53 mmol/mol) in the study by Saslow et al.18 HbA1c in the other studies was between 7.3% (56 mmol/mol) and 8.3% (67 mmol/mol).
The risk of bias was assessed from the available full text, using the Cochrane Risk of Bias tool,13 the elements are given in figures 2, 3, and 5. Subjects were randomized prior to intervention in all trials. The random sequence generation method was described in all but one study.20 Allocation concealment was described in six trials. Blinding of participants and personnel (performance bias) was not possible. Blinding of outcome assessors was reported in five trials and unclear in the other. There was an unbalanced randomization regarding age in the study by Saslow et al18 and four subjects in this study had per definition pre-diabetes with HbA1c between 6.0% and 6.5% at baseline. A tendency to a larger long-term dropout rate during LCD (see below) suggests possible attrition bias. There were no other potential sources of bias and we assessed the overall risk of bias to be low to moderate.
Effects of the intervention
Table 2 shows the summary of findings of the meta-analysis. Figures 2, 3, and 5 show Forest plots of the most important predefined outcomes, with estimates from individual studies.
Summary of findings
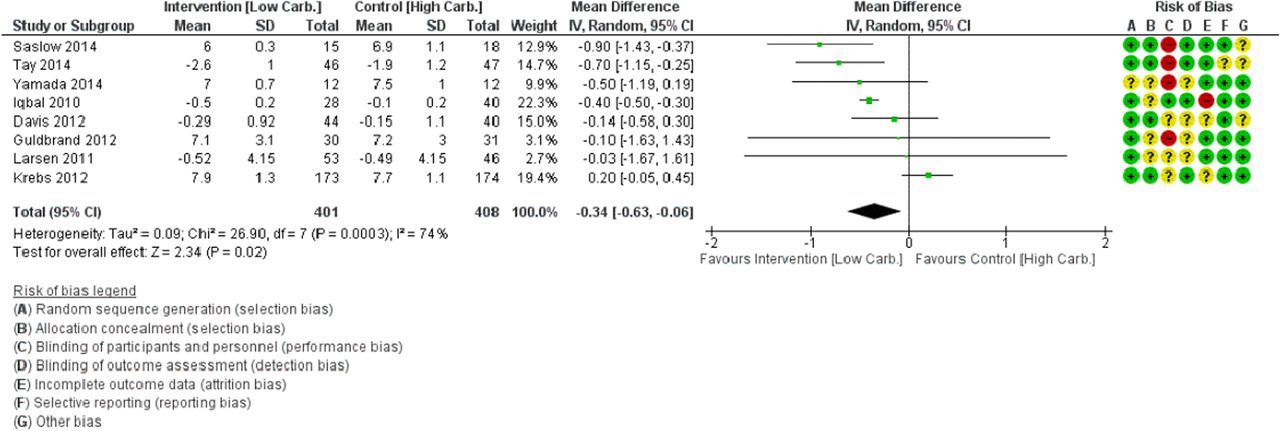
Low to moderate carbohydrate diets (LCD) and HCD had equal effect on BMI or body weight, in short as well as in long-term studies (table 2). These estimates showed no major heterogeneity.
Waist circumference was not a predefined outcome of this meta-analysis, but it was measured in six trials15–17 ,19 ,20 ,23 and in these, waist circumference changed equally in the LCD and HCD groups during interventions.
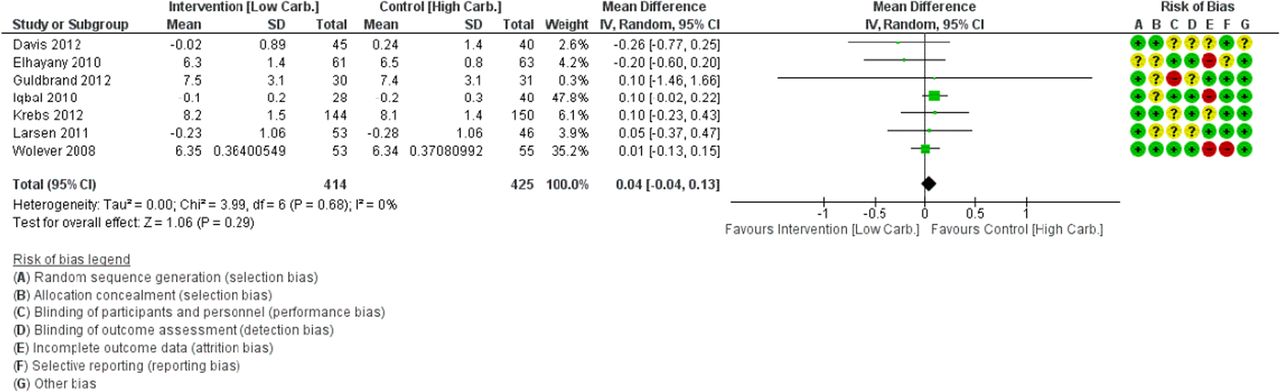
In the first year of intervention (3 or 6 months), LCD was followed by a 0.34%-point (3.7 mmol/mol) lower (95% CI 0.06 (0.7) to 0.63 (6.9)) HbA1c compared with HCD (table 2 and figure 2). Owing to heterogeneity, however, the quality of the evidence for this is only moderate (figure 2). At 1 year or later, HbA1c (seven trials included) was similar in the two groups (figure 3).

Forest plot of change in HbA1c (%-point) after 3 or 6 months of low to moderate carbohydrate diet compared with high-carbohydrate diet in type 2 diabetes.
Forest plot of change in HbA1c (%-point) after 12 months of low to moderate carbohydrate diet compared with high-carbohydrate diet in type 2 diabetes.
The magnitude of this greater glucose-lowering effect of low to moderate carbohydrate diets in the first year of intervention was related to the reported intake of carbohydrates measured as energy% (figure 4) (eight trials, R −0.85, p<0.01). The effect on glycemic control increased with the reported degree of carbohydrate restriction. The reported intake of carbohydrate in grams was available in four of these studies15 ,18–20 and ranged from 57 to 198 g in the LCD groups, and from 133 to 205 g in the HCD groups. The two studies with the lowest daily carbohydrate intake in the LCD groups, 57 and 58 g, respectively, found the largest reduction in HbA1c (figure 4).18 ,19 Substituting carbohydrate with high fat, high protein, or both had no significant impact on the effect.
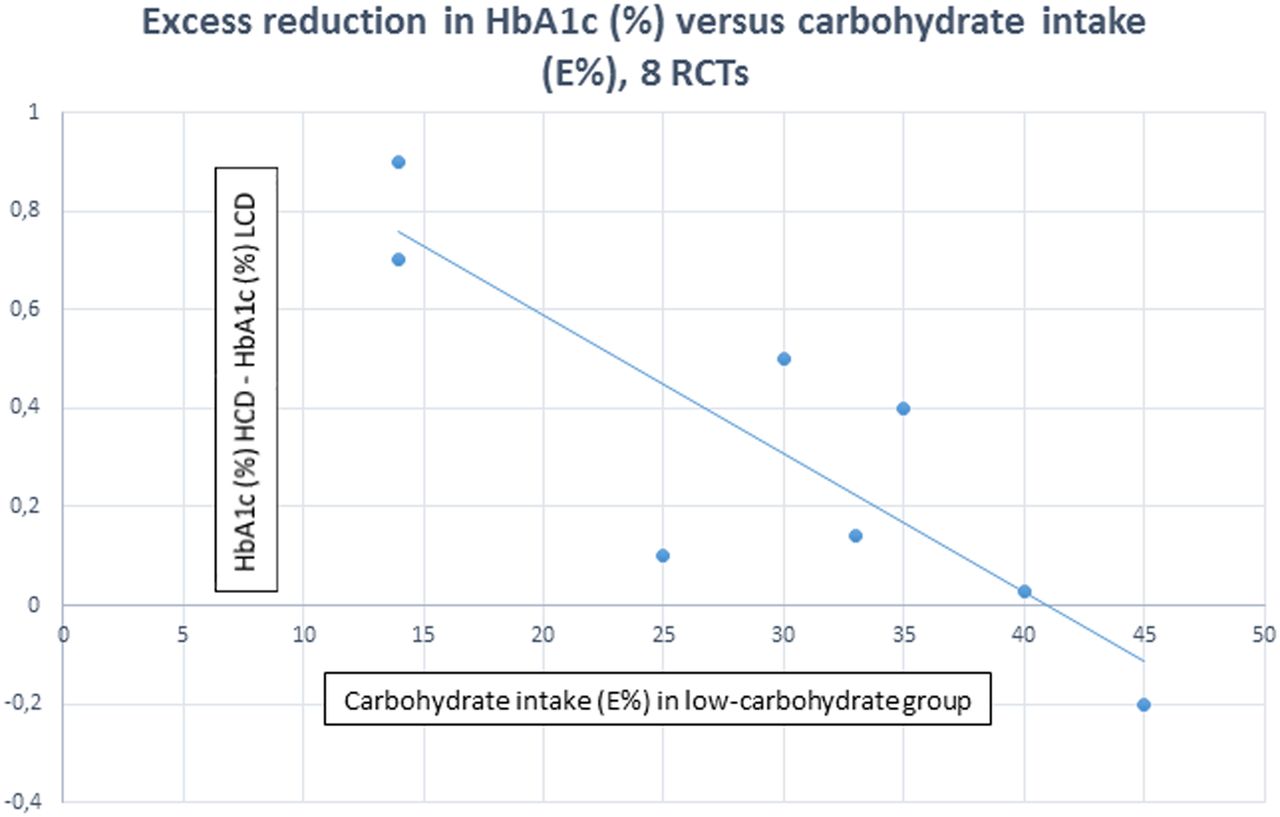
The excess effect of 3 or 6 months low to moderate carbohydrate diet compared with high-carbohydrate diet on HbA1c (%) versus reported intake (Energy %) of carbohydrate in the low to moderate carbohydrate groups in eight randomized trials.
Reports on glucose-lowering medication during interventions were available in seven studies.14 ,15 ,17–20 ,23 Medication was reduced at 3 or 6 months during LCD compared with HCD,15 ,17–19 and was numerically lower at 12 months.14 ,15 ,17 One study did not report changes in medication, but found symptomatic hypoglycemia in three subjects treated with LCD.20
LCD and HCD had similar effects on LDL cholesterol throughout interventions (table 2).
Two trials measured QoL by means of SF-36 questionnaires.16 ,25 Physical component score tended to deteriorate during LCD compared with HCD (−1.93 (95%: −4.1 to 0.16), p=0.07), whereas mental component score was similar (table 2). Scores were not significantly different between groups using the Diabetes-39 questionnaire24 or other questionnaires.18 ,20
There were no differences between groups in reported adverse events, cardiovascular events, or mortality.
Dropouts
Dropout rates at longest follow-up were similar in the two groups (figure 5). In trials with long follow-up, however,16 ,22 dropout rates tended to be larger in the LCD groups.

Forest plot of dropout rates during low to moderate carbohydrate diet compared with high-carbohydrate diet in type 2 diabetes, end of trials.
The dropout rates differed considerably between studies, ranging from 2% to 60% in the LCD groups and from 2% to 46% in the HCD groups.
Discussion
This meta-analysis conducted according to the GRADE criteria shows that nutrition therapy with a low to moderate E% carbohydrate diet induces a greater decline in HbA1c in subjects with type 2 diabetes compared with a standard HCD. Considering baseline HbA1c in the included studies, and that it was necessary to reduce glucose-lowering medication during LCD in many trials, the 0.34%-points (3.7 mmol/mol) improvement in glycemic control is of clinical significance. It was present after 3 or 6 months of intervention, but not after 1 year or later. The excess reduction in HbA1c was correlated with the degree of carbohydrate restriction, a finding not reported earlier. A recent review of the literature26 did not perform meta-analysis of the available HbA1c data due to a large heterogeneity in the carbohydrate intake in the intervention groups, and other meta-analyses have either shown a numerically greater reduction in HbA1c,6 ,7 or no effect in type 2 diabetes.9
A recent 52-week randomized dietary trial by Tay et al27 tested the effect on glucose profiles of an LCD with 14% carbohydrate, 58% fat, and 28% protein in comparison to an HCD with 53% carbohydrates, 30% fat, and 17% protein. They found a lower glycemic variability and smaller excursions in the LCD group, and a reduced need for diabetes medication. HbA1c and weight loss was not different.
Results from some of the trials included in the present analysis suggest that the lack of consistency of the effect of LCD could be related to a decline in dietary adherence over time.15 ,16 ,22 Apart from a lowering of the daily glycemic challenge, an initial hypoglycemic effect of LCD followed by an attenuation of the efficacy could also be due to changes in gut microbiota as a consequence of the altered carbohydrate intake followed by gradual adaptive mechanisms.28
Our findings and recent trials suggest that LCD may be superior to HCD with respect to glucose level and postprandial excursions, but only as long as the subject adheres to the diet. However, the effect on glycemic control is limited and the importance of glucose excursions in the pathogenesis of cardiovascular complications in diabetes is still under debate.29
Overall, and given the heterogeneity of the HbA1c estimate and other potential bias, the present evidence is insufficient to support LCD as superior to HCD, but the evidence does support LCD as an appropriate alternative.
We found that iso-caloric low to moderate carbohydrate diets and HCD had similar effects on BMI or body weight throughout the trials. This is consistent with recent studies showing that LCD does not increase energy expenditure to a relevant extent.30 Waist circumference was not included in the present analysis, but did not differ between groups in the individual studies where it was measured. Some recent reviews of predominately obese non-diabetic subjects report greater weight loss with LCD compared with low-fat diet,7 others find equal effect of LCD and HCD.8 No effect is reported in subgroups of diabetic subjects7 ,8 and in meta-analyses of randomized trials in type 2 diabetes.9
We have only focused on LDL cholesterol in the present analysis, and found equal effect of LCD and control diets. This is in accordance with previous findings. In some reviews of mixed groups of subjects, LCD lead to minor but significant changes in lipids7 compared with low-fat diet. Triglycerides were lower, and HDL as well as LDL cholesterol were higher.
As far as we know the long-term effect of LCD on physical performance and endurance has not yet been studied in subjects with type 2 diabetes. We found a non-significant numeric worsening of the physical component of the QoL score in the LCD group compared with the HCD group. A recent randomized trial with QoL as the primary outcome found equal improvement of Diabetes-39 questionnaire and problem areas in diabetes (PAID).31 However, most of the elements, including energy and mobility, tended to improve more in the low-fat HCD group (SF-39). If subjects experience low physical capacity and energy during LCD, this could explain the lack of adherence to the diet over time.
Strengths and limitations
The major strength of the present meta-analysis is that we used the GRADE approach to a systematic review of high-quality randomized trials. We predefined a relevant clinical question to be answered, as well as the population, the comparator, and the outcomes.
Changes in glucose-lowering medication have probably led to an underestimation of the effect of LCD on glycemic control. This and variability in adherence to the diet are probably the main factors modifying the effect of LCD on glycemic control in type 2 diabetes. However, many other factors could potentially contribute to the heterogeneity of the results. The duration and intensity of the nutrition therapy, the carbohydrate and total daily calorie intake in the LCD and the HCD groups, the glycemic index of the carbohydrates, the fat and protein intake, baseline HbA1c, and adherence to the prescribed diet. Finally, the included studies all have potential performance bias due to the lack of blinding of subjects and personnel. However, this problem cannot be solved.
Conclusion
We conclude that carbohydrate restriction (E% below 45%) has a greater effect on glycemic control in type 2 diabetes than an HCD in the short term. The magnitude of the effect was correlated to the carbohydrate intake, the greater the restriction, the greater glucose lowering, a relationship that has not been demonstrated earlier. In the long term, the glucose-lowering effect of LCD and HCD was similar. This may be due to subjects failing, over time, to adhere to the LCD, or to adaptive mechanisms. Iso-caloric LCD and HCD had similar effects on body weight, LDL cholesterol, and QoL.
Acknowledgments
A special thanks to Conni Skrubbeltrang for writing the search protocols and performing the search of the literature for guidelines, reviews, and randomized trials. The authors thank the staff of the Danish Health Authority and the other members of the working group in the development of the Danish National Clinical Guideline for lifestyle intervention in type 2 diabetes.
References
Footnotes
Contributors OS was the guarantor for conducting the study according to GRADE, data interpretation, producing tables and figures, and writing the manuscript. OS takes responsibility for the integrity of the data and the accuracy of the analysis. GMP assisted in the GRADE process and in the writing of the manuscript. HKA preformed the meta-analysis and assisted in the GRADE process and writing of the manuscript. AA contributed to the data analysis and the writing of the manuscript. All authors have reviewed and approved the revised manuscript.
Funding This research received no specific grant. OS received grant from the Danish Health Authority as the primary author of the Danish National Clinical Guideline for lifestyle intervention in type 2 diabetes.
Competing interests OS, GMP, and HKA report no competing interests. AA is a member of advisory boards/consultant for Lucozade Ribena Suntory, UK, McCain Foods Limited, USA, McDonald's, USA, Nestlé Research Center, Switzerland, Swedish Dairy, and Weight Watchers, USA. Outside the present paper, research conducted at his department is often funded by grants from interests in the food and beverage sector. Recipient of honoraria as Associate Editor, American Journal of Clinical Nutrition, and membership of the Editorial Boards of Annals of Nutrition and Metabolism, and of Annual Review of Nutrition. Recipient of travel expenses and/or modest honoraria (<$2000) for lectures given at national and international meetings, often with support from one or more corporate sponsors. Cofounder and co-owner of the University of Copenhagen spin-out companys Mobile Fitness A/S & Flaxslim ApS, Denmark. Recipient of royalties form a number of textbooks, and popular diet and cookery books. Coinventor of a number of patents owned by UCPH, in accordance with Danish law.
Provenance and peer review Not commissioned; externally peer reviewed.
Data sharing statement Supplementary data are available at the Danish Health Authority home page, PICO 4. (https://http://www.sst.dk/da/udgivelser/2015/nkr-type2diabetes).