Article Text

Abstract
Objective The objective of the current study was to compare the responses to different ex vivo immunogenic challenges between immune cells derived from metabolically healthy subjects with obesity and subjects with obesity and type 2 diabetes.
Research design and methods We recruited 10 metabolically healthy subjects with obesity (Edmonton Obesity Staging System (EOSS) stage 0) and 9 subjects with obesity and type 2 diabetes (EOSS stage 2) aged between 21 years and 70 years and matched for body mass index. Peripheral blood mononuclear cells (PBMCs) were isolated and immune cell phenotypes and ex vivo cytokine production after phytohaemagglutinin (PHA, a T cell mitogen) stimulation were determined. Neutrophil oxidative burst activity was assessed in whole blood.
Results PBMCs from subjects with stage 2 obesity produced significantly less interleukin (IL)-2, IL-6 and tumour necrosis factor α after PHA stimulation than PBMCs from subjects with stage 0 obesity (all, p<0.05). Subjects with stage 2 obesity also had higher proportions of cytotoxic T cells, activated helper T cells (CD4+CD278+) and inflammatory monocytes (CD14+CRTh2+, all p<0.05). Poststimulation, neutrophils from subjects with stage 2 obesity produced significantly more free radicals, were larger and more granular and had a lower stimulation index (all p<0.05).
Conclusions Our results suggest that compared with obese individuals metabolically healthy individuals with obesity and type 2 diabetes have an impaired neutrophil function and T cell response on challenge despite having a T cell population expressing more activation markers which may be partly responsible for the increased prevalence of infection reported in this population.
- immunology
- type 2 diabetes
- obesity
- inflammation
- metabolically healthy subjects
This is an Open Access article distributed in accordance with the Creative Commons Attribution Non Commercial (CC BY-NC 4.0) license, which permits others to distribute, remix, adapt, build upon this work non-commercially, and license their derivative works on different terms, provided the original work is properly cited and the use is non-commercial. See: http://creativecommons.org/licenses/by-nc/4.0/
Statistics from Altmetric.com
Significance of the study
What is already known about this subject?
Obesity and type 2 diabetes are associated with an increased prevalence and severity of common infections but the underlying mechanisms responsible for this remain largely unknown.
Individuals with obesity have altered immune function compared with lean individuals and this is thought to be attributable to the excess adipose tissue leading to the release of proinflammatory cytokines and an excessive recruitment and infiltration of macrophages.
Studies comparing individuals with type 2 diabetes to healthy individuals suggest that elevated plasma glucose concentrations play an important role in the deterioration of immunity.
Whether or not abnormalities in immune function are dependent on the presence of metabolic impairments (eg, dysglycaemia) or are mediated by the presence of excess body fat per se remains unknown.
What are the new findings?
We demonstrated for the first time that compared with obese individuals metabolically healthy individuals with obesity and type 2 diabetes have an impaired T cell response after challenge despite having a T cell population expressing more activation markers.
Neutrophil function was also altered in subjects with obesity and type 2 diabetes with a lower stimulation index poststimulation compared with metabolically healthy individuals with obesity.
How might these results change the focus of research or clinical practice?
Interventions should focus at improving glycemic control in individuals with type 2 diabetes in order to improve immune dysfunction.
Introduction
Obesity is a heterogeneous chronic disease characterised by the accumulation of abnormal or excess body fat that may impair health1 and is associated with increased risk for the development of cardiovascular diseases and type 2 diabetes.2 3 This increased risk for cardiometabolic diseases in individuals with obesity may be mediated by the presence of chronic low-grade systemic inflammation, characterised by elevated plasma C reactive protein (CRP) levels,2 4 which may in turn be mediated by perturbations in the immune system.5 Indeed, studies in subjects with normal weight and obesity suggest that excess adipose tissue and adipocyte hypertrophy are associated with an increased release of proinflammatory cytokines in the circulation and an excessive recruitment and infiltration of immune cells, specifically macrophages.5
On the other hand, there is considerable clinical evidence that obesity and especially type 2 diabetes6 are associated with an increased prevalence and severity of common infections.7 8 The underlying mechanisms responsible for this increased prevalence of infections remains to be determined as most of the work on the immune dysfunction has focused on the presence of inflammatory biomarkers and alterations in the immune system associated with adipose tissue in the presence of obesity and/or diabetes. It has been consistently reported that individuals with obesity have altered systemic immune function compared with lean individuals.9 Moreover, studies comparing individuals with type 2 diabetes to healthy individuals suggest that elevated plasma glucose concentrations play an important role in the deterioration of immunity.9 Whether or not, these abnormalities in immune function are dependent on the presence of metabolic impairments (eg, dysglycaemia) or are mediated by the presence of excess body fat per se remains unknown.
Recently there has been increased interest in so-called metabolically healthy individuals with obesity that are characterised clinically by the lack of metabolic risk factors despite elevated body mass index (BMI).10 Considering that obesity plays such an integral role in chronic diseases and inflammation, the aim of the current study was to test the hypothesis that individuals with obesity and type 2 diabetes have greater impairment in immune function compared with metabolically healthy individuals with obesity. We used the Edmonton Obesity Staging System (EOSS) to identify a cohort of individuals with obesity who were metabolically healthy (stage 0 obesity) and a cohort of individuals with obesity who had type 2 diabetes (stage 2 obesity).11
Research design and methods
Subjects
Nineteen subjects (5 men, 14 women) aged between 21 years and 70 years, from the Edmonton City metropolitan area, with a BMI ≥35 kg/m2 were recruited for the study. Subjects were classified as having stage 0 obesity (n=10) or stage 2 obesity (n=9) according to the EOSS,11 which classifies individuals with obesity according to the presence of obesity related impairment of mental, physical and functional health on a 5-point ordinal scale, and has been shown to better predict all-cause mortality than BMI or other anthropometric measures of excess body fat.10 In the present study, all participants with stage 2 obesity had a previous diagnosis of type 2 diabetes, were all taking antidiabetic medication (metformin (n=8) and/or insulin (n=2)) and were recruited through the Alberta Diabetes Institute. These participants underwent a regular screening process and their diabetes status was confirmed by measuring the glycated haemoglobin A1c (HbA1c). The stage 0 obesity participants were all recruited through the Edmonton Adult Bariatric Specialty Clinic after being referred by the physician if they had been classified as ‘metabolically healthy’ based on the EOSS (ie, stage 0). All subjects with stage 0 obesity, by definition, were metabolically healthy with normal blood glucose and lipid markers. Subjects were excluded if they had undergone surgery in the past 3 months, were diagnosed with an inflammatory condition, were currently taking anti-inflammatory medication, had recent fluctuation in body weight (ie, a change of more than 5% in the past 3 months) or had a known infection at the time of blood draw. Informed written consent was obtained from all participant prior to his/her involvement in the study.
Peripheral blood samples
Blood samples were taken at the same time of the day for all subjects and in the fasting state for all subjects in the stage 0 group and two subjects in the stage 2 group. Unlike plasma lipids concentrations, 12 hours fast has a limited impact on immune function/phenotype12 and therefore was not included as a requirement for individuals with type 2 diabetes (stage 2 group) to reduce the risk of hypoglycaemia. Participants in the stage 2 obesity group were given the option to be or not in the fasting state and two volunteers came fasted at the time of the blood draw. Those who chose not to be in the fasting state were asked to consume only a light breakfast comprising one cup of unsweetened cereal or oatmeal with 125 mL of milk. A venous blood sample (18 mL) was collected from each participant. Blood samples were collected in heparinised vacutainers and kept at room temperature until processed. Complete blood cell counts/differentials were analysed using a Beckman Coulter haematology analyser (Beckman Coulter, Mississauga, Ontario, Canada).
Lymphocyte phenotyping
Whole blood was centrifuged at 1350 × g for 10 min. The buffy coat was resuspended in lysis buffer (eBioscience, San Diego, California, USA) to lyse red blood cells, and the remaining cells were washed twice with 4% volume/volume fetal bovine serum (FBS) in phosphate-buffered saline (PBS). Immune cell subsets were identified by flow cytometry with labelled monoclonal antibodies (mAb) as previously described.13 Briefly, cells were incubated for 30 min at 4°C with prelabelled mAb, applied in combination to quantify various immune cell phenotypes. Cells were then washed and fixed in 1% paraformaldehyde (10 g/L; Anachemia Science, Montreal, Quebec, Canada) in PBS with sodium azide as the preservative. All samples were acquired within 72 hours by flow cytometry (FACSCanto II, BD Bioscience, San Jose, California, USA) and analysed according to the relative fluorescence intensity using Kaluza Software (Beckman Coulter, Mississauga, Ontario, Canada). For intracellular Foxp3 staining, cells were first labelled with CD3, CD4 and CD25 for 30 min at 4°C, washed, then incubated in Foxp3 fixation/permeabilisation solution (eBioscience) for 60 min at 4°C. The permeabilised cells were incubated with Foxp3 antibody (eBioscience) at 4°C overnight. The Foxp3-labelled cells were washed, fixed and analysed as above.
For staining with chemoattractant-homologous receptor expressed on T helper 2 cells (CRTh2), whole blood samples (100 µL) were incubated with 2 µL of fragment crystallisable region blocking reagent (Miltenyi Biotec, Auburn, California, USA), 16.7 µL mouse IgG and 16.7 µL rat IgG blockers (Invitrogen) for 30 min in a dark at room temperature to prevent non-specific binding. Positive controls were incubated with biotinylated anti-CRTh2 for 30 min at room temperature, followed by 15 min incubation in the dark at room temperature with lysing buffer (eBioscience). Tubes were then centrifuged for 5 min at 750 × g (Jouan, Perkin Elmer, Woodbridge, Ontario, Canada) and the supernatant was removed by aspiration. Cells were washed twice and then incubated with 10 µL of streptavidin-allophycocyanin (APC), followed by an incubation with the specific mAb for 30 min at room temperature. Isotype controls were included for all tests: IgG1-phycoerythrin (PE), IgG2a-fluorescein isothiocynate (FITC), and IgG2b-PE (BD Bioscience, Mississauga, Ontario, Canada); IgG1-FITC and biotinylated IgG2a (Abd Serotec, Raleigh, North Carolina, USA); IgG1-FITC and IgG1-PerCP-Cy5.5 (eBioscience, San Diego, CA); IgG1-PE (Beckman Coulter, Mississauga, Ontario, Canada). Cells were fixed and analysed by flow cytometry. Regarding the proportionate analysis of CRTh2+ cells, cell population was first gated for one of the following antibodies: CD4, CD8, CCR3, CD203c and CD14 (low granular cells were gated with low side scatter (SSC-H) and high granular cells were gated with high SSC-H), and then cells that were found to be positive for the desired antibody were then gated for CRTh2+.
Lymphocyte isolation and stimulation
Peripheral blood mononuclear cells (PBMCs) were isolated and purified on a Ficoll density gradient of Histopaque 1077 (Sigma-Aldrich Canada, Oakville, Ontario, Canada) as previously described.13 Lymphocytes were resuspended in complete culture medium (Roswell Park Memorial Institute medium (RPMI) 1640; Invitrogen) containing 5% (v/v) FBS, 25 mmoL/L 4-(2-hydroxyethyl)-1-piperazineethanesulfonic acid (HEPES), 2.5 μmol/mL 2-mercaptoethanol and 1% (v/v) antibiotic/antimycotic solution (Invitrogen). Cells were counted using a haemocytometer and trypan blue exclusion to determine cell viability. Lymphocytes (1×10⁶ mL) were cultured with or without phytohaemagglutinin (PHA, 10 µg/mL; Sigma-Aldrich Canada) or lipopolysaccharide (LPS, 25 µg/mL; Sigma-AldrichCanada) for 48 hours at 37°C. After incubation, tubes were centrifuged at 750 x g for 5 min to pellet cells, and the supernatant fraction was stored at −80°C for subsequent cytokine analyses.
Cytokine concentrations in plasma and postculture medium
Whole blood was centrifuged at 1350 × g for 10 min and the plasma was removed and stored in 1 mL aliquots at −80o C for subsequent analyses. Commercial ELISA kits for IL-6 and CRP(R&D Systems, Minneapolis, Minnesota, USA) and IgG (Bethyl Laboratories, Montgomery, Texas, USA) were used to determine plasma concentrations according to the manufacturer’s instructions. Commercial ELISA kits for interferon γ (IFN-γ), IL-6, tumour necrosis factor α (TNF-α), IL-10, IL-2, IL-1β (eBioscience, San Diego, California, USA) and IgG (Bethyl Laboratories/Cedarlane Laboratories, Burlington, Ontario, Canada) were used to quantify these proteins in culture medium after lymphocyte stimulation with or without PHA and LPS, following the manufacturer’s instructions. All samples were analysed in duplicate and when necessary were diluted with assay diluent to fall within the linear detection range of the standard curves for CRP (0–50 ng/mL), IL-6 (0–300 pg/mL), IgG (0–1000 ng/mL) and IFN-γ, IL-6, IL-2, IL-1β (0–2000 pg/mL), and TNF-α and IL-10 (0–4000 pg/mL).
Neutrophil oxidative burst assay
Neutrophil oxidative burst activity was assessed in whole blood as previously described.14 In brief, the oxidation of dihydrorhodamine 123 (Invitrogen, Burlington, Ontario, Canada) to rhodamine 123 was measured before and 5 min, 10 min and 15 min after stimulation with phorbol myristate acetate (PMA, 3.2×10³ nM; Sigma-Aldrich Canada). The oxidation of dihydrorhodamine was quantified by flow cytometry. The stimulation index (SI) was calculated as follows: SI = (mean channel fluorescence time B − mean channel fluorescence time A) / (mean channel fluorescence time A).
Statistical analyses
Data are reported as mean ± SD unless indicated otherwise. All statistical analyses were conducted in SAS (V.9.4, Cary, North Carolina, USA). Statistical differences between stage 0 and stage 2 obesity groups were analysed using one-way analysis of variance (ANOVA) for continuous variables and using χ2 for categorical variables (ie, sex). Variables not normally distributed were log10 transformed prior to statistical analysis. As there was a significant difference in age between stage 0 and stage 2 obesity groups, we performed Spearman correlation’s analysis between age and all immunological variables (n=19) to determine the potential contribution of age on the immunological differences between groups. In case where there was a significant correlation with age we performed one-way ANOVA analysis while adjusting for age as a confounding variable in the model. Differences at p≤0.05 (two-sided) were considered statistically significant. Since the stage 0 obesity group only contained women and stage 2 group had four women and five men, we compared the women and men in the stage 2 group using the t-test procedure to determine if sex had a significant impact on the differences observed between the stage 0 and stage 2 obesity groups. Due to the small simple size, differences at p≤0.10 were considered statistically significant when comparing men and women in the stage 2 group.
Results
Subject characteristics
Characteristics of the study participants are shown in table 1. Participants in the stage 2 obesity group were older compared with participants in the stage 0 obesity group. No significant differences in body weight and BMI were observed between the two groups.
Anthropometric and metabolic characteristics of study participants*
Total and differential blood cell counts
Women had higher platelet counts (270.0±44.3 109/L vs 178.2±55.8 109/L, p=0.032) and lower mean platelet volume (7.4±0.8 fL vs 8.7±0.7 fL, p=0.025) compared with men. Platelet counts were also negatively correlated with age (n=19, r=−0.497) while the percentage of monocytes (r=0.537) and eosinophils (r=0.456) were positively associated with age (all p≤0.05). There were no significant differences between stage 0 and stage 2 obesity groups for red or white blood cell counts, haemoglobin, haematocrit, mean corpuscular volume, mean corpuscular haemoglobin, red cell distribution width, platelet counts, mean platelet volume, and total and per cent neutrophils, lymphocytes, monocytes, eosinophils and basophils (table 2). All measured blood cell counts fell within standard clinic reference ranges except for the percentage of monocytes and eosinophils that were slightly higher for both groups (table 2).
Total and differential blood cell counts in metabolically healthy individuals with obesity and subjects with obesity and type 2 diabetes*
Cytokine production by stimulated lymphocytes and plasma cytokine concentrations
PBMCs from subjects with stage 2 obesity produced significantly less IL-2, IL-6 and TNF-α after PHA stimulation than cells from subjects with stage 0 obesity (all p<0.05, table 3). IL-6 production after LPS stimulation also tended to be lower in subjects in the stage 2 obesity group compared with those in the stage 0 obesity group (p=0.080). No statistically significant differences were observed between groups for IL-10 and IFN-γ production after PHA stimulation and for IL-1β, IL-10, IFN-γ and IgG production after LPS stimulation (table 3). In the stage 2 obesity group, women had lower IL-1β production after LPS stimulation compared with men (255±143 pg/mL vs 487±148 pg/mL, p=0.066). Plasma concentrations of IL-6, CRP and IgG did not differ significantly between stage 0 and stage 2 obesity groups. Plasma IgG concentrations were significantly and positively correlated with age (n=19, r=0.554, p=0.017).
Cytokine production by lymphocytes stimulated with mitogens and plasma concentrations of inflammatory markers in metabolically healthy individuals with obesity and subjects with obesity and type 2 diabetes*
Neutrophil function
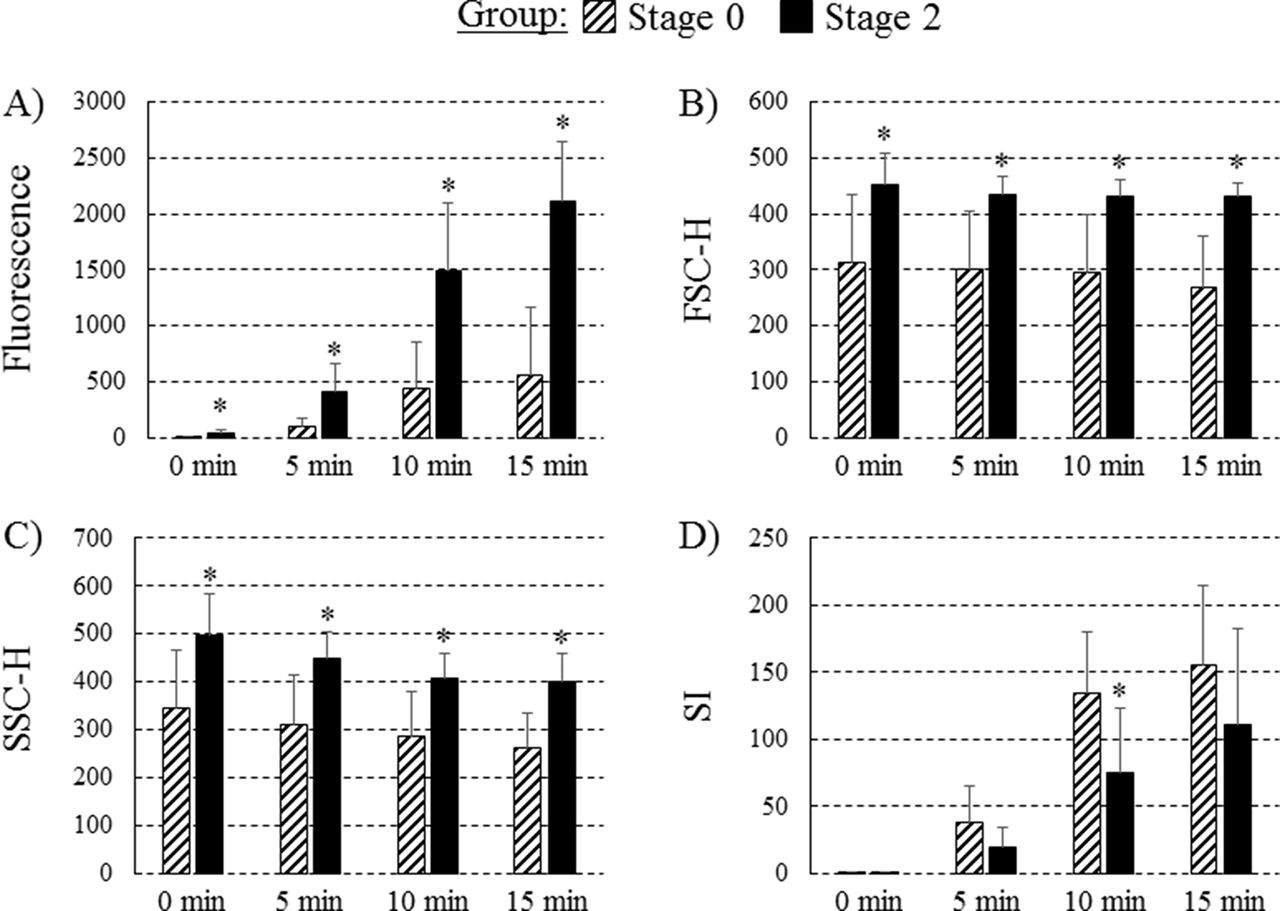
At time 0 min, 5 min, 10 min and 15 min poststimulation, neutrophils from subjects with stage 2 obesity produced significantly more free radicals (as determined by a higher mean fluorescence; figure 1A, all p<0.05). At time 0 min, 5 min, 10 min and 15 min poststimulation, neutrophils from subjects with stage 2 obesity were larger (all p<0.05, figure 1B) and more granular (all p<0.05, figure 1C) than those from stage 0 subjects. The neutrophil stimulation index was significantly lower 10 min poststimulation in the stage 2 obesity group versus stage 0 group (p<0.05, figure 1D). Mean fluorescence intensity at time 0 min (n=19, r=0.609), 5 min (r=0.629), 10 min (r=0.618) and 15 min (r=0.688) poststimulation and the granularity of neutrophil 15 min poststimulation (r=0.503) were significantly and positively correlated with plasma glucose concentrations (all p<0.05).

Functional characteristics of neutrophils prior to and following (phorbol myristate acetate) PMA stimulation. (A) Neutrophil fluorescence intensity; (B) cell size (forward scatter (FSC-H)); (C) granularity (side scatter (SSC-H)); (D) stimulation index (SI) ((mean channel fluorescence time B − mean channel fluorescence time A) / (mean channel fluorescence time A)) before (0 min) and after (5 min, 10 min, 15 min) PMA stimulation. Values are presented as mean ±SE. * indicates mean within each time point is significantly different from the stage 0 obesity group (p<0.05).
Immune phenotype
Both groups had similar proportions of total T cells (CD3+ cells), but subjects with stage 2 obesity had a higher proportion of cytotoxic T cells (CD3+CD8+) and activated Th cells (CD4+CD278+) when compared with subjects with stage 0 obesity (both p<0.05, table 4). Participants in the stage 2 obesity group had a higher proportion of total immune cells expressing the activation marker CD80 (p<0.05), which was mainly attributed to the subset of Th cells (CD4+CD80+), however, this did not reach statistical significance. Participants in the stage 2 obesity group also had significantly higher proportion of naïve T cells (percentage of CD3+ expressing CD45RA+) compared with metabolically healthy subjects with obesity (both p<0.05). There were no differences between groups in the proportion of B cells (total CD19+ cells), activated B cells (CD19+CD80+) and natural killer cells (CD3-CD56+). Participants in the stage 2 obesity group had a significantly higher percentage of monocytes (CD14) expressing CRTh2 compared with metabolically healthy subjects with obesity. Age was positively correlated with the proportion of total cells expressing CD3+ (n=19, r=0.497) and CD278+ (r=0.626) and the proportion of CD4+CD25+ cells (r=0.722), CD4+CD278+ cells (r=0.725) and regulatory T cells (CD3+CD4+CD25+Foxp3+, r=0.602, all p<0.04). The proportion of CD4+CD25+ (n=19, r=0.566) and CD4+CD278+ (r=0.587) cells and the proportion of total cells expressing CD278 (r=0.639) were positively correlated with plasma glucose concentrations (all p<0.02).
Lymphocyte phenotypes of subjects with stage 0 and stage 2 obesity*
Discussion
We demonstrated for the first time that type 2 diabetes is associated with additional perturbations in the immune system compared with obese individuals metabolically healthy characterised by an impaired T cell and neutrophil response after challenge despite having a T cell population expressing more activation markers. On the other hand, no differences were observed in the proportion and concentration of leucocytes between metabolically healthy individuals with obesity and those with type 2 diabetes. In the stage 2 obesity group, women had higher platelet counts compared with men and age was negatively correlated with platelet counts. This is consistent with previous studies showing that men have lower platelet concentrations compared with women and that age is associated with lower platelet counts.15 16 Gonzalez-Quintela et al 17 reported in their study that serum IgG levels tended to increase with age which is in accordance with the positive correlation between age and plasma IgG concentrations observed in our study. Interestingly, we also observed a sex effect for the production of IL-1β after LPS stimulation for which women in the stage 2 obesity group produced less IL-1β compared with men. This is consistent to some extent with the study by Aulock et al 18 in which they also reported a lower IL-1β production in whole blood after LPS stimulation in women compared with men that was no longer significant when cytokine production was normalised for the monocyte counts. However, we did not observe any differences in the monocyte count in our study between men and women.
We showed that the ability of immune cells to respond on challenge was impaired in subjects with obesity and type 2 diabetes compared with metabolically healthy individuals with obesity. PBMCs from subjects with type 2 diabetes produced significantly less IL-2, a surrogate marker of proliferation, when stimulated with a T cell mitogen (PHA). The lower production of IL-2 after PHA stimulation observed in individuals with obesity and type 2 diabetes suggests that for a similar BMI, diabetes further impairs the ability of T cells to respond and proliferate on challenge. Chronic elevated plasma glucose concentration is thought to be responsible at least partly for the lower ability to secrete cytokines after stimulation. Indeed, previous studies have demonstrated that addition of glucose to unstimulated non-diabetic monocytes increased their ‘resting’ TNF-α and IL-6 production19 and that after stimulation with pokeweed mitogen, addition of glucose to PBMC reduced IL-2, IL-6 and IL-10 production in a dose-response manner.20 Our results are in agreement with the concept of tolerance to stimulation that has been previously proposed,21 where higher cytokine production at baseline prevents immune cells to mount an adequate response on challenge.
We also demonstrated that subjects with obesity and type 2 diabetes had altered neutrophil function compared with metabolically healthy subjects with obesity, characterised by a higher free radical production and neutrophils that were larger and more granular pre-PMA-stimulation and post-PMA-stimulation. Poststimulation, the neutrophil stimulation index was lower. Delamaire et al 22 have also reported perturbations in other functions of neutrophils in patients with diabetes such has a lower chemotaxis towards the bacterial oligopeptide formyl-methionyl-leucyl-phenylalanine (FMLP) and a higher adherence compared with healthy controls. Consistent with our results, they also showed a spontaneous activation of neutrophils and an increased production of free radicals at baseline leading to a lower response post-PMA-stimulation.22 Therefore, it is possible that the higher resting activation status of neutrophils in individuals with diabetes prevents them from further activation after stimulation. Impairment of neutrophil function in individuals with type 1 or type 2 diabetes have also been reported in other studies and appears to be mainly attributed to glycaemic control.22 23 Indeed, hyperglycaemia is associated with further reduction in neutrophil chemotaxis and chemiluminescence22 and HbA1c was negatively correlated with the neutrophil phagocytic function.23 Consistently, plasma glucose concentrations were significantly and positively correlated with the fluorescence intensity and the granularity of neutrophil in our study confirming that glycaemic control is partly responsible for the differences observed between stage 0 and stage 2 obesity groups. Overall, our results suggest that individuals with obesity and type 2 diabetes have an impaired cytokine response after challenge and an impaired neutrophil bactericidal activity.
Despite having similar proportions of total T cells (CD3+ cells) and Th cells (CD3+CD4+ cells), the stage 2 obesity group had a higher proportion of cytotoxic T cells (CD3+CD8+) and Th cells expressing activation markers such as CD80 and CD278, a costimulatory molecule also known as inducible T cell co-stimulator (ICOS). CD278 is expressed on activated T cells and is thought to play an important role in cytokine synthesis such as IL-2 and regulation of T cell proliferation.24 Indeed, ICOS-/-CD4+ T cells activated with plate-bound anti-CD3 produced significantly less IL-2 and have a lower ability to proliferate compared with wild type T cells.24 The lower IL-2 production by PBMC stimulated with PHA while having a higher proportion of Th cells expressing the IL-2 receptor and ICOS suggests that individuals with type 2 diabetes might have an intrinsic cellular defect impairing T cell function and response after immune challenges. This could be responsible, at least partly, for the higher prevalence of infection reported in individuals with diabetes.25 It is also possible that the higher proportion of activated Th cells observed in individuals with type 2 diabetes or hyperglycaemia is a compensatory mechanism for which T cells express more activation markers in an attempt to maintain a normal cytokine response to challenge. This is supported by the fact that in our study the proportion of Th cells expressing activation markers (CD4+CD25+ and CD4+CD278+) was positively correlated with plasma glucose concentrations. On the other hand, age was positively correlated with the proportion of total T cells (CD3+), CD4+CD25+ cells and Tregs (CD3+CD4+CD25+FoxP3+) in our study and the differences observed in these phenotypes between stage 0 and stage 2 obesity groups were no longer significant after adjusting for age. Our results are in accordance with previous studies reporting an increase in the proportion of CD4+CD25high Tregs and CD4+FoxP3+ Tregs with ageing.26 27
Interestingly, we report for the first time an increased proportion of monocytes expressing CRTh2 (CD14+CRTh2+). CRTh2 is a chemoattractant receptor expressed on numerous inflammatory cell types such as Th2 cells, eosinophils, basophils28 and type 2 innate lymphoid cells.29 Studies have demonstrated an increased presence of CRTh2-expressing cells within individuals with allergic disease30 31 and that blocking CRTh2 improved symptoms.32 33 Although few and inconsistent results have been reported regarding prevalence of allergic diseases in individuals with type 2 diabetes,34 35 they have a higher frequency and complicated course of respiratory infections.8 CRTh2 is a receptor for prostaglandin D2, a lipid mediator induced after allergen exposure36 and during bacterial response.37 As such, this pathway is now considered to be a non-allergic trigger of type 2 inflammation. Therefore, the higher proportion of monocytes expressing CRTh2 in individuals with type 2 diabetes in our study provides a potential mechanism that might contribute to the higher prevalence of allergies34 and/or respiratory infections in this population.
This pilot study has strengths and limitations. Although we had a small sample size, we had enough statistical power to identify important functional immunological differences (ie, cytokine production, neutrophil function and immune cells phenotype) between metabolically healthy obese individuals and those with type 2 diabetes. However, whether metabolically healthy obese individuals in our study had ‘normal’ immune function as compared with healthy weight individuals needs to be investigated in future studies. An inherent limitation to the population studied was the difference in sex and age observed between the stage 0 and stage 2 groups, for which women and younger obese subjects are less likely to be metabolically deteriorated.10 Although we assessed the contribution of sex and age on immunological variables and adjusted our statistical analyses for age, future studies should compare well balanced groups for sex and age in order to completely rule out these potential confounding factors. Another limitation pertains to the difference in the fasting state at the time of the blood draw between the stage 0 and stage 2 groups. Although it has been reported that being in non-fasting condition has little impact on immune parameters, this aspect needs to be ruled out in future studies. Finally, it would have been important to document the duration of the obesity and/or type 2 diabetes conditions in these participants to determine if the time of exposure has an impact on the differences observed in immunological variables.
Conclusion
In conclusion, we demonstrated that individuals with obesity and type 2 diabetes, BMI-matched to non-diabetic metabolically health individuals with obesity, have an impaired T cell response after challenge despite having a T cell population expressing more activation markers. Neutrophil function was also altered in subjects with obesity and type 2 diabetes with a lower stimulation index poststimulation. Overall, our results suggest that type 2 diabetes is associated with additional perturbations in the functionality of the immune system compared with metabolically healthy obese individuals which might be partly responsible for the increased prevalence of infection in this population.
Acknowledgments
The authors thank Lee-Ann Langkaas for her assistance in subject recruitment and blood draws. The authors also thank the participants, without whom the study would not have been possible.
References
Footnotes
Contributors CJF, LC and AMS designed and obtained funding for this study. MW was responsible for the screening of participants, coordinated the study and was responsible for the laboratory analysis with the help of SG. CR performed the statistical analyses, analysed the data and wrote the manuscript, which was reviewed critically by all authors.
Competing interests None declared.
Patient consent Obtained.
Ethics approval Human Research Ethics Board of the University of Alberta.
Provenance and peer review Not commissioned; externally peer reviewed.
Data sharing statement This was a pilot study and there are no additional variables that have been measured in this study that are not presented in this article.